Procedia Engineering 137 ( 2016 ) 649 – 658
1877-7058 © 2016 Published by Elsevier Ltd. This is an open access article under the CC BY-NC-ND license (http://creativecommons.org/licenses/by-nc-nd/4.0/).
Peer-review under responsibility of the Department of Transportation Engineering, Beijing Institute of Technology doi: 10.1016/j.proeng.2016.01.302
ScienceDirect
GITSS2015
Development of a Distributed Cooperative Vehicles
Control Algorithm Based on V2V Communication
Yi Zheng, Lisheng Jin*, Linlin Gao, Keyong Li, Yan Wang and Faji Wang
School of Transportation, JiLin University, ChangChun 130024, China
Abstract
This paper presents a new distributed Cooperative Vehicles Control (CVC) algorithm without any infrastructure. The algorithm is developed to manipulate individual vehicles’ travelling maneuvers based on V2V communication, so that vehicles can cross the intersection safely and rapidly. Assuming that all vehicles are fully automated, by eliminating the collision probability of vehicles at intersections, the CVC algorithm seeks a safe maneuver for vehicles approaching the intersection and manipulates them. To evaluate the performance of algorithm, we develop an integrated simulation framework. The results show that the CVC algorithm can significantly improve the efficiency of intersection compared with conventional signal control system under varying congestion conditions, moreover, the impact of communication performance on algorithm is also considered.
© 2016 The Authors. Published by Elsevier Ltd.
Peer-review under responsibility of the Department of Transportation Engineering, Beijing Institute of Technology.
Keywords: cooperative vehicles control algorithm; V2V communication; collision probability; simulation framework
1. Introduction
The growth of traffic flow in urban networks has recently brought lots of social problems such as heavy traffic congestion, traffic accidents and environment pollution. According to the statistics report of National Highway Traffic Safety Admin (NHTSA), in 2008, about six million traffic accidents occur on US Roads [15]. The total
* Corresponding author. Tel.: +86 0431 85095268; fax: +86 0431 85095370.
E-mail address: [email protected], [email protected], [email protected], [email protected], [email protected],
© 2016 Published by Elsevier Ltd. This is an open access article under the CC BY-NC-ND license (http://creativecommons.org/licenses/by-nc-nd/4.0/).
number of crashes reported in 2009 was 14% lower than that in 1999, still, 33808 people died, and about 2.2 million people were injured in 2009 [15], which is a traffic safety statistics that remains unsatisfactory. Intersection is the key area influencing the safety and efficiency of transportation system, unsignalized intersection is a common intersection type. Consequently, solving the safety and efficiency problem of the unsignalized intersection has become an imminent transportation demand.
The Connected Vehicles (CV) [1] is not a dependent technology solution, but an integration of wireless communications, data analytics, robotics, automatic etc. Compared with technologies such as visual sensors and computer processing, the CV can identify hazards on the roadway, and provide a two-way wireless communication environment enabling V2V/V2I communications. In vehicular ad-hoc network (VANET),vehicles equipped with communication devices could not only collect previous traffic data such as individual vehicle’s travelling maneuver, origination/destination, and trajectory but also share these data with other vehicles or infrastructures as well. In fact, cooperation between vehicles and/or between vehicles and infrastructure under CV environment has received a great deal of attention for its potential benefits. Many research projects on cooperative control system have been conducted to improve road safety, reduce exhaust emissions and avoid vehicle collisions.
Yusuke and Yasuhisa et al. [21] proposed a control mechanism of cooperative vehicles at intersection without any infrastructure, embedding communication device into the automated vehicles. Nonetheless, the limitations of algorithm are also notable, more specifically, simulation environment is too simple to reflect the actual situation accurately. Ashil and Lamine presented an adaptive, decentralized and cooperative collision avoidance system, which applies a constrained coupled EKF to estimate the states of a realistic, nonlinear, 5-state variable vehicle model [9]. The estimates are transmitted wirelessly to other vehicles using the up-to-date WAVE standards, and then vehicles use these estimates to optimize future movements. Qiu Jin et al. developed an intersection management system using a agent approach which includes vehicle agent and intersection agent [16]. In addition, multi-layer reservation policies and vehicle motion planning algorithm were developed. The simulation results showed that the system can considerably mitigate traffic congestion as well as reduce emissions and fuel consumption. Lee J and Park B proposed a decentralized cooperative vehicle intersection control (CVIC) algorithm [12]. The authors assumed that an intersection controller embedded within the roadside equipment, and the controller tried to find a safe maneuver for every vehicle by eliminating the potential overlaps of vehicular trajectories coming from all conflicting approaches. Its main limitation is that communication performances are assumed to be perfect, resulting in no packet drop or transmission delay.
As discussed above, cooperative vehicle intersection control is a significant road safety issue. Despite such promising benefits addressed by relevant studies reviewed in this section, treatments for packet drop and transmission delay were not clearly presented. In addition, most of studies were insufficient to cover varying traffic congestion cases. To handle such challenges, a distributed CVC algorithm based on V2V communication is proposed, which aimed at improving unsignalized intersection efficiency and ensuring vehicle safety. With respect to wireless communication, it was assumed that all involved vehicles are fully automated, equipping with communication device insides.
The goal of this paper is to measure the effectiveness of the CVC algorithm, and quantify the potential benefits of algorithm under varying traffic congestion and communication conditions. The algorithm is aimed at unsignalized intersections without any infrastructure, such as traffic signals, signs, and our main contributions can be summarized as follows.
1) The best driving maneuvers are obtained by estimating the collision probability at intersections, and adjust the speed of vehicles globally to avoid the crash.
2) The coupled simulation framework that integrated with traffic simulator VISSIM 4.3, network simulator NS-3.20 is developed.
3) An improved shuffled frog leaping algorithm is presented for solving the optimization problem derived from the collision probability of vehicles.
4) The performances of the distributed CVC algorithm are evaluated under varying traffic congestion and communication conditions.
2. Methodology
2.1. The Estimation of Collision Probability
The size of time to collision (TTC) [11] indicates the severity of conflicting events, that is the probability that a collision could result from a conflicting, hence, a lower TTC indicates a higher probability of a collision. Please notice that, the meanings of TTC for rear-end and crossing collision is different. When two consecutive vehicles get close, the value of TTC becomes big, and this situation is so dangerous. Thus, this paper mainly considers crossing collision, vehicles are not allowed to change lane and make a turn. With the prediction of TTC, we introduced a transformed coefficient CPI [11] (Collision Probability Indicator) for describing the possibility of potential collision for two vehicles, it is computed with a simple form as (1), note that collision scenario involving three or more vehicles isn’t considered in this paper.
1 ( ) cpi( ) TTC t k P k eG (1)
Where
G
is a scale parameter, from this equation, it could be easily found that Pcpi(k) is a monotone decreasingfunction about TTC that satisfies Pcpi(k)ę[0, 1). When Pcpi(k)ı
H
,we believe it is necessary for adjusting the speedof vehicles. Let the value of
G
andH
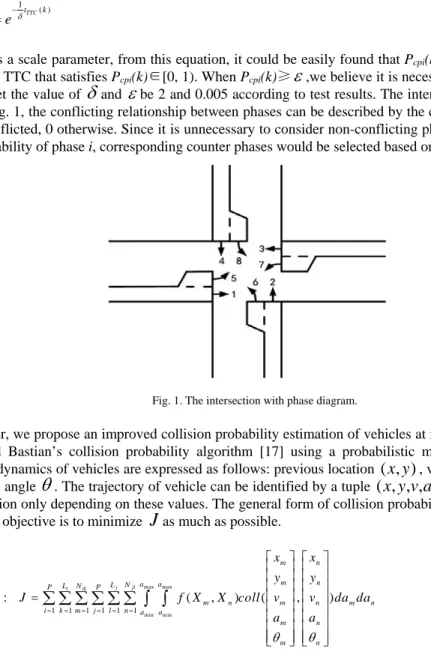
be 2 and 0.005 according to test results. The intersection with phase diagram is shown in Fig. 1, the conflicting relationship between phases can be described by the conflict matrix C = [cij], 1 ifphases are conflicted, 0 otherwise. Since it is unnecessary to consider non-conflicting phases when summing up the collision probability of phase i, corresponding counter phases would be selected based on the conflict matrix C.
Fig. 1. The intersection with phase diagram.
In this paper, we propose an improved collision probability estimation of vehicles at intersections, which is based on Stefan and Bastian’s collision probability algorithm [17] using a probabilistic model for the trajectories of vehicles. The dynamics of vehicles are expressed as follows: previous location
( , )
x y
, vehicle speedv
, accelerationa
and heading angleg
. The trajectory of vehicle can be identified by a tuple( , , , , )
x y v a
g
, hence, we can define a collision function only depending on these values. The general form of collision probability estimation is formulated as (2), and our objective is to minimizeJ
as much as possible.max max min min 1 1 1 1 1 1 . : ( , ) ( , ) j jl i ik m n m n a a L N L N P P m n m n m n i k m j l n a a m n m n x x y y
Obj Fun J f X X coll v v da da
a a g g 3 3 3 3 3 3 ¾ Î ¾ Î ¿ Ï ¿ Ï ¿ Ï ¿ Ï ¿ Ï ¿ Ï ¿ Ï ¿ Ï 3 ¿ Ï ¿ Ï ¿ Ï ¿ Ï ¿ Ï ¿ Ï ¿ Ï ¿ Ï À Ð À Ð
Ç Ç
ºº º º ºº
(2)Subject to:
1) Initial state conditions: with current time being t0, Xirepresents the trajectory of vehicle i.
0 ( ) ( ) i i X t t t v 3 3 (3a) 0 ( ) ( ) i i X t t t a 3 3 (3b)
2) Minimum Headway: the final form of two consecutive vehicles’ (e.g. vehicle i and i+1) minimum headway constraint is derived as (4a)-(4c).
2 1 1 1 ( 2( i i ) ) ( i i i ) 0 S a #a! R # a #v !v! R!S 4 (4a) 0 1 0 1 ( ) ( ) 2 i i i i S 3 a #v #X t !X ! t (4b) 2 1 1 1 0 1 1 ( 2 ( ) ) i i i i i R v v a X t a ! ! ! ! 3 # ! ! (4c)
3) Box bounds on control actions:
2 2 2 m in m in 0 0 2 2 max m ax 0 m ax( , , ) 2 ( ) 2( ( ) ( )) m in( , ) 2( ( ) ( )) i i i i i i i i i i v v v a a x t x t x t v v a a x t x t # # # # x # (5) Where:
P total phase numbers.
i, j phase number indices.
k,l lane identifier.
Li,Lj total number of lanes of phases i and j, respectively.
Nik,Njl total number vehicles on lane k and l of phases i and j, respectively. f (Xm, Xn) the probability that trajectories XmǃXn are chosen.
coll (Xm, Xn) collision function between vehicle m and n.
2.2. Control Algorithm
The motion control algorithm is distributed, which implies that there are no infrastructures (i.e. intersection controller) coordinating the motions of involved vehicles. The algorithm is developed based on Guo and Parker’s distributed motion planning algorithm [8]. However, we also considered the impact of communication performance, which reflects the reality.
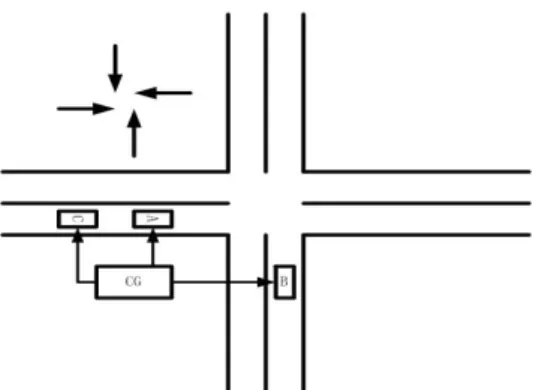
Upon approaching the intersection, if the vehicle is ready to cross the boundary, it starts broadcasting current motion states to other vehicles. When it leaves the intersection completely, it will stop broadcasting and no longer participate in cooperative collision avoidance. Once receiving information from other vehicles, the vehicle will examine the current collision conditions and partition all involved vehicles into Collision Groups (CGs). As shown in Fig. 2, vehicle A, B and C are in one CG, where Collision Group is a collection of vehicles whose trajectories has at least one intersection with other members in the same CG. If vehicle A is the only member in the CG, which means that vehicle A wouldn’t collide with any other vehicle, vehicle A can keep its current speed crossing the intersection. Otherwise, vehicle A and its CG member vehicle B and C will have to adjust their acceleration rates to avoid the crash.
In this paper, the priority phase and non-priority phase are determined based on comparison of the total number of vehicles. We believe that vehicles on the priority approach do not need to change their current speeds. As illustrated in Fig. 2, vehicle A and C locate on the priority approach, and vehicle B locates on the non-priority approach. Therefore, vehicle B estimates the TTC with vehicle A and C, then slows down using the optimal deceleration rate. Until vehicle C completely leaves the intersection, meaning that no potential conflicts are expected at intersection area, and vehicle B begins to speed up and cross the intersection rapidly. Once unavoidable situations occur, such as system failure, the optimization algorithm cannot obtain optimal solutions for involved vehicles, the vehicles that locate on the non-priority approach brake urgently and wait before stop line and continue to analyze the collision states between vehicles, vehicles on the priority approach pass through the intersection as soon as possible. Besides, a global order should be generated through wireless communication among vehicles and they behave following the global order. In this paper, van der Pol model (Steven 1994), that is one of the reaction-diffusion systems, is used to make a temporal pattern.
Fig. 2. Example of vehicle collision groups.
3. Simulation Cases
In order to explore the performance of the CVC algorithm, an appropriate simulation environment is quite necessary. This paper developed a loosely integrated simulation framework incorporating VISSIM 4.3 [20] for microscopic level vehicular simulation and NS-3.20 for V2V wireless communication simulation. The optimal travelling strategy is obtained by external optimizer to solve a non-linear constrained optimization problem. The simulation framework was developed under the Visual C# programming environment and the optimization method was implemented using MATLAB’s script language. Note that the framework has the potential to simulate more complex traffic scenarios in future research.
3.1. The Shuffled Frog Leaping Algorithm
It is generally understood that the evolution-based heuristic methods such as the shuffled frog leaping algorithm (SFLA) (Eusuff et al., 2003, 2006) or the genetic algorithm (GA) [7] have a better chance of finding an acceptable solution, although it may need longer computational time. We presented an improved SFLA to solve the optimization problem as (2), and obtain better solutions for this paper. The whole strategies are shown as follows:
The first Jumping: If rand ( )ı0.7 ( w) j b D 3ra n d p # p (6) ElseDj = 0 _ w _ w j n e w p 3o ld p !D (7)
Where: -DmaxİDjİDmax
The second Jumping:
( w)
j t
D 3ra n d p # p (8)
Where: tę (1, 2,..., m)
The third Jumping:
n e w _pw=L B+r a nd (UB-L B) (9)
Where: Djis the moving distance on component j.m is the number of sub-memeplex, which contains n virtual
frog. rand ( ) describes a random number between 0 and 1. Dmax represents the maximum value of position changing
allowed by frogs. Pb and Pw the best and worst frog’s position in the entire population, and Pt the best frog’s position
in the sub-memeplex. The UB and LB are the upper and lower limitations of the searching space, respectively. For details regarding SFLA, we refer the reader to Eusuff et al. [4,5]. In order to prove the effectiveness of the improved SFLA, feasibility tests were conducted using three benchmark functions which include Sphere function, Rosenrock function and Schaffer's f7 function. The results indicate that the improved SFLA has better acceptable solution than GA and SFLA for given benchmark functions, as shown in Table 1.
Table 1. The results of feasibility tests.
3.2. Simulation Scenarios
In this paper, we focus on an isolated urban intersection with one lane in each direction without turning movements. Simulations were carried out to validate and evaluate the potential benefits of algorithm. However, it should be pointed out that the algorithm was initially designed to be applicable for general intersections including multiple lanes and turning movements, even roundabouts.
For the performance evaluation, a total of 40 volume scenarios covering the volume to saturation ratios (v/s) of each lane, ranging from 0.1 to 0.7 were created, and 1800 vehicles per hour is the saturation flow used for simulation cases. The v/s ratios were converted to the corresponding volume to capacity ratios (v/c) with the optimal timing plans obtained from the Synchro program [9] for all volume scenarios. The algorithm performances were evaluated compared with the fixed timing signal control system under different conditions. With a 3600s simulation period, each scenario was replicated 40 times with different random seeds, thus, a total of 1600 simulations were implemented. Traffic simulation parameters are listed in Table 2.
3.3. Wireless Communications
Dedicated short range communication (DSRC) is dedicated entirely to serve the safety issues related to transportation. In other words, they act as a communication link to send or receive messages from other vehicles. In this paper, we applied wireless multi-hop broadcasts for exchanging safety critical information via DSRC. Communication-relevant parameters are summarized in Table 3. For simulating the physical and medium access
Test functions Optmization algorithm Optimal solution Average solution Running time Sphere GA SFLA ISFLA GA 3.671E-3 2.194E-4 0.000 3.764 1.364E-2 1.251E-3 4.275E-4 6.598 29.3s 13.8s 25.7s 23.8s Rosenbrock SFLA ISFLA GA 1.954 3.252E-3 8.341E-1 2.768 9.874E-3 0.114 16.3s 27.4s 45.7s Schaffer’s f7 SFLA ISFLA 7.473E-1 3.561E-2 5.489 4.374E-1 36.2s 29.8s
control (PHY/MAC) layers, we employed the 5.9GHZ frequency based on the IEEE 802.11p protocol [3], passed messages down to the MAC, and calculated the collision probability based on the cooperative awareness messages (CAMs) (2010) and basic safety messages (BSMs) (2011) received from other vehicles.
Table 2. Traffic simulation parameters.
Parameter Value
Simulation time step 5ms
Min headway 1s Speed distribution (0, 25)m/s Lane length and width 500m, 3.5m
Vehicle length and width 4.5m, 1.75m Maximum acceleration and deceleration 4 m/s2, -4 m/s2
With respect to wireless communication, it was assumed that each vehicle in road network equipped with communication device. The vehicles within communication range continuously monitor the beaconing message and answer it. Once new vehicles successfully receive the beaconing message and answer, the new vehicles were registered as mobile nodes. Then, addresses were assigned to all involved nodes, which communicated with each other by the IP-based VANET. Considering the existence of transmission delay, the vehicles must have great computational ability, can perform a sequence of optimization process to obtain optimal acceleration/deceleration rates, assuming that the time required for performing the optimization process takes less than 100 ms. Meanwhile, vehicles need extract vehicular data from the neighboring vehicles approaching the intersection. The vehicular data mainly include: vehicle ID, speed, previous location, acceleration/deceleration rate, origination/destination and heading angle.
Table 3. Communication simulation parameters.
Parameter Value
Frequency band 5.9GHz Channel bandwidth 10MHz
Data rate 6Mbit/s Transmit power 20mW Sensitivity -94bBm
Wireless communication range 300m
4. Results and Discussion
Two intersection control strategies have been conducted for simulation cases: 1) Cooperative vehicles control algorithm using connected vehicles strategies, and 2) Fixed timing control algorithm: total cycle is 80 seconds, with green phase 35 seconds, yellow phase 3 seconds, and all-red clearance 2 second.
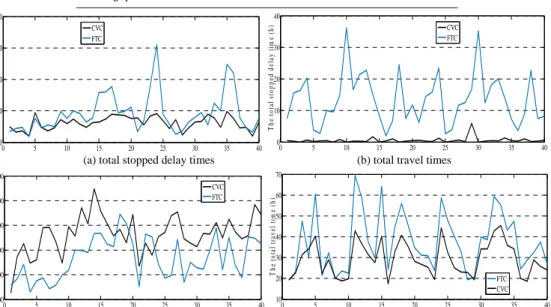
The performance gains of CVC algorithm are summarized in Table 4. It is shown that the algorithm is able to significantly reduce the total stopped delay times as well as the average queue length, resulting in 96.3% and 33.1% of improvements. In addition, the total travel times was also improved by 21.8%. Such huge reduction may result from better utilization to intersection by avoiding frequent stop-and-go maneuver. The total numbers of vehicles that went across the intersection per hour were also raised up to 7.10%. Traffic flow felled into a congestion state with the increase of vehicles approaching the intersection, and vehicles had to stop and wait before the stop line until right-of-way are obtained under FTC environment. As a result, the corresponding total stopped delay times got longer, even reached 37.5h. The CVC algorithm avoided this situation by adjusting the accelerations of vehicles cooperatively. Therefore, the total stopped delay times in CVC system always maintained at a quite low level which was less than 1h, all else followed. Taking into consideration that the algorithm is designed to ensure vehicles cross
the unsignalized intersections avoiding the crash. Such visible improvements substantially demonstrate the promising benefits of the CVC algorithm, as shown in Fig. 3.
Table 4. Summary of Gains of the CVC algorithm.
Measure FTC CVC Gain
Stopped delay times 13.5h 0.51h 96.3% Queue length 46.3m 31.0m 33.1%
Travel times 37.6h 29.4h 21.8% Throughputs 1356veh 1450veh 7.10%
0 5 10 15 20 25 30 35 40 0 50 100 150 200 T h e av er ag e q u eu e l en g th ( m ) CVC FTC 0 5 10 15 20 25 30 35 40 0 10 20 30 40 T h e t o ta l s toppe d de la y ti m e (h) CVC FTC
(a) total stopped delay times (b) total travel times
0 5 10 15 20 25 30 35 40 1200 1300 1400 1500 1600 1700 T he t ot a l th ro ughput s (ve h) CVC FTC 0 5 10 15 20 25 30 35 40 10 20 30 40 50 60 70 T h e to ta l tr av el tim e ( h ) FTC CVC
(c) total throughputs (d) average queue length
Fig. 3. The performance gains of CVC algorithm.
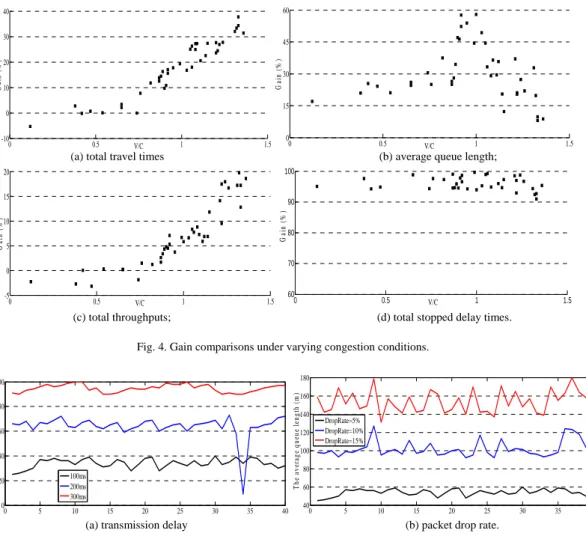
Fig. 4 indicates the performance gains of the CVC algorithm under varying congestion conditions. We can clearly see that the gains of the total travel times are significant when v/c ratio is more than 0.7, almost no gains were observed when v/c ratio is less than 0.7. It means that under uncongested condition, when the optimal speeds are below the free flow speeds, the total travel times of CVC algorithm are longer than that of FTC system. But the CVC algorithm can more efficiently utilize the intersection with traffic volume getting congested, as illustrated in Fig. 4(a). The average queue length and total throughput are similar to the cases of the total travel times, but its critical v/c ratio is 0.8. When v/c ratio is approximately 1, the gain of average queue length reaches the maximum, and then decreases gradually. In addition, Fig. 4(d) shows the gain of total stopped delay times is always above 90%.
This paper has evaluated the performance of the CVC algorithm under perfect communication environment in previous section. But in the real world, the performance of V2V communication (e.g. packet drop rate and
transmission delay) is influenced by many factors, such as transmission distance, the number and speeds of vehicles. Simulations were conducted to investigate mentioned situation, and we only take the average queue length as an example. The queue length increased from 30m to 90m while transmission delay ranged from 100ms to 300ms, as depicted in Fig. 5(a). The packet drop rate is associated with the packet length and transmission frequency. This paper sets the size of packet drop rate is 5%, 10% and 15% respectively. It was obviously observed in Fig. 5(b) that the average queue length sharply increased as packet drop rate changed, showing significant volatility. We can draw a conclusion that the performance of the CVC algorithm is directly influenced by wireless communication, becomes severe when V2V communication environment is imperfect.
0 0.5 1 1.5 -10 0 10 20 30 40 V/C Ga in ( % ) 0 0.5 1 1.5 0 15 30 45 60 V/C Ga in ( % )
(a) total travel times (b) average queue length;
0 0.5 1 1.5 -5 0 5 10 15 20 V/C Ga in ( % ) 0 0.5 1 1.5 60 70 80 90 100 V/C Ga in ( % )
(c) total throughputs; (d) total stopped delay times.
Fig. 4. Gain comparisons under varying congestion conditions.
0 5 10 15 20 25 30 35 40 0 20 40 60 80 100 T h e a ve ra ge que ue l engt h ( m ) 100ms 200ms 300ms 0 5 10 15 20 25 30 35 40 40 60 80 100 120 140 160 180 T h e a v er ag e q u eu e len g th ( m ) DropRate=5% DropRate=10% DropRate=15%
(a) transmission delay (b) packet drop rate.
Fig. 5. Effects of imperfect communication on the queue length.
5. Conclusions
This paper has presented a distributed CVC algorithm based on V2V communication. The algorithm is developed to ensure vehicles can cross the unsignalized intersection without colliding with other vehicles. The potential benefits of CVC algorithm over conventional fixed timing control system are evaluated under varying congestion conditions. Simulation results showed that the proposed CVC algorithm outperformed conventional control system in traffic safety and mobility. Moreover, this paper also considered the effect of imperfect communication on algorithm, and we found that communication performance directly affects the quality of algorithm. Hence, we need to make sure that V2V communication is reliable while running the algorithm.
In future work, the proposed distributed CVC algorithm will be tested in more complicated scenarios. A more realistic communication protocol between vehicles based on DSRC and SAE J2735 will be developed and implemented. Furthermore, we would like to improve the distributed vehicle control mechanism, and extend our simulation framework, making it have on-line processing ability.
References
[2]DSRC Message Communication Minimum Performance Requirements: Basic Safety Message for Vehicle Safety Applications, SAE, Draft Std. J2945.1 Revision 2.2, Apr. 2011, SAE, and Int. DSRC Committee.
[3]Eckhoff, D., Sommer, C., Dressler, F., 2012. On the necessity of accurate IEEE 802.11p models for IVC protocol simulation. The 75th IEEE VTC-Spring, Yokohama, Japan, May 2012, pp.1-5.
[4]Eusuff, M. M., Lansey K. E., 2003. Optimization of water distribution network design using the shuffled frog-leaping algorithm. Journal of Water Resources Planning and Management, 129(03):210-225.
[5]Eusuff, M. M., Lansey, K. E., Pasha, F., 2006. Shuffled frog-leaping algorithm: a memetic meta-heuristic for discrete optimization. Engineering Optimization, 38(02):129-154.
[6]Farahmand, A. S., Mili, L., 2009. Cooperative decentralized intersection collision avoidance using extended kalman filtering. IEEE 2009, pp. 977-982.
[7]Goldberg, D., 1989. Genetic Algorithms in search, Optimization, and Machine Learning. Reading, MA: Addison-Wesley, 1989.
[8]Guo, Y., Parkker, L. E., 2002. A distributed and optimal motion planning approach for multiple mobile robots. In Proceedings of the International Conference on Robotics and Automation.
[9]Husch, D., Albeck, J., 2004. SYNCHRO 6 User Guide. Trafficware.
[10]Intelligent Transport Systems (ITS); Vehicular Communications; Basic Set of Applications; Part 2: Specification of Cooperative Awareness Basic Service, ETSI, TS 102 637-2 V1.1.1, Apr.2010.
[11]Liu, J., Cai, B.G., Wang, Y.P., Wang, J., 2013. A lane level positioning-based cooperative vehicle conflict resolution algorithm for unsignalized intersection collisions. Computers and Electrical Engineering, 39, 1381–1398.
[12]Lee, J., Park, B., 2012. Development and evaluation of a cooperative vehicle intersection control algorithm under the connected vehicles environment. Intelligent Transportation System, IEEE Transactions on, 13(01),81-90.
[13]Mathworks, MAT LAB&SIMULINK, Math Works. Inc., Natick, Ma, 2014. [14]NS-3, see: http://www.nsnam.org/.
[15]NHTSA, “Traffic Safety Facts 2006 Data,” Washington D.C., 2008.
[16]Jin, Q., Wu, G.Y., et al., 2012. Advanced intersection management for connected vehicles using a multi-agent systems approach. 2012 Intelligent Vehicles Symposium, Spain, June 3-7, pp. 932-937.
[17]Stefan, J., Bastian B., Christoph, S., 2014. A Vehicular Networking Perspective on Estimating Vehicle Collision Probability at Intersections. IEEE Transactions on Vehicular Technology, 63(4), 1802-1812.
[18]Steven, H. S., 1994. Nonlinear Dynamics and Chaos. Westiview Press, ISBN 0-7382-0453-6. [19]Traffic Safety Facts 2009, National Highway Traffic Safety Admin., Washington D.C., 2010. [20]VISSIM 4.30 User Manual, PTV, Karlsruhe, Germany, 2007.
[21]Yusuke, I., Yasuhisa, H., et al, 2004. Zipping, Weaving: Control of Vehicle Group Behavior in Non-signalized Intersection. Proceedings of the 2004 IEEE International Conference on Robotics & Automation New Orleans, LA, April 2004.