䉷2004 by The University of Chicago. All rights reserved. 0002-9602/2004/11002-0004$10.00
Structural Holes and Good Ideas
Ronald S. BurtUniversity of Chicago
This article outlines the mechanism by which brokerage provides social capital. Opinion and behavior are more homogeneous within than between groups, so people connected across groups are more familiar with alternative ways of thinking and behaving. Brokerage across the structural holes between groups provides a vision of op-tions otherwise unseen, which is the mechanism by which brokerage becomes social capital. I review evidence consistent with the hy-pothesis, then look at the networks around managers in a large American electronics company. The organization is rife with struc-tural holes, and brokerage has its expected correlates. Compensation, positive performance evaluations, promotions, and good ideas are disproportionately in the hands of people whose networks span structural holes. The between-group brokers are more likely to ex-press ideas, less likely to have ideas dismissed, and more likely to have ideas evaluated as valuable. I close with implications for cre-ativity and structural change.
The hypothesis in this article is that people who stand near the holes in a social structure are at higher risk of having good ideas. The argument is that opinion and behavior are more homogeneous within than between groups, so people connected across groups are more familiar with alter-1Portions of this material were presented as the 2003 Coleman Lecture at the University
of Chicago, at the Harvard-MIT workshop on economic sociology, in workshops at the University of California at Berkeley, the University of Chicago, the University of Kentucky, the Russell Sage Foundation, the Stanford Graduate School of Business, the University of Texas at Dallas, Universiteit Utrecht, and the “Social Aspects of Rationality” conference at the 2003 meetings of the American Sociological Association. I am grateful to Christina Hardy for her assistance on the manuscript and to several colleagues for comments affecting the final text: William Barnett, James Baron, Jon-athan Bendor, Jack Birner, Matthew Bothner, Frank Dobbin, Chip Heath, Rachel Kranton, Rakesh Khurana, Jeffrey Pfeffer, Joel Podolny, Holly Raider, James Rauch, Don Ronchi, Ezra Zuckerman, and twoAJSreviewers. I am especially grateful to Peter Marsden for his comments as discussant at the Coleman Lecture. Direct cor-respondence to Ron Burt, Graduate School of Business, University of Chicago, Chi-cago, Illinois 60637. E-mail: [email protected]
American Journal of Sociology
350
native ways of thinking and behaving, which gives them more options to select from and synthesize. New ideas emerge from selection and syn-thesis across the structural holes between groups. Some fraction of those new ideas are good. “Good” will take on specific meaning with empirical data, but for the moment, a good idea broadly will be understood to be one that people praise and value.
Novelty is not a feature of this hypothesis. It is familiar in the socio-logical theory of Simmel ([1922] 1955) on conflicting group affiliations or Merton ([1948] 1968a, [1957] 1968c) on role sets and serendipity in science. The hypothesis is so broadly familiar, in fact, that one can see it in the remarks of prominent creatives. For example, discussing commerce and manners, Adam Smith ([1766] 1982, p. 539) noted that “when the mind is employed about a variety of objects it is some how expanded and enlarged.” Swedberg (1990, p. 3) begins his book on academics working the boundary between economics and sociology with John Stuart Mills’s ([1848] 1987, p. 581) opinion that “it is hardly possible to overrate the value . . . of placing human beings in contact with persons dissimilar to themselves, and with modes of thought and action unlike those with which they are familiar. . . . Such communication has always been, and is pe-culiarly in the present age, one of the primary sources of progress.” Jean-Rene´ Fourtou, former CEO of the French chemical giant Rhoˆne-Poulenc, observed that his scientists were stimulated to their best ideas by people outside their own discipline. Fourtou emphasizedle vide—literally, the emptiness; conceptually, structural holes—as essential to coming up with new ideas (Stewart 1996, p. 165): “Le videhas a huge function in orga-nizations. . . . Shock comes when different things meet. It’s the interface that’s interesting. . . . If you don’t leavele vide, you have no unexpected things, no creation. There are two types of management. You can try to design for everything, or you can leavele vide and say, ‘I don’t know either; what do you think?’” Biochemist Alex Zaffaroni is an exemplar. A former subordinate is quoted in an INSEAD video case explaining Zaffaroni’s value to his organization: “He is reading and thinking very widely. He is totally unafraid of any new technology in any area of human creativity. He has wonderful contacts with people in many different areas, so he sees the bridges between otherwise disparate fields.”2
2Also see Hatch (1999) on the importance of empty places to the integrated
impro-visation among jazz musicians playing together, Giuffe (1999) on the greater attention given to photographers with careers in networks of sparsely connected photographers, and more broadly, White (1993) on art as a struggle to establish identity in a network of brokering arrangements among agents and other artists. Productive analogy can be drawn to Merton’s (1968a) view of serendipity in science. Expanding on research’s familiar passive role in testing theory, Merton discusses active roles that research can play in shaping theory, one of which is the serendipity pattern in which an
“unantic-Though the hypothesis might lack novelty, it is intrinsically interesting to people who work with ideas and has a role in the theory of social capital. The link between good ideas and structural holes is key to the social capital of brokerage. I begin, in the next section, explaining how brokerage across structural holes provides a vision advantage that can translate into social capital. I then turn to a study population rich in structural holes and in which people are rewarded for building relations across the holes. If brokerage affects performance through the proposed vision advantage, there should be evidence of brokerage being associated with good ideas. I find that there is.
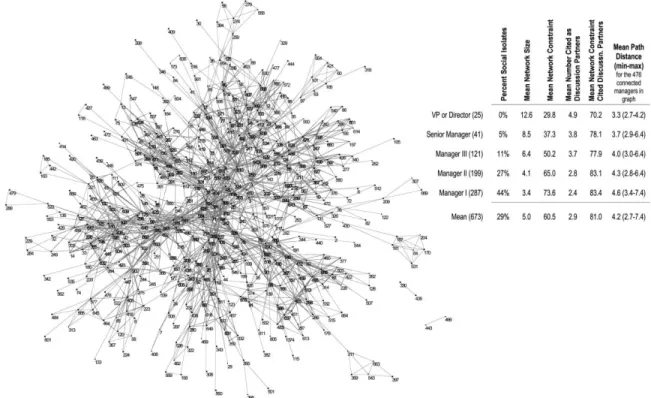
SMALL WORLDS, BROKERAGE, AND THE VISION ADVANTAGE Social capital exists where people have an advantage because of their location in a social structure. There is a great variety of work on the subject (e.g., Coleman 1990; Portes 1998; Lin 2002). The generic context is a social structure such as the one illustrated in figure 1. This figure shows a sociogram in which lines indicate where information flows more routinely, or more clearly, between people or groups, which are represented by dots. Solid lines indicate stronger flow. The defining features of the social structure are clusters of dense connection linked by occasional bridge relations between clusters. As a point of reference for later dis-cussion, a network segment is enlarged in the overlay box to highlight four clusters. Clusters A, B, and C are variably closed-network groups in the sense that relations are more dense within than between the groups. (The density table within the figure shows average relations within and between groups.) Cluster D (represented by open dots in the figure) is defined by structural equivalence. (The density table shows that people in cluster D have stronger relations with group C than with one another.) Structures of clusters connected by bridges occur in a wide variety of circumstances across different levels of aggregation (Watts and Strogatz 1998). Whether communities in a geographic region, divisions in a cor-poration, groups within a profession, or members of a team, people spe-cialize within clusters and integrate via bridges across clusters.
ipated, anomalous, and strategic datum” exerts pressure for initiating theory (p. 158). Serendipity must involve an unanticipated result (datum) inconsistent with established facts or the theory being tested, but the third attribute, strategic, is the key that distinguishes Merton’s view. The strategic value of a research result lies in its impli-cations for generalized theory, by which Merton (1968a, p. 159) refers to “what the observer brings to the datum rather than to the datum itself.” Research has strategic value when an observer sees how a finding has implications for what other people see as unrelated theory. The creative spark on which serendipity depends, in short, is to see bridges where others see holes.
The social structure represented in figure 1 corresponds to a division of labor familiar from Durkheim ([1893] 1933) but here focused on network structure within and across cluster specializations. Illustrative work in economics on factors responsible for such structures ranges from Hayek (1937, 1945) on the division of labor dependent on coordination across individuals with specialized knowledge (see Birner [1999] for explicit net-work imagery) to Becker and Murphy (1992) on the incentives to integrate rather than specialize (cf. Meltzer [2001] on integrating specialists in med-ical care). Network studies of such structures in sociology are illustrated by Feld (1981) on the social foci responsible for network clusters, building on Festinger, Schachter, and Back’s (1950) analysis of location effects in network formation and Blau’s (1977) work on integration parameters of social structure (cf. Bothner, Stuart, and White [2003] on cohesion with status differentiation). Applications to organization networks show the reproduction of ties (e.g., Gulati 1995; Gulati and Gargiulo 1999) in robust bridge-and-cluster structures (e.g., Kogut and Walker 2001; Baum, Ship-ilov, and Rowley 2003).
Two leadership roles are highlighted and are illustrated by Robert and James in figure 1. These two roles have long been studied in the litera-ture—for example, Schumpeter ([1912] 1934) on entrepreneurial “leaders” bringing together elements from separate production spheres in which people live by routines, Merton ([1949] 1968b) and Katz and Lazarsfeld (1955) on the diffusion of tastes through cosmopolitan “opinion leaders” whose relationships bridge the gaps between social worlds (see also Burt 1999), Rees (1966) on “extensive” search for information on job tunities versus “intensive” search for information about a specific oppor-tunity, Milgram (1967) and Travers and Milgram (1969) on the “small world” phenomenon in which people at great geographic distance can communicate with one another through surprisingly few intermediaries because of bridges between social worlds (see Watts 1999), Granovetter (1973) on the critical role that “weak ties” would play in information access and flow if bridge relations were weak rather than strong, Burt (1982, 1992) on the information access and control advantages created when relations span the “structural holes” between groups, March (1991) on organizations “exploring” for new opportunities versus “exploiting” known revenue streams, or Padgett and Ansell (1993) on the “robust action” made possible by structural holes between groups (cf. Fernandez and Gould [1993] on government agents bridging structural holes). A theme in this work is that behavior, opinion, and information, broadly conceived, are more homogeneous within than between groups. People focus on activities inside their own group, which creates holes in the information flow be-tween groups, or more simply, structural holes.
bro-American Journal of Sociology
354
kerage. The seven people connected to James are densely connected with one another within cluster B. The seven people connected to Robert are not connected with one another and are drawn from separate groups A, B, and C. Where James is positioned to integrate the work of people who have much in common, Robert is positioned to benefit from differences between people who vary in their behavior and opinions. Where James is positioned to drive variation out of group B, Robert is positioned to introduce into group B variation from groups A and C, with which he is familiar. Given greater homogeneity within than between groups, people whose networks bridge the structural holes between groups have earlier access to a broader diversity of information and have experience in trans-lating information across groups. This is the social capital of brokerage (Burt 1992, 2000, 2002). People whose networks bridge the structural holes between groups have an advantage in detecting and developing rewarding opportunities. Information arbitrage is their advantage. They are able to see early, see more broadly, and translate information across groups. Like over-the-horizon radar in an airplane, or an MRI in a medical procedure, brokerage across the structural holes between groups provides a vision of options otherwise unseen.
There are shades of gray. Robert is better positioned than James for brokerage, but note in the figure 1 insert box how James connects a northern and southern segment of cluster B. Within his immediate en-vironment, James has strong ties to both segments and so is positioned to broker their integration. The caution here is that structural holes and brokerage can be found in almost any task, depending on point of view. That caution stated, there is abundant and accumulating empirical evidence of increased returns to brokerage—in terms of more positive performance evaluations, faster promotions, higher compensation, and more successful teams (e.g., see Burt [2000, 2002] for review and Lin [2002] for broader context). There are also returns of a less desirable kind, such as success in organized crime (Williams 1998; Morselli 2003), fraud (Tillman and Indergaard 1999), or corporate misgovernance (Mitchell 2003, on Enron and Worldcom). Whatever the returns, constructive or corrosive, the issue in this article is not whether brokerage yields returns; at issue is the mechanism by which brokerage yields its documented returns.
Evidence on the mechanism is not abundant. Initial research established the social capital potential of brokerage by focusing on aggregate and contingent returns to brokerage. The association cannot be causal. Net-works do not act, they are a context for action. The next phase of work is to understand the information arbitrage by which people acting as brokers harvest the value buried in structural holes. Padgett and Ansell’s (1993) description of robust action is an exemplar. More generally, the
sociology of information will be central in the work, but there are many variations.
For example, consider four levels of brokerage through which a person could create value. The simplest act of brokerage is to make people on both sides of a structural hole aware of interests and difficulties in the other group. People who can communicate these issues between groups are important because so much conflict and confusion in organizations results from misunderstandings of the constraints on colleagues in other groups. Transferring best practice is a higher level of brokerage. People familiar with activities in two groups are more able than people confined within either group to see how a belief or practice in one group could create value in the other and to know how to translate the belief or practice into language digestible in the target group. A third level of brokerage is to draw analogies between groups ostensibly irrelevant to one another. People who recognize that the way other groups think or behave may have implications for the value of operations in their own group will have an advantage over those who do not. This step can be difficult, especially for people who have spent a long time inside one group. Such people often look for differences between themselves and others to justify their assertion that “our situation is different” so they can feel comfortable ignoring beliefs and behaviors different from their own. Differences can always be found if one wants to find them. The question is whether there are, by analogy, elements of belief or practice in one group that could have value in another. Synthesis is a fourth level of brokerage. People familiar with activities in two groups are more likely to see new beliefs or behaviors that combine elements from both groups.3
3I ignore idea content across the four levels of brokerage in idea production. I have
two reasons: data and traction. It would be difficult to accurately and reliably evaluate ideas across a foreign content domain. Below, I defer to senior management in the study population. Second, I have no tools that provide novel insights into idea content (relative to the network analysis tools that can pry open the link between ideas and social structure). The presumption in this article is that the content of ideas reflects the social structure in which they emerge. If you vary the groups to which a person is attached, you vary the content of the person’s ideas. I do not believe that this is entirely true, but my hypothesis is that there is some truth to it. The other extreme would be to ignore social structure to focus entirely on the organization of bits and bytes within an idea. Czernich and Heath (2001) provide an illustration. They describe the dot-com evolution of the idea that Web site value increases with its number of viewers. They describe analogies to other ideas and recombinations of elements within the idea. Sociologists will recognize the sociolinguistics of ethnomethodology and the indexical nature of expressions in the analysis (e.g., Denzin 1969; Hudson 1980), but the familiar microlevel insights are used by Czernich and Heath to describe macrolevel change in market rhetoric. The subject could be analyzed from the perspective of this article. The brokerage hypothesis says that analogies and recombinations in the evo-lution of “eyeballs to Web sites” should have come from people with attachments to the separate groups focused on the elements across which analogies and combinations
American Journal of Sociology
356
Given these four levels of information arbitrage, one could draw the conclusion from industry and organization stories that brokers are critical to learning and creativity. People whose networks span structural holes have early access to diverse, often contradictory, information and inter-pretations, which gives them a competitive advantage in seeing good ideas. To be sure, ideas come over a variety of paths from a variety of sources (e.g., Von Hippel 1988; Geroski and Mazzucato 2002; Menon and Pfeffer 2003), but idea generation at some point involves someone moving knowledge from this group to that, or combining bits of knowledge across groups. Where brokerage is social capital, there should be evidence of brokerage being associated with good ideas, and vice versa.
EVIDENCE ANECDOTAL AND AGGREGATE
Anecdotal evidence for the outlined hypothesis can be found in the re-marks of prominent creatives, such as the quotes from Mills and Fourtou with which I introduced this article. Archives on historical figures link brokerage and ideas in wider perspective. For example, Caro (1982, chap. 15) describes Lyndon Johnson’s creation of a Washington power base in 1933 from the “Little Congress,” through which he brokered connections between journalists and prominent people in government. Dalzell (1987, p. 1) describes Francis Lowell’s role as broker in creating the American cotton industry. DiMaggio (1992, esp. pp. 129–30) describes Paul Sachs’s role as broker in establishing the Museum of Modern Art in New York: “Sachs could employ his talents precisely because his strong ties to sectors that had previously been only weakly connected—museums, universities, and finance—placed him at the center of structural holes that were critical to the art world of his time.” Padgett and Ansell (1993) describe Cosimo de Medici’s use of contacts with opposing family factions to establish his Medicean political party in Renaissance Florence. McGuire and Grano-vetter (in press) describe Samuel Insull’s use of his network of contacts in finance, politics, and technology to shape the electric utility industry at the turn of the century (cf. Sediatis [1998, esp. pp. 373–74] on the greater flexibility, adaptability, and volume of business in Russian com-were made. For example, Collins (1987, p. 67) refers to an imaginary social life of intellectuals (cf. White [1993] on the dialogue between artist and art world and Collins [1998, chap. 1] for elaboration): “The intellectual alone, reading or writing . . . is not mentally alone. His or her ideas are loaded with social significance, because they symbolize membership in existing and prospective coalitions in the intellectual network. New ideas are created as combinations of old ones; and the intellectual’s creative intuitions are feelings of what groups these ideas are appealing to [and against which intellectual enemies]. The market structure of the intellectual world is transposed into the creative individual’s mind”).
modity markets created by organizers who had little previous contact with one another and Granovetter [2002] on polycentric networks facil-itating economic cooperation). In his panoramic analysis of the history of philosophy, Collins presents sociograms of intergenerational social net-works among philosophers to illustrate his argument that the philosophers of greatest repute tended to be rivals representing conflicting schools of thought for their generation: “The famous names, and the semi-famous ones as well who hold the stage less long, are those persons situated at just those points where the networks heat up the emotional energy to the highest pitch. Creativity is the friction of the attention space at the mo-ments when the structural blocks are grinding against one another the hardest” (Collins 1998, p. 76).
There is related evidence of this at the aggregate level of organizations. In particular, it has been popular to study the ways in which technological change affects social structure at the same time that social structure affects technological advance (e.g., Barley [1990, pp. 92–95] provides crisp illus-tration with network data). Electronics and biotechnology have been fa-vored research sites, with the works of Walter Powell (e.g., Powell and Brantley 1992; Powell, Koput, and Smith-Doerr 1996; Powell et al. 1999; Koput and Powell 2003) and Toby Stuart (Stuart 1998; Stuart, Hoang, and Hybels 1999; Stuart and Podolny 1999; Sorenson and Stuart 2001) serving as prominent ports of entry into the research. More generally, Kogut (2000) builds on a series of papers (e.g., Kogut and Zander 1992, 1996; Walker, Kogut, and Shan 1997; Kogut and Walker 2001) to propose a network theory of the firm in which value is derived from a firm’s ability to create and lay claim to knowledge derived from its own mem-bership and participation in networks (cf. Nahapiet and Ghoshal [1998] on social capital and knowledge and Powell and Smith-Doerr [1994] on information issues in the economic sociology of networks, especially with respect to interorganization networks). Structural holes are a correlate of organizational learning, often discussed in terms of ability to learn—what Cohen and Levinthal (1990, p. 128) describe as an organization’s ab-sorptive capacity, that is, “the ability of a firm to recognize the value of new, external information, assimilate it, and apply it to commercial ends,” which can be studied in terms of industry factors, internal networks, and external networks that enhance absorptive capacity (see Argote 1999; Kogut 2000; Knoke 2001; Argote, McEvily, and Reagans 2003).
Organizations with management and collaboration networks that bridge structural holes in their markets seem to learn faster and be more productively creative. Sutton and Hargadon (1996) describe processes by which a firm, IDEO, used brainstorming to create product designs. They then clarify in Hargadon and Sutton (1997) the brokerage function served (see Hargadon [2002] for broader discussion). The firm has clients in
American Journal of Sociology
358
diverse industries. In the brainstorming sessions, technological solutions from one industry are used to solve client issues in other industries where the solutions are rare or unknown. The firm profited, in other words, from bridge relations through which employees brokered technology flow between industries (cf. Allen and Cohen [1969] on gatekeepers, Lazega and Pattison [2001] on network management of status auctions, Argote [1999] and Argote et al. [2003] on organizations moving down a learning curve). Fleming (2002) describes such a process within Hewlett-Packard where company policy was to move engineers between projects rather than having each project hire and fire individually. The result was that Hewlett-Packard technologies were constantly mixed in new combina-tions. As an engineer described the experience: “I had to work in a single field for only two or three years and then like magic it was a whole new field; a paradise for creativity” (Fleming 2002, p. 1073).
Similar results are available across organizations. Provan and Milward (1995) show higher performance from mental-health systems with a hi-erarchical rather than a dense network structure. Geletkanycz and Ham-brick (1997) report higher company performance when top managers have boundary-spanning relationships beyond their firm and beyond their in-dustry. McEvily and Zaheer (1999) report greater access to competitive ideas for small manufacturers with more nonredundant sources of advice beyond the firm (and McEvily and Marcus [2002] show lower absorptive capacity when the sales network is concentrated in a single customer). Stuart and Podolny (1999) report a higher probability of innovation from semiconductor firms that establish alliances with firms outside their own technological area. Comparing biotechnology districts in Minneapolis and Philadelphia, Llobrera, Meyer, and Nammacher (2000) attribute the growth and adaptation of Philadelphia’s district to its many nonredundant networks around organizations in the district. Baum, Calabrese, and Sil-verman (2000) study Canadian companies in biotechnology for growth in revenues, number of patents granted, and the extent to which a company had multiple kinds of alliance partners at start-up. Companies with a heterogeneous mix of alliance partners enjoyed faster revenue growth and a dramatic advantage in obtaining patents. Koput and Powell (2003) report higher earnings and survival chances of biotechnology firms with more kinds of activities in alliances with more kinds of partner firms. Podolny (2001) describes venture-capital firms spanning structural holes by linking coinvestors that were not otherwise investing together. Firms with a “deal-flow” network that often spans structural holes invest more often in early product development—where the information benefits of spanning structural holes could be a competitive advantage in detecting potentially valuable ideas—and are more successful in developing their early-stage investments into profitable IPOs (cf. Beckman and Haunschild
[2002] on firms with more heterogeneous boards of directors paying lower premiums for acquisitions, Ruef [2002] on the tendency for entrepreneurs “attempting to combine disparate ideas or routines” to discuss their ven-ture with varied kinds of contacts, Shane and Cable [2002] on early-stage investors using social networks to decide between ventures, and Pollock, Porac, and Wade [2003] for a review of the brokerage role in creating deal networks).
SUPPLY CHAIN IN A LARGE ELECTRONICS COMPANY
The cited work offers anecdotal and aggregate evidence consistent with the hypothesis that brokerage increases the risk of having a good idea. To study the hypothesis at the level of individual people proposing ideas, I draw on data describing 673 managers who ran the supply chain in 2001 for one of America’s largest electronics companies. Here, as in most walks of life, people vary in the quality of their ideas. The study population was going through a leadership change triggered by exogenous events. The incoming leadership thought that a Web-based network analysis would be a quick way to become familiar with the current informal organization of leaders in the supply chain. They believed that knowing the current organization would be useful for thinking about and com-municating future strategy.
Background Data
Data on manager backgrounds were taken from company personnel rec-ords. This provided the organization division and the geographic site where a manager worked, as well as the manager’s job rank. An executive rank was composed of people with job titles of director or vice president. Below them were senior managers, followed by managers 3, 2, and 1. Further, managers at all ranks were assigned to one of two roles in the supply chain: some purchased goods from external vendors, while others moved goods inside the company. I include the role distinction because purchasing pays a higher salary ($22,111 higher on average, 5.4 t-test) and could affect a manager’s ideas about the supply chain since it involves contacts in other companies.
I recorded manager education because it is so integral to the concept of human capital, especially for a study of ideas. A substantial number of the managers had gone to graduate school (25% held master’s degrees, and 3% held doctorates). A similar number had less than a college degree (17% had some college, short of a bachelor’s degree, and 10% had a high school education or less). I also looked at race (86% of the study population
American Journal of Sociology
360
was white), gender (26% female), and marital status (78% married), but none was a statistically significant predictor or slope-adjustment in the analysis, so they are not reported.
Judging from age and seniority, there was a great deal of work expe-rience in the study population. The average manager was 50 years old, had worked 18 years in the company, and had known his or her cited discussion partners for 8 years. Many managers had spent their whole career in the company. A large number had spent their whole career in the industry. Age turned out to be more strongly correlated with perfor-mance and idea value, so I use age as the control for work experience.
Network Data
Network data were collected by the standard survey method of name generators and interpreters (e.g., Marsden 1990, 2004). The Web-based questionnaire contained two name generators. After managers were asked for an idea to improve the supply chain (below), they were asked if they had discussed the idea with anyone. If yes, they were asked to provide the name of the person with whom they had discussed the idea. Next they were asked, “More generally, who are the people with whom you most often discuss supply-chain issues?” The questionnaire then listed two name interpreters. The first asked for years of acquaintance with each cited person. The second asked about connections among the cited con-tacts. To answer, the respondent was guided through a matrix in which the respondent’s perceived connection between each pair of cited people was coded as “often,” “sometimes,” or “rarely” in regards to how often they discussed supply-chain issues with one another. Of the 673 managers, 455 completed the network questions (68%). Another 149 supply-chain managers of varying ranks were cited by respondents and so were included in the network data because respondents described relations among con-tacts. There are 193 social isolates in the study population (29%). These isolates must have had a circle of local contacts, but they were not cited as a discussion partner by any other supply-chain manager.4
4Respondents are, by and large, representative of the study population. I have
back-ground and performance data on all 673 managers so I can compare the 218 nonre-spondents to the 455 who responded. In a logit model predicting response from 16 background and performance variables in table 1, plus gender and race, there are no significant differences between respondents and nonrespondents except one—managers recently promoted were more likely to respond (2.8z-score test statistic for the de-pendent variable in model 4 in table 1). With 18 predictors, this one statistically significant difference is acceptable. The zero-order difference is that 58% of promoted people responded vs. 46% respondent rate among people not promoted in the year of the survey.
The survey provides 5,010 observations of 4,139 relationships distin-guishing five levels of connection between two people: (1) one person cited the other as someone with whom their idea was discussed and with whom supply-chain issues were frequently discussed, or colleague(s) reported that the two people often discussed supply-chain issues (1,363 relations, strength 1.00); (2) one cited the other as someone with whom he or she frequently discussed supply-chain issues, but not as someone with whom their idea was discussed (1,188 relations, strength .86); (3) colleagues said that the two people sometimes discussed supply-chain issues, but neither cited the other (675 relations, strength .65); (4) one cited the other only as someone with whom their idea was discussed (333 relations, strength .50); or (5) neither person cited the other, and colleagues said the two people rarely discussed supply-chain issues (580 relations, strength .00).5 The survey provides 1,072 discussion partners, 480 of whom were sup-5Quantitative scores for relationships are based on loglinear analysis of the survey
network data. Here are loglinear test statistics for relations between cited contacts:
Rare Sometimes Often No citation 8.5 3.3 ⫺11.6 Yes-No ⫺1.6 ⫺2.9 .6 No-Yes ⫺2.5 2.4 5.8 Yes-Yes ⫺5.2 1.9 11.7
The three columns distinguish relations by the perceived strength of connection be-tween a pair of cited contacts (“rarely,” “sometimes,” or “often” discussing supply-chain issues). The four rows distinguish relations by citations. The possibilities are that two people did not cite one another, they cited one or the otheronly on the first-name generator (discussed best idea), they cited one or the otheronlyon the second-name generator (frequently discuss supply-chain issues), or they cited one or the other on bothname generators. The first row of the table shows that uncited relations were likely to be perceived as “rare” discussion (8.5z-score) and extremely unlikely to be perceived as “often” (⫺11.6 z-score). The bottom two rows of the table show that people cited as frequent discussion partners were perceived as “often” discussing sup-ply-chain issues with the respondent (5.8 and 11.7z-scores). A one-dimensional loglinear association model yields the following raw scores for the rows and columns:⫺.74,
⫺.06, .45, and .65 for the rows,⫺.76, .15, and .64 for the columns. Normalizing raw scores to vary from zero (minimum connection) to one (maximum connection) yields the scores reported in the text. Where multiple observations of a relationship are contradictory, I use the strongest reported value. For example, if one manager cited another as a frequent discussion partner, and there is a second observation in which a mutual colleague reported that the two managers “sometimes” discuss supply-chain issues, connection between the two managers is set to .86 because of the stronger connection implied by the direct citation. Consistency is more typical than contradic-tion: stronger relations were more likely to be cited by both managers involved, more likely to be reported by multiple respondents, and more likely to be reported between people perceived to often discuss supply-chain issues. At the other extreme, managers perceived to “rarely” discuss supply-chain issues almost never cited one another.
American Journal of Sociology
362
ply-chain managers, depicted in figure 2. The sociogram displays man-agers with lines indicating discussion citations. Manman-agers are close in the sociogram to the extent that they cited one another and had the same other people as discussion partners.
Not displayed in figure 2 are less-connected people who would be dis-tributed around the periphery of the sociogram. Among the less-connected are the 592 other cited discussion partners who were subordinates and contacts beyond the supply chain, most of whom were named by a single respondent (561 named by one respondent, 31 named by two). The less-connected include the 193 supply-chain managers who were isolates in the discussion network. The first column of the table in figure 2 shows how isolation varied by job rank. No vice president or director was a social isolate. Two senior managers were isolates. The largest concentra-tion was among first-rank managers, where it is easy to imagine a local circle of people cut off from colleagues elsewhere.
I use network constraint to measure brokerage. Network constraint is a summary measure that varies with three qualities of the discussion network around a manager: size, density, and hierarchy.6The constraint on a manager is high if the manager’s discussion partners talked a lot to one another directly (dense network) or if they shared information indi-rectly via a central contact (hierarchical network). More constrained net-works spanned fewer structural holes, so performance and the value of a manager’s ideas should have a negative association with network con-straint. I measure the constraint on each manager with respect to the immediate network of discussion partners, composed of anyone the man-ager cited as a discussion partner and anyone who cited the manman-ager.7
6The network constraint index begins with the extent to which manageri’s network
is directly or indirectly invested in the manager’s relationship with contactj(Burt
1992, chap. 2; 2000):c 2, for , where is the proportion ofi’s
p(p ⫹
冘
p p ) q(i,j pij ij q iq qj ij
network time and energy invested in contactj,p pz/
冘
z , and variablez measuresij ij q iq ij
the zero to one strength of connection between contactsiandj(see note 5). The total in parentheses is the proportion ofi’s relations that are directly or indirectly invested in connection with contactj. The sum of squared proportions,
冘
icij, is the network constraint indexC. I divided by the maximum score possible to bound scores in small, dense networks and multiply scores by 100 to discuss integer levels of constraint.7I considered two alternative network boundary definitions. One was to preserve
asymmetry: managerjwould be ini’s network only ificitesj. It seemed unwise to read the data this closely given the number of people who did not respond to the survey, the uneven availability of data between the center and periphery of the network (discussed in the text), and the small, egocentric networks that would result (reported in fig. 2, average network size would drop from 5.0 to 2.9 and average network constraint would increase from 60.5 points to 81.0). Nevertheless, to check this alter-native, I estimated the performance and idea regression models with network constraint computed from asymmetric citations. The results are weaker on average than those reported in the text (e.g., the⫺5.0t-test reported in table 4 for association between
Figure 1 contains three illustrative computations.8
The second column of the table in figure 2 shows that managers had a handful of discussion contacts on average. The average varied with rank: directors and vice presidents had an average of 12.6 contacts, versus an average of 3.4 for managers in the first rank. The average was a handful of discussion partners.
Network constraint is higher around managers in the lower ranks, increasing from a mean of 29.8 points for directors and vice presidents up to an average of 73.6 points for managers in the first rank. The social isolates were assumed to have their own local discussion partners, so they were given the constraint score, 100 points, of someone who had one
idea value and the log of network constraint is⫺2.7). A second alternative would be to expand the networks to includejini’s network if any other colleague perceivei andjas close. This seems reasonable since quantitative scores for the survey responses put a relation reported as “often” at about the same strength as a direct citation between two managers (see note 5). However, perceived relations require a mutual colleague to report them, so perceived relations only occur between contacts already cited (av-erage network size would increase only slightly if “often” ties were used to define contacts, to 6.1 contacts from the 5.0 average in fig. 2) and further connect people within clusters (so network constraint would increase slightly, to 66.2 points from the 60.5 average in fig. 2). Again, as a check I estimated the performance and idea regression models with network constraint computed from the broader definition of connections. The results are about the same as those reported in the text (e.g., the⫺5.0 t-test reported in table 4 for association between idea value and the log of network constraint is⫺4.1).
8Two points are illustrated. One is the constraint computation discussed in the text:
person 2 illustrates the constraint of having few contacts, person 3 illustrates the constraint of densely connected contacts, and Robert illustrates the low constraint of having many contacts in separate groups. The second point is the upward bias in constraint created by my definition of network boundaries. Building on previous re-search, I compute constraint for the network immediately surrounding a manager (see note 7). Alternatively, I could have taken into account the broader structure around a manager. Person 3 in fig. 1 illustrates the difference. Person 3 has four contacts: Robert, James, and two others. Equal proportions of person 3’s network time and energy are allocated to each contact (p p1/4). The indirect proportion for person 3’s
ij
tie with Robert is zero because Robert has no direct contact with the other people. The indirect proportion for person 3’s tie with the other three contacts is high because all three are connected (
冘
p p p.165). However, the three contacts have relationsiq qj q
not considered. James, for example, has four contacts beyond person 3’s network. Ignoring them makes person 3’s network look more constrained than it is. James could bring new information into person 3’s network, even though he is strongly connected within the network. If contacts beyond person 3’s network were taken into account, the indirect proportions would be lower, so the network constraint on person 3 would
drop to 40.2 from the 70.8 reported in fig. 1 (.402 2 2
p[.25⫹0] ⫹[.25⫹.084] ⫹ ). In short, the absolute level of constraint reported here for
2 2
[.25⫹.091] ⫹[.25⫹.084]
each manager’s network is higher than it would be if constraint were computed from the entire network across managers. I do not see this as a problem because I want to be consistent with previous research and my conclusions are drawn from relative levels of constraint associated with relative levels of performance and idea value.
discussion partner or a completely interconnected circle of discussion part-ners (a control for the social isolates is tested in the analysis).
BROKERAGE OPPORTUNITIES
The study population was three ways rich in opportunities for brokerage. First, these managers were a functional silo relatively isolated from the rest of the company. Social leaders in the supply chain are indicated in figure 2 by dense intersections of relations with other managers. In con-trast, managers toward the periphery of the sociogram often have a single relationship back into the network (e.g., managers 409, 208, 499, 329, 444 at the top of fig. 2). That single tendril far from the center of the system is the pattern of a peripheral person; they are connected into the network, but only barely. That pattern characterizes connections beyond the supply chain. Many people were named (592 outside vs. 480 inside the supply chain), but almost all were named by a single respondent (95%). The few named by multiple respondents were cited twice. None were named by more than two respondents. In other words, no business leaders outside the supply chain were a focus of chain discussion. The supply-chain managers primarily turned to one another—which was an oppor-tunity for enterprising managers to build bridging ties out to the business units to better integrate supply-chain processes into production.
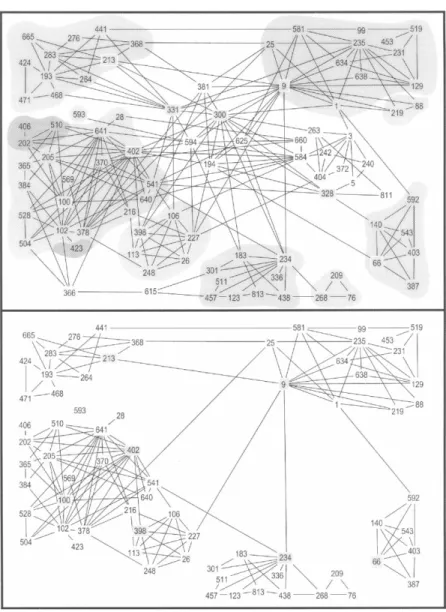
Second, there were structural holes between business units in the or-ganization. The center of the sociogram in figure 2 is corporate head-quarters. Clusters of managers within business units radiate from the center like five spokes on a wheel. The clusters appear in the sociogram to the southeast, south, southwest, northwest, and northeast. To make the clusters more apparent, I looked more closely at the top 89 senior people to see the core of the supply-chain network, drawn in figure 3. Managers are close together in figure 3 to the extent that they cited one another and had the same other people as discussion partners. Shaded areas indicate business units. Managers not in a shaded area work at corporate head-quarters. The many lines in the shaded areas show discussion concentrated within business units. There are 514 connections in the sociogram at the top of figure 3: 321 between managers in the same business unit (62%), 178 with managers at headquarters (35%), and a meager 15 direct con-nections between managers in different business units (3%). To highlight the concentration, I removed the headquarters’ managers. Connections to headquarters are bridges of a kind, but they are also a continuation of the bureaucratic structure up from each division. In contrast, direct discussion between managers in separate divisions cuts across lines of corporate control. The sociogram at the bottom of figure 3—exactly the
American Journal of Sociology
366
Fig.3.—Core network in the supply chain
sociogram at the top, but with headquarters removed—provides a stark illustration of the fragile contact across business units. Again, the orga-nization is rich with opportunities for an enterprising manager to discover and bring home best practice in other divisions and, by so doing, to enhance coordination across the supply chain.
Managers on average were surrounded by a small clique of colleagues with whom they discussed their work. The second to the last column in figure 2 is the mean network constraint among a manager’s cited dis-cussion partners. The average across ranks is a near-maximum 81.0, and the 70.2 average for the highest-rank managers is not much lower. To put this in more concrete terms, discussion partners were reported 52% of the time to “often” discuss supply-chain issues with one another, and 80% were reported to at least “sometimes” discuss supply-chain issues with one another. As a frame of reference for these averages, Marsden (1987) reports an average network density of 62% for a national probability sample of Americans citing about the same number of discussion partners. However, half of the cited contacts were family, so Marsden’s density average would have been lower if contacts were limited to work. Burt (2000) reports a 27.9 average level of colleague network constraint for about a thousand senior managers drawn from five study populations, an average much lower than those in figure 2, even with controls for network size.9
Despite dense clustering within business units and around individual managers, the managers in figure 2 are connected by short path distances. Path distance is the minimum number of relations required to connect two people. Path distance to direct contacts is one. Path distance to friends of direct contacts is two, and so on. In tracing a path of indirect con-nections from one side to the other in figure 2, intermediaries add up quickly. A computer search shows that the longest path distance is 11 steps. The average is just 4.2 steps.
The average path distance varies with job rank. The last column of figure 2 shows more senior people with shorter path distances across the supply chain (3.3 mean for directors and vice presidents vs. 4.6 mean for
9The thousand senior managers were able to name a larger number of contacts than
allowed in the supply-chain survey, so accurate comparison requires a control for network size. The constraint-size equation in the baseline data isC bN, whereN
pa(e )
is the number of contacts in a manager’s network,Cis the projected level of network constraint for networks of sizeN, the estimated coefficientsaandbare 48.7 and⫺.075, respectively. Estimating the equation for the supply-chain discussion network yields for network constraint among cited discussion partners (second to last ⫺.10N
68.4(e )
column in fig. 2) and60.8(e⫺.12N)for constraint when the network is expanded to include people citing the manager (third column in fig. 2). The intercepts show high levels of network constraint in the supply chain. The standard error for the intercept is one point in both study-population equations, so test statistics are large for the 20-point difference between the baseline 48.7 level of constraint for five-contact networks vs. the mean 68.4 constraint among discussion partners in the supply chain, or the mean 60.8 constraint in the broader networks including people who cited a manager.
American Journal of Sociology
368
manager 1).10For example, senior managers on average required 3.7 steps to reach anyone in figure 2—that is, one direct connection to a colleague, plus two intermediaries past the colleague, to reach anyone. The best-connected actors could reach everyone in 2.9 steps on average. The worst-connected actors required an average of 6.4 steps (putting aside the two senior managers who were social isolates). Shorter paths to more senior people is to be expected since more senior people had more bridging relations, indicated by their lower levels of network constraint, so they could more often reach directly out of their own social cluster into others (mean path distance is correlated .57 with network constraint in fig. 2 and .55 for the 89 people in fig. 3).
The connection with job rank means that senior people were more responsible for connections across the supply chain. A histogram of figure 2 path distances peaks over the average of four steps. The distribution looks the same for the core network of 89 people at the top of figure 3, except the distribution shifts one step shorter (average path distance is 4.2 steps in fig. 2 vs. 3.2 steps at the top of fig. 3). In other words, connections across the supply chain are primarily determined by path distances among the 89 people at the top of figure 3. The excluded less-connected managers in figure 2 require one connection to access the core network in figure 3, which then connects them across the supply chain. Within the core network, removing the headquarters managers increases average path distance by two steps (3.2 mean path distance at the top of fig. 3 is 5.2 at the bottom of fig. 3). Without the headquarters managers, communication across the business units would depend on getting to the few people who occupy the 15 positions at the bottom of figure 3 that bridge business units.
In short, formal chains of command were integral to communication across the supply chain. This is illustrated by the critical role that head-quarters played in shortening path distances across business units and by the tendency for managers to turn to a small clique of interconnected colleagues to discuss supply-chain issues. With respect to brokerage op-portunities, a setting dependent on formal chains of command for com-munication is a setting rich in opportunities for managers to coordinate directly across the formal chains.
10Average path distances are computed across 476 managers instead of all 480 in fig.
2 because I excluded the four people in the two disconnected dyads in the lower-right corner of fig. 2. Path distance is infinite to colleagues outside their isolated dyads.
BROKERAGE INCENTIVES
The many opportunities for brokerage raise a question about incentives. If managers have incentives to coordinate across structural holes in and around the supply chain, why do so many holes still exist?
It is easy to imagine the lack of incentive. For example, the network structure just described would result from managers being encouraged to focus on their immediate assignments and to rely on headquarters for strategic thinking about how to coordinate across the supply chain. In fact, such a view was crisply stated to me by a program manager de-scribing how he ran his group: “I don’t want my people even thinking about alternatives. They spend two weeks thinking about an alternative, only to learn that what we have is 90% as good. The result is that they wasted two weeks and I’m behind schedule. I get some complaints about stifling creativity, but all I want is to be good enough and on schedule.” If one combines this view with a premium on personal loyalty from sub-ordinates and considers the relative ease with which complex knowledge moves over strong connections between people in a dense network (Rea-gans and McEvily 2003), one can quickly imagine an organization of managers rewarded for sticking to an interconnected circle of colleagues focused on their immediate tasks.
Despite views such as the one quoted above, the company, in practice, actually recognized and rewarded brokerage. Managers who often dis-cussed supply-chain issues with managers in other groups were better paid, received more positive job evaluations, and were more likely to be promoted.
Salary
Salary measures an employee’s accumulated performance in that next year’s salary is typically an incremental addition to current salary. Per-formance was reviewed annually by each manager’s supervisor. Salary and evaluation data for this analysis come from company personnel rec-ords for the annual cycle six months before the network survey, and the subsequent cycle six months after the survey. Salaries increased slightly in the second year (5.5% on average, 0% minimum, 30% maximum), but relative salary did not change much between the years (.99 correlation between salaries in the two years, .96 partial correlation with job rank and age held constant). I use salary current at the time of the network survey (rather than aggregating across the years) because salary is so highly correlated between the years and I have complete data on salary at the time of the survey (there was 5.2% turnover in managers between
American Journal of Sociology
370
the two years, and I have no second-year salary data for managers who left the firm).
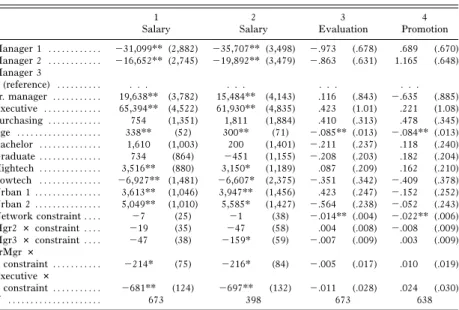
Models 1 and 2 in table 1 describe the association between salary and brokerage. Job rank is an obvious control: the average salary of a first-rank manager was $31,099 less than the average salary of a manager in the third rank. Senior managers, on average, had salaries $19,638 higher than a third-rank manager. Intercepts are not presented for models 1 and 2 to preserve confidentiality. Effects are expressed with respect to man-agers in the third rank as a reference group. Beyond job rank, manman-agers played two assigned roles in the supply chain: some purchased goods from external vendors, while others moved goods within the company. Those who dealt with external vendors (purchasing) had higher salaries, but the difference is statistically negligible when job rank and age are held con-stant. Education was not directly associated with salary, but managers were compensated for experience. Salary increased with age ($338 per year on average). People tend to spend their whole career within this industry, so years in the company were less correlated with salary than years of age (6.5t-test for age in table 1 vs. 2.1 for years in the company). To hold constant differences between business units, I regressed the residuals from job rank, job role, age, and education across dummy var-iables distinguishing 15 business units. Salaries were significantly low in the one unit for which supplies were largely commodity goods so supply-chain managers were not required to have technical expertise (“LowTech” in table 1). Salaries were significantly high in four units where supply-chain managers had to deal with higher-end electronic equipment and components (“HighTech” in table 1).
I then took studentized residuals from the regression model including the two organization controls (LowTech and HighTech) and distributed the residuals across a map of the United States to find pockets of deviant salaries. Residuals were significantly high in two high-cost urban areas, defined by control variables “Urban 1” and “Urban 2” in table 1.
The above control variables measuring job rank, role, age, education, business unit, and location account for 78.6% of salary variance across the 673 managers. The amount by which a manager’s salary exceeds, or falls below, the salary expected from his or her rank, role, age, education, business unit, and location measures the company view of the manager’s performance relative to peers.
That view is correlated with brokerage, as described by the results in the bottom five rows of table 1. The “network constraint” row is the association with brokerage for first-rank managers, then the next four rows are slope adjustments for stronger or weaker associations at each of the other ranks. The five rows at the bottom of table 1 for models 1 and 2 show no association with network constraint for managers in the
TABLE 1 Predicting Performance 1 Salary 2 Salary 3 Evaluation 4 Promotion Manager 1 . . . ⫺31,099** (2,882) ⫺35,707** (3,498) ⫺.973 (.678) .689 (.670) Manager 2 . . . ⫺16,652** (2,745) ⫺19,892** (3,479) ⫺.863 (.631) 1.165 (.648) Manager 3 (reference) . . . . Sr. manager . . . 19,638** (3,782) 15,484** (4,143) .116 (.843) ⫺.635 (.885) Executive . . . 65,394** (4,522) 61,930** (4,835) .423 (1.01) .221 (1.08) Purchasing . . . 754 (1,351) 1,811 (1,884) .410 (.313) .478 (.345) Age . . . 338** (52) 300** (71) ⫺.085** (.013) ⫺.084** (.013) Bachelor . . . 1,610 (1,003) 200 (1,401) ⫺.211 (.237) .118 (.240) Graduate . . . 734 (864) ⫺451 (1,155) ⫺.208 (.203) .182 (.204) Hightech . . . 3,516** (880) 3,150* (1,189) .087 (.209) .162 (.210) Lowtech . . . ⫺6,927** (1,481) ⫺6,607* (2,375) ⫺.351 (.342) ⫺.409 (.378) Urban 1 . . . 3,613** (1,046) 3,947** (1,456) .423 (.247) ⫺.152 (.252) Urban 2 . . . 5,049** (1,010) 5,585* (1,427) ⫺.564 (.238) ⫺.052 (.243) Network constraint . . . . ⫺7 (25) ⫺1 (38) ⫺.014** (.004) ⫺.022** (.006) Mgr2#constraint . . . . ⫺19 (35) ⫺47 (58) .004 (.008) ⫺.008 (.009) Mgr3#constraint . . . . ⫺47 (38) ⫺159* (59) ⫺.007 (.009) .003 (.009) SrMgr# constraint . . . ⫺214* (75) ⫺216* (84) ⫺.005 (.017) .010 (.019) Executive# constraint . . . ⫺681** (124) ⫺697** (132) ⫺.011 (.028) .024 (.030) N . . . 673 398 673 638
Note.—Coefficients in models 1 and 2 are change in salary dollars with a unit increase in row variable (respectively .80 and .83 squared multiple correlations; network effect plotted in fig. 4). Coefficients in model 3 predict three levels of evaluation for an ordinal logit model (114.8x2with 17df; network effects are plotted in fig. 4 holding age constant). Coefficients in model 4 are for a logit model predicting whether the employee was promoted in the year after the network survey or received an above average raise (100.5x2with 17df; network effect is plotted in fig. 4 holding age constant). SEs are given in parentheses.
* P!.05. ** P!.001.
first rank, nor for managers in the second rank. However, the slope in-creases with job rank, showing a stronger salary association with bro-kerage in the higher ranks as a manager becomes more the author of his or her own job and as success depends more on reading the organization to identify valuable projects and know who can be brought together to implement the projects (cf. Burt 1997).11Salary in model 1 decreases for first-rank managers by $7 with a one-point increase in network constraint. The decrease is larger for managers in the second rank (add $19 to the 11Model 2 is the same as model 1 except it is estimated from the data on managers
who had two or more discussion partners. The results of model 1 highlight the third rank of managers as a transition point after which managers enjoyed the salary benefits of brokerage. I looked through the third-rank managers to see where salary benefits were accumulating. Initially, I thought seniority would be a key. Managers who had been in the third rank for a while could have been playing a senior manager role and so perhaps compensated for that. The answer was more simple. Third-rank managers involved in the informal discussion network showed the salary benefits of brokerage. Model 2 shows the same pattern of salary correlates as model 1, except the salary of third-rank managers is significantly correlated with network constraint.
American Journal of Sociology
372
$7) and larger still for managers in the third rank (add $47 to the $7). The statistically significant association is at the senior–manager and ex-ecutive ranks. The $214 additional decrement for senior managers is sig-nificantly more negative than the $7 for first-rank managers (2.9t-test). The $681 additional decrement for directors and vice presidents is even more negative (5.5t-test). Adding a dummy variable distinguishing the 193 social isolates does not add to the prediction (.4 test statistic).12
The graph to the left in figure 4 plots salary relative to peers against network constraint for the managers identified in table 1 as eligible for the salary benefits of brokerage. The salary variable is the residual from predicting salary by the 12 control variables in table 1 standardized to unit variance and zero mean (salary expected for a manager from his or her job rank, role, age, education, business unit, and geographic location). Salary relative to peers clearly decreases as network constraint increases (⫺.41 correlation, ⫺5.6 test statistic,P!.001).
Job Evaluations
Job evaluations measure current performance in that the evaluations are more free than salary to increase or decrease from one year to the next. In the annual cycle preceding the network survey, 17% of the managers were judged “poor,” 55% were judged “good,” and 28% were judged 12There could be a reputation consideration here. A “well-networked” manager would
acquire a positive reputation over time, which would create an expectation among senior people that the manager should be well paid relative to peers. Reputation in the sense of social standing among peers is usually measured by network centrality (e.g., Podolny 1993, 2001). Three such measures are highly correlated in this study population (.70,⫺.56, and⫺.95 in the correlation matrix among number of times cited as a discussion partner, sum of relations weighted by the prominence of the colleague reached by the relationship, and mean path distance to other supply-chain managers). All three centrality measures are closely correlated with the network constraint index I use to measure brokerage (⫺.77,⫺.61, and .55, respectively), showing that managers more central in the informal organization had more opportunities for brokerage. The correlations do not disappear if I hold job rank constant, from which I infer that the connection between centrality and brokerage is not due simply to people seeking out more senior managers. None of the three centrality measures adds significantly to the salary prediction in table 1 (respectivet-tests of 1.84, .63, and .24 for the centrality measures). Job rank is the key control. If I take job rank out of the prediction, then network centrality is strongly associated with salary (respectivet-tests of 9.36, 6.24, and ⫺5.76 for the centrality measures). My conclusion is that being central in the informal organization is associated with brokerage independent of job rank, but the centrality effect on salary is through job rank. There is something to the reputation story, but not enough to change the salary results in table 1. Disentangling centrality from brokerage would require network and salary data over time to see how the two network variables are associated with promotion. A teaser here is that none of the three centrality measures adds significantly to model 4 predicting promotion in table 1 (respective logitz-scores of .92,⫺.01, and⫺.33).
American Journal of Sociology
374
“outstanding.” With pressure from top management to identify more weak performers, the proportion of managers assigned to the “poor” category increased to 25% in the second year, with 53% judged “good” and the remaining 22% judged “outstanding.” A manager’s evaluation in the first year is a good predictor of his or her evaluation in the second year; however, there were improvements and reversals. Of the managers judged “poor” in the first year, most were judged “poor” in the second year, though many rose to “good” (81% and 19%, respectively; none rose to “outstand-ing”). Of those judged “outstanding” in the first year, the majority con-tinued to be “outstanding” in the second year, but a large number dropped to “good” and a minority dropped to “poor” (63%, 31%, and 6%, respec-tively). I focused on consistently high or low evaluations to define a sum-mary measure of performance, assigning managers into three categories: continuously poor (13% of the managers were judged “poor” in both years), continuously outstanding (16% were judged “outstanding” in both years), versus everyone else in the middle (71%, of whom 97% were given the middling code of “good” for one or both of the years). The summary measure is strongly correlated with evaluations in each year (correlations of .84 and .83 for the first and second years, respectively), but it more clearly distinguishes extremes of poor versus outstanding performance. Managers who left the firm before the second annual review cycle were assigned to a category based on their evaluation in the previous year. It is not surprising that exit was most likely for managers who received a “poor” evaluation (13% exit for those judged “poor” vs. 4% exit for every-one else).
Model 3 in table 1 is an ordinal logit equation predicting the three-category job evaluations (outstanding, good, poor). Performance evalu-ations did not vary systematically with any of the control variables except age: older managers were less likely to receive positive evaluations. Above and beyond the control variables, there is a statistically significant neg-ative association with network constraint—the more interconnected a manager’s discussion contacts, the less positive his or her annual perfor-mance evaluation (⫺.014 coefficient, .004 SE in parentheses, for a⫺3.5 test statistic). All of the slope adjustments in the four bottom rows are smaller than their standard errors. In other words, there is a strong neg-ative association between network constraint and performance evaluation at each job rank. Adding a dummy variable distinguishing the 193 social isolates does not add anything to the prediction (⫺1.6 test statistic), nor does it change the fact that age and network constraint are the only statistically significant predictors.
The graph to the right in figure 4 plots the aggregate association for a logit model predicting evaluations from age and network constraint, the two statistically significant predictors in table 1. Few received a “poor”
evaluation two years in a row, but the few who did were disproportion-ately managers surrounded by a circle of densely interconnected discussion partners. At the other extreme, being evaluated “outstanding” for both years was unlikely on average (Pp.16), but a manager whose discussion network spanned numerous structural holes had twice those odds (Pp
when ).13
.32 Cp10
Promotion
Promotion measures company-rewarded performance. Of managers still with the company in the second year, 14% were promoted to a higher job grade. A few were promoted two job grades, but most were a single grade, so I treat promotion as a dichotomy. Pay was sometimes a substitute for promotion, for example, if a person was doing a good job but had been promoted recently. Of the managers not promoted in the second year, 34% received an above-average salary increase. The percentage by which a manager’s salary increased is a continuous variable—salaries increased in the second year by an average of 5.5% over a range of 0%–30%—but the performance signal managers discuss is whether they received an above-average raise. Supervisors were given a budget sufficient to cover an average raise for each subordinate, then directed to allocate higher and lower increases according to merit. The average was defined by head-quarters and varied from one year to the next, so average was the
con-13A more intuitive, less robust, demonstration of the association with brokerage is to
sort managers into three broad groups with respect to business units:nonbrokers(312 managers in a group of densely interconnected discussion partners, as indicated by above-average network constraint),local brokers(196 managers with discussion part-ners in other groups, but all within the manager’s own business unit, e.g., persons 283, 504, 528 in fig. 3), andenterprise brokers(165 managers with discussion partners in other groups, some outside the manager’s own business unit, e.g., persons 9, 234, 402 in fig. 3). The hypothesis is that good ideas are borne of engaging alternative ways of thinking and behaving. Since variation is more likely between than within business units, enterprise brokers have the most of whatever brokerage provides, local brokers have less, and nonbrokers the least. Consistent with the hypothesis, the odds of being evaluated “outstanding” in the annual reviews before and after the survey drop from 24% of enterprise brokers, to 19% of local brokers, and 10% of nonbrokers. The odds of being evaluated “poor” in both years double from 5% of enterprise brokers, to 10% of local brokers, and 19% of nonbrokers. The two trends are nonrandom (33.5x2with
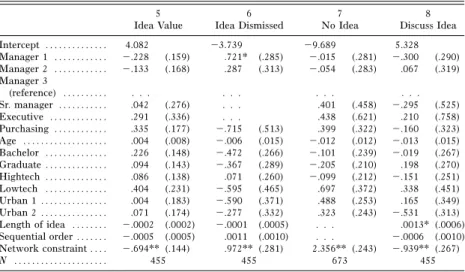
4df,P!0.01), but they disappear when network constraint is held constant (⫺6.4 test statistic for network constraint vs. .3 and⫺.1 for dummy variables distinguishing local and enterprise brokers respectively from nonbrokers). The same conclusion holds for model 5 in table 4 predicting the value of a manager’s best idea (⫺4.3 test statistic for network constraint vs.⫺1.1 and .9 for local and enterprise brokers), so I do not discuss with respect to table 4 the intuitive appealing distinction between local and enterprise brokers. The summary conclusion is that performance increases with bro-kerage, in or beyond the manager’s own business unit.
American Journal of Sociology
376
sistent benchmark against which managers could interpret individual pay increases. In sum, I have three promotion measures. In addition to in-creased job grade and percentage increase in salary, my summary measure is a dichotomy distinguishing the 42% of managers promoted or given an above-average salary increase.
Model 4 in table 1 shows the brokerage association with promotion. The more interconnected a manager’s discussion contacts last year, the lower the probability of being promoted or receiving an above-average pay increase this year (⫺.022 coefficient,⫺3.7 test statistic). The associ-ation is consistent across job ranks (negligible slope adjustments). The only significant control variable again is age. Holding age constant, the graph to the right in figure 4 shows how the probability predicted by model 4 changes with network constraint. The odds were good for being promoted or for receiving an above-average raise between the two years observed (42%). Managers brokering connections across segregated groups had significantly higher odds of a promotion or above-average salary increase (Pp.68 for Cp10). Managers limited to a circle of densely interconnected colleagues had the least chance (Pp.28 for Cp100). Adding a dummy variable distinguishing the 193 social isolates does not change the prediction (⫺1.4 test statistic). The same conclusion holds if the logit model is used to predict promotion to a higher job rank (⫺3.4 z-score for network constraint) or if a regression model is used to predict the percentage by which a manager’s salary increased in the second year (⫺3.2t-test for network constraint).14
GOOD IDEAS
Given the performance association with brokerage, there should be evi-dence of good ideas being associated with brokerage—if brokerage pro-vides the hypothesized vision advantage.
Idea Data
Managers were asked, “From your perspective, what is the one thing that you would change to improve [the company’s] supply-chain
manage-14The many salary correlates in models 1 and 2 that are negligible in model 4 lower
the direct effect of network constraint in model 4. Retaining only age and network constraint in the prediction yields about the same age effect (⫺6.2 test statistic), but the higher constraint effect in fig. 4 (⫺6.5 test statistic). The network-constraint as-sociation with percentage raise is similarly stronger when age alone is the control variable (⫺5.1t-test vs.⫺3.2 in the text), but the association with promotion alone is little changed (⫺3.0 test statistic vs.⫺3.4 in the text).