Procedia Engineering 154 ( 2016 ) 1251 – 1257
1877-7058 © 2016 The Authors. Published by Elsevier Ltd. This is an open access article under the CC BY-NC-ND license (http://creativecommons.org/licenses/by-nc-nd/4.0/).
Peer-review under responsibility of the organizing committee of HIC 2016 doi: 10.1016/j.proeng.2016.07.452
ScienceDirect
12th International Conference on Hydroinformatics, HIC 2016
Application of Support Vector Regression For Mid- and Long-Term
Runoff Forecasting In "Yellow River Headwater" Region
Haibo CHU
a, Jiahua WEI
a,b*, Tiejian LI
a,b, Kun JIA
ca
State Key Laboratory of Hydroscience & Engineering, Tsinghua University, Beijing 100084, China
b
State Key Laboratory of Plateau Ecology and Agriculture, School of Hydraulic and Electric Engineering, Qinghai University, Xining 810016, China
c
State Grid Qinghai Electric Power Company, Xining, Qinghai Province, 810016, China
Abstract
Accurate mid- and long-term runoff forecasting is of great significance for rational development and utilization of water resources in "Yellow River Headwater" region, where runoff in the headwater region contributes to nearly 35% of the total amount of the Yellow River basin. In this paper, the monthly runoff data of Tangnaihai station in
"Yellow River Headwater" region are analyzed as case studies. This paper presents support vector regression model for mid- and long-term runoff forecasting, and analyzes the influence of support vector regression model’s
parameters on the runoff forecasting accuracy, and finally compared with Auto Regressive model (AR) and Radial basis function neural network (RBFNN). The results indicate that SVR showed the best performance and is proved to be competitive with the AR and RBFNN models in both stations. SVR methods provide a promising reliable methods of mid- and long-term runoff forecasting.
© 2016 The Authors. Published by Elsevier Ltd.
Peer-review under responsibility of the organizing committee of HIC 2016.
Keywords: Support vector regression; Runoff forecasting; Yellow River Headwater; Radial basis function neural network
1.Introduction
"Yellow River Headwater" is an important source of freshwater resources in China, runoff of the headwater
*
Corresponding author. Tel.: +86-10-62796325; fax: +86-10-62772463.
E-mail address: [email protected]
© 2016 The Authors. Published by Elsevier Ltd. This is an open access article under the CC BY-NC-ND license (http://creativecommons.org/licenses/by-nc-nd/4.0/).
region accounts for nearly 35% of the total amount for the Yellow River basin [1, 2]. Reliable and accurate mid- and long-Term runoff forecasting is the important basis for decision making in formulation of water resources management and joint flood control operation of cascade reservoirs [3]. However, the hydrologic system is a large and complicated system, and runoff forecasting has the complex, random and non-linear characteristics, which makes runoff forecasting, especially mid- and-long-term runoff forecasting, become more complex and difficult [4].
Runoff forecasting has always been a challenging task for water resource engineers and decision makers, and a wide variety of models are applied to runoff forecasting. Adamowski et al. (2012) developed multivariate adaptive
regression spline (MARS), wavelet transform artificial neural network(WA-ANN), and regular artificial neural
network (ANN) models and compared for runoff forecasting applications in the mountainous watershed of Sainji in the Himalayas [5]. Talei et al. (2013) applied a Takagi–Sugeno neuro-fuzzy model with online learning for runoff forecasting on three different catchments. The results obtained from the local learning model were comparable or better than results obtained from physically-based [6]. Alimirzaie et al. (2015) used Seasonal Arima model to forecast flood for the next 12 years in the Urmia Lake catchment area [7].
Support vector regression (SVR) originates from Support vector machines (SVM), which were originally developed to solve the classification problems and pattern recognition, and have been successfully extended to solve forecasting problems in many fields. Khan and Coulibaly (2006) examines the potential of support vector regression to predict future water levels up to 12 months ahead, and compared the results with multilayer perceptron (MLP) model and seasonal autoregressive model (SAR) [8]. Wu et al. (2008) employed linear regression, the nearest-neighbor method, artificial neural network and support vector regression to water level prediction [9]. Salcedo-Sanz et al. (2011) focus the paper on the discussion of the application of the complete evolutionary-SVR algorithm to a real problem of wind speed prediction in wind turbines of a Spanish wind farm [10]. Kalteh et al. (2013) investigated the relative accuracy of artificial neural network (ANN) and support vector regression (SVR) models coupled with wavelet transform in monthly river flow forecasting of Kharjegil and Ponel stations in Northern Iran, and compared to regular ANN and SVR models, respectively [11]. Lu et al. (2015) employed Generalized regression neural network (GRNN) and support vector regression (SVR) were both applied to forecast monthly rainfall, and applied for six cities in in western Jilin Province, China [12].
In this paper, the monthly runoff data of Tangnaihai in "Yellow River Headwater" region are analyzed as case studies. SVR was applied to forecast monthly runoff, and a discussion about the main parameters how they influenced the performance of the SVR models was performed, and the best parameters were selected for mid- and long-term runoff forecasting, what’s more, the conventional autoregressive model (AR) and RBF were built for comparison.
2.Method
Support vector regression (SVR), developed from support vector machines (SVM), is a promising technique to deal with forecasting problems based on Vapnik-Chervonenks dimension theory and structure risk minimization principle. Compared with the conventional artificial neural networks, it has better generalization ability with structural risk minimization instead of minimizing the training errors [13].
The linear regression estimating function can be acquired as follows:
= +
f x
ZI
x b (1)where I x is a non-linear mapping from the input space to a high dimensional feature space, b is a threshold value and w is a weight vector, which can be estimated by minimizing the following regularized risk function:
N 2 i=1 1 = L , + 2 i i R C §¨C H d y ·¸ Z ©¦
¹ (2)C determines the tradeoff between flatness and the empirical risk,
H
is considered to measure empirical error withVapnik’s linear loss function.
After two slack variables can be incorporated into the regularized risk function to yield the following formulation
' 2 ' 1 1 , , , +C + 2 N i R Z [ [ H Z¦
[ [ (4) subject to ' ' + - + - + + , 0 T i i T i i x b y y x b Z I H [ Z I H [ [ [ d °° d ® ° t °¯ (5)This constrained optimization problem can be written as the Lagrangian function:
* * * * 1 1 1 1 , =- - - , + -2 N N N i i i i j j i j i i i i j i k x x d Q D D¦¦
D D D D¦
D D (6) subject to * * 1 1 * - =0 - C 0 0 =1, 2 N N i i i i i i i i i N D D D D D D d t t¦
¦
(7)
and an optimal weight vector of the regression model is
* 1 = -N i i i x Z¦
D D I (8)and so the linear regression in Eq. 11 becomes
* 1 = - , + N i i i i f x¦
D D k x x b (9)where k x x
i, j stands for the inner product of two vectors in the feature space, and Gaussian kernel function isthe most commonly used kernel function [14,15]. 3.Study area
Tangnaihai hydrological station is the control station of the biggest reservoir in the upstream of the Yellow River. Study area is located in the east of Qinghai Province between latitudes 32°5'N-36°30'N and longitudes 95°30'E-103°30'E and covered with an area of approximately 12.20×10⁴ km2 above Tangnaihai station. The average elevation is about 4217m and ranges from 2568 to 6264 m, and it has typical plateau continental monsoon region, the annual temperature difference is small, but the daily temperature difference is big, the annual average temperature in the study area ranges from -5.38 to 4.14°C, and the annual average evaporation ranges between 730 and 1700mm, the annual average rainfall ranges between 262.2 and 772.8mm, the average annual runoff Yellow River 1.39×10¹⁰m3.
In this study, the monthly runoff from 1987.01 to 2015.04 for a 28-year period in Tangnaihai stations were used. The dataset for the period 1987.01–2011.04 was used for training the models and the dataset for 2011.05-2015.04 for testing their performance.
4.Results and Discussion
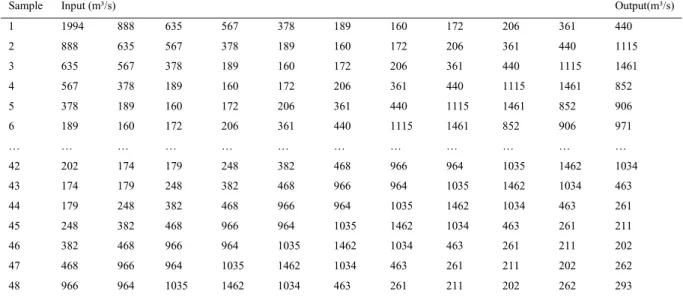
Support vector regression model was built for monthly runoff forecasting, and the training process was carried on to get the optimal parameters, finally runoff forecasting can be conducted according to the training parameters. In the application, the first 10 months of monthly runoff used as input, and the 11th monthly runoff as the output, which constitute 10-1 input -output structures, the specific test samples are shown in Table 1.
Table 1. The input-output pairs for testing the models
Sample Input (m³/s) Output(m³/s)
1 1994 888 635 567 378 189 160 172 206 361 440 2 888 635 567 378 189 160 172 206 361 440 1115 3 635 567 378 189 160 172 206 361 440 1115 1461 4 567 378 189 160 172 206 361 440 1115 1461 852 5 378 189 160 172 206 361 440 1115 1461 852 906 6 189 160 172 206 361 440 1115 1461 852 906 971 … … … … 42 202 174 179 248 382 468 966 964 1035 1462 1034 43 174 179 248 382 468 966 964 1035 1462 1034 463 44 179 248 382 468 966 964 1035 1462 1034 463 261 45 248 382 468 966 964 1035 1462 1034 463 261 211 46 382 468 966 964 1035 1462 1034 463 261 211 202 47 468 966 964 1035 1462 1034 463 261 211 202 262 48 966 964 1035 1462 1034 463 261 211 202 262 293
The important part to build support vector regression model is training the parameters, including regularization parameter C, spread σ and tube width
H
, which influenced the forecasting accuracy significantly. Hence, the parameter should be selected properly.The optimal parameters were determined by trial and error method, the spread ranges from 0.1 to 10,
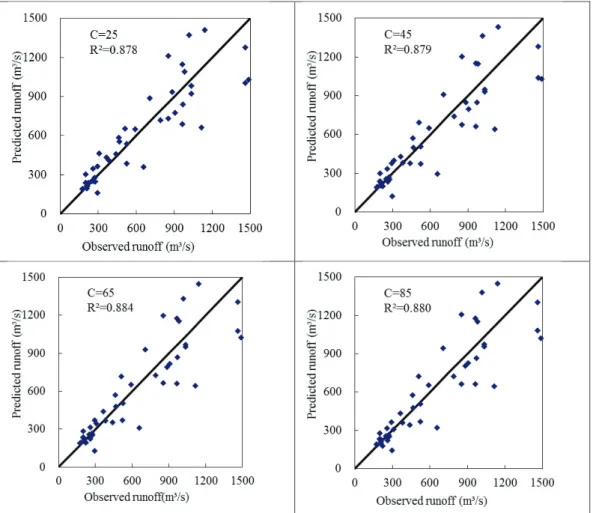
regularization parameter C ranges from 10 to 90, tube width ranges from 0.0001 to 0.1, the optimal values of three parameters were selected when R2 reached the maximum value as the values of three parameters changed. Figures 1 shows the changing of accuracy for test data sets when regularization parameter C were 25, 45, 65 and 85,
respectively and spread σ =2.1, tube width
H
=0.0001.As shown in Figure 1, when C=25, R2 almost was 0.878 in the testing phase, when C=45, R2 was almost 0.879 in the testing phase. The results showed that the best regularization parameter C was 65 with R2 almost 0.884. Hence, the support vector regression using the regularization parameter C value 65 was selected for monthly rainfall forecasting in this study.
Fig. 1. Performance of SVR with different regularization parameter C
As a result, regularization parameter C=65, spread σ=2.1, and regression tube widths ε=0.001 were selected as the optimal parameters in Tangnaihai station for runoff forecasting. Support vector regression model with the optimal parameters will forecast runoff most accurately.
RBFNN and AR models were also applied to forecasting monthly runoff, and compared with SVR model, and the comparison results were shown in Figure 2. It shows that SVR models and RBF performed better than AR model during the training phase, and the AR model generally underestimated the monthly runoff compared to the observed values. Mean relative error (MRE), coefficient of efficiency (CE) and correlation coefficient (R2). The smaller MRE is, the more accuracy runoff forecasting is, and the more close to 1 CE and R2 is, the more accuracy runoff
forecasting is. During the training phase, MRE for SVR, RBFNN and AR models are 0.143, 0.242 and 0.033, respectively, R2 for the above three models are 0.906, 0.896 and 0.844, respectively, CE for the above three models are 0.802, 0.822 and 0.623, respectively.
Fig. Fig. 2. Forecast and observed runoff by SVR during testing phase
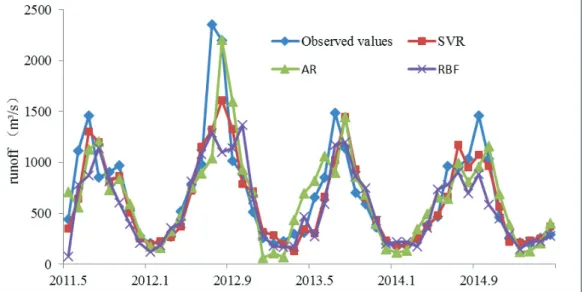
Figure 3 displays the comparison between forecasted and observed runoff during testing phase by AR, RBF and SVR for Tangnaihai. It can be found that SVR models obviously outperformed all other models during the testing phase in terms of the standard statistical measures, and both SVR models and RBFNN were able to forecast runoff, the MRE for SVR models and RBFNN are 0.198 and 0.229, respectively, the R2 are 0.883 and 0.852, respectively, the CE are 0.762 and 0.712, respectively, however, all the other methods performed better than AR model, and it obtained the worst MRE and R2, CE statistics of 0.318, 0.815 and 0.659, respectively.
Fig. 3. Forecasted and observed rainfall during testing by AR, RBF and SVR
This study also aims to investigate support vector regressions in mid- and long-term runoff forecasting in the western region of China. The results show that SVR models obviously outperformed RBFNN and AR models in terms of the standard statistical measures. Different parameters have an effect on the accuracy of SVR model, the well-trained SVR model can be used as a useful tool for runoff forecasting.
0 500 1000 1500 2000 2500 1987.11 1990.11 1993.11 1996.11 1999.11 2002.11 2005.11 2008.11 runoff (m ³/s) Observed values AR RBF SVR
Acknowledgements
This work has been sponsored in part by National Natural Science Foundation of China (Grant No. 51459003), the National Key Technology Research and Development Program of the Ministry of Science and Technology of China (Grant No. 2013BAB05B05, 2013BAB05B03), Special Fund for Public Welfare Industry of the Ministry of Water Resources in China (No. 201501028), and the State Grid Qinghai Electric Power Company (Grant No. SGTYHT/14-JS-188). We would like to thank all our sponsors and other members of the Hydraulic Big Data Research Group at the State Key Laboratory of Hydroscience and Engineering, Tsinghua University.
References
[1] Y. Lan, G. Zhao, Y. Zhang, J. Wen, X. Hu, J. Liu, M. Gu, J. Chang, J. Ma, Response of runoff in the headwater region of the Yellow River to climate change and its sensitivity analysis, J Geogr Sci. 20 (2010) 848-860.
[2] T. Mao, G. Wang, T. Zhang, Impacts of Climatic Change on Hydrological Regime in the Three-River Headwaters Region, China, 1960-2009, Water Resour Manag. 30 (2016) 115-131.
[3] H. Li, M. Xie, S. Jiang, Recognition method for midϋto longϋterm runoff forecasting factors based on global sensitivity analysis in the Nenjiang River Basin, Hydrol Process. 26 (2012) 2827-2837.
[4] M. Shoaib, A. Y. Shamseldin, B. W. Melville, M. M. Khan, Runoff forecasting using hybrid Wavelet Gene Expression Programming (WGEP) approach, J Hydrol. 527 (2015) 326-344.
[5] J. Adamowski, H. F. Chan, S. O. Prasher, V. N. Sharda, Comparison of multivariate adaptive regression splines with coupled wavelet transform artificial neural networks for runoff forecasting in Himalayan micro-watersheds with limited data, J Hydroinform. 14 (2012) 731-744.
[6] A. Talei, L. H. C. Chua, C. Quek, P. E Jansson, Runoff forecasting using a Takagi–Sugeno neuro-fuzzy model with online learning, J of Hydrol. 488 (2013) 17-32.
[7] H. Alimirzaie, A. Saremi, M. M. Soleymani, Precipitation and Runoff Forecasting and Analysis Using Stochastic Models (Case Study: Urmia Lake Catchment area), Bull. Env. Pharmacol. Life Sci. 4 (2015) 150-154.
[8] M. S. Khan, P. Coulibaly, Application of support vector machine in lake water level prediction. J Hydrol Eng. 11 (2006) 199-205. [9] C. L. Wu, K. W. Chau, Y. S. Li, River stage prediction based on a distributed support vector regression, J Hydrol. 358 (2008) 96-111. [10] S. Salcedo-Sanz, E. G. Ortiz-Garcı, Á. M. Pérez-Bellido, A. Portilla-Figueras, L. Prieto, Short term wind speed prediction based on
evolutionary support vector regression algorithms. Expert Syst with Appl. 38 (2011) 4052-4057.
[11] A. M. Kalteh, Monthly river flow forecasting using artificial neural network and support vector regression models coupled with wavelet transform, Comput Geosci. 54 (2013) 1-8.
[12] W. Lu, H. Chu, Z. Zhang, Application of generalized regression neural network and support vector regression for monthly rainfall forecasting in western Jilin Province, China. J Water Supply Res T. 64 (2015) 95-104.
[13] S. Liu, H. Tai, Q. Ding, D. Li, L. Xu, Y. Wei, A hybrid approach of support vector regression with genetic algorithm optimization for aquaculture water quality prediction. Math Comput Model. 58 (2013) 458-465.
[14] A. Kavousi-Fard, H. Samet, F. Marzbani, A new hybrid modified firefly algorithm and support vector regression model for accurate short term load forecasting, Expert syst appl. 41 (2014) 6047-6056.
[15] O. Kisi, K. S. Parmar, Application of least square support vector machine and multivariate adaptive regression spline models in long term prediction of river water pollution, J Hydrol. 534(2016) 104-112.