PREDICTING ACADEMIC PERFORMANCE VIA MACHINE LEARNING
METHODS
An Undergraduate Research Scholars Thesis by
QINGYU WU
Submitted to the Undergraduate Research Scholars program at Texas A&M University
in partial fulfillment of the requirements for the designation as an
UNDERGRADUATE RESEARCH SCHOLAR
Approved by Research Advisor: Dr. Tie Liu
May 2017
TABLE OF CONTENTS
Page ABSTRACT ... 1 NOMENCLATURE ... 2 CHAPTER I. INTRODUCTION ... 3 II. METHODS ... 5Naïve Bayes Classifier ... 6
Random Forest ... 7
III. RESULTS ... 9
IV. CONCLUSION ... 13
REFERENCES ... 14
ABSTRACT
Predicting Academic Performances via Machine Learning Methods
Qingyu Wu
Department of Electrical & Computer Engineering Texas A&M University
Research Advisor: Dr. Tie Liu
Department of Electrical & Computer Engineering Texas A&M University
Machine learning has been a heavily researched area in recent years, and many machine-learning methods for data analysis have been proposed in literature. The goal of this research was to explore various machine-learning methods for the purpose of predicting the future
performance of Electrical Engineering majors based on their academic records from the common year in the College of Engineering. Machine-learning methods make predictions solely based on historical data, and no external biases are involved in the decision-making process. Therefore, such predictions can be much more objective than those offered through in-person meeting and “eyeball” tests. In our work, we used the final grades from ECEN 214 Electrical Circuit Theory as the primary indicator of future performance. Our research showed that both the Naïve
Bayesian and Random Forest methods could lead to accurate predictions of the ECEN 214 final grade based on the student’s academic records from the common year. Our research also
revealed the courses that have the most predictive power in the future performance of Electrical Engineering majors.
NOMENCLATURE
TAMU Texas A&M University
ECEN Electrical & Computer Engineering
EE Electrical Engineering
CE Computer Engineering
GPA Grade Point Average SAT Scholastic Aptitude Test
NN Neural Networks
SVM Support Vector Machine ELM Extreme Learning Machine
CHAPTER I
INTRODUCTION
The Electrical and Computer Engineering Department undergraduate academic advisors provide a number of consulting services to current and incoming electrical-engineering (EE) and computer-engineering (CE) major students. Advising incoming freshmen engineering students who are entering the EE major has a long-term impact on the students’ university experiences. Such a decision is crucial from the students’ perspective.
Traditionally, the undergraduate academic advisors provide such advice by gathering the students’ academic track records and reach their conclusions through “eyeball” tests. While such an approach can provide valuable advice to the students, especially when there are strong
indicators in the students’ academic track records, such advice can be inconsistent and much less conclusive when the students’ track records exhibit complicated patterns with possibly
contradicting indicators. This is where machine-learning methods can be most useful.
Machine learning methods associate certain “patterns” of the students’ track records with different outcomes based on their historical data. Such associations are then used as predictors for students who are currently seeking advice. A well-designed predictor not only considers the students’ transcripts, but can also consider the context of the students’ grades in the past, such as the inconsistency of the grading policy of individual instructors and the students’ course load while obtaining those grades. Such information is difficult to synthesize via “eyeball” tests. More importantly, machine-learning methods make predictions based solely on historical data, and no
personal factors are involved in the decision-making process. Therefore, such predictions can be much more objective than those offered through in-person meeting and “eyeball” tests.
Machine learning is being heavily researched in recent years, and various machine-learning methods for predicting students’ grades have been proposed in the literature. Tekin applied NN, SVM, and ELM algorithms to data of computer education and instructional technology students to predict their GPAs at graduation with an accuracy of over 90%, and concludes that these algorithms can assist with how educational institutions analyze and solve the domain-related problems by GPA prediction (Tekin). Some other works, Bridgeman, Meier and W., aim to achieve the same goal by predicting grades, but they use different factors. For example, Meier exclusively uses the scores students achieve in early performance assessments, Bridgeman uses SAT scores, and W. considers the factors more concentrated on the biography field, such as biographical backgrounds, personal interviews, and letters of recommendation (Meier, W., Bridgeman). Note, however, that the success of a machine-learning method critically depends on the granularity of the data available, the purpose of the prediction, and the size of the historical data. Therefore, an important objective of this project is to understand what might be the most appropriate machine-learning method, given the data available to us and the specific purpose of our predictions. This will be the main intellectual contribution of this project.
CHAPTER II
METHODS
The preliminary stage of the research focused on feature selection. In our case, it is the selection of a set of features that are relevant to the outcome being predicted. As suggested by academic advisors, the features include the final letter grades for some freshmen and sophomore courses for engineering students, most of which are the prerequisite courses for ECEN courses. From the results of data pre-processing, ten courses were chosen to be the input courses: ENGR 111, ENGR 112, CSCE 121, MATH 151, MATH 152, MATH 251, PHYS 208, PHYS 218, CHEM 107, CHEM 117. The final grades for these ten courses along with the final letter grades for the output course were used as the inputs to drive the machine learning models. Once the machine learning models were built, the final grades of these ten courses were used as the inputs for prediction. As for the output selection, there are only two ECEN major courses in sophomore year. One of them is ECEN 214, the other one is ECEN 248, both of which are the pre-requisite courses for higher-level major courses. However, ECEN 214 course is more related to EE, while ECEN 248 is related to CE. As the purpose of the research was to assist freshman-engineering students who consider an EE major, EE sophomore course (ECEN 214) was selected as the output for machine learning models.
After input and output courses were determined, a request for a sample database was submitted to ECEN department head. Originally, a total of 200 students’ historical data
(transcripts without students’ identity information) had been acquired with the permission from the Electrical and Computer Engineering Department Head. Since the final grades from TAMU are only effective to the research, all the final letter grades from other colleges or universities
were removed from the original data base. In addition, based on TAMU rule, for some prerequisite courses, students should get at least a C to pass, otherwise reregistration will be required. Thus, there might be more than one final letter grades for a single course on a transcript. In this case, only the first grade was counted. All the missing data and IP data were regarded as useless data. After data was pre-processed, only 82 students are remained in database.
Next, a total of 82 samples were randomly partitioned into five equal sized subsamples, of which a single subsample was used as test data for validation, and the remaining four
subsamples were used as training data, which were applied to drive the model. Each folder took turns to be the test data, and then the error rate for each folder was checked by comparing the predicted values with the actual values. The average misclassification rates across all five folders were designated to evaluate the accuracy for the model.
The algorithm Naïve Bayes and Random Forest were performed on the sample to validate the relevancy of the chosen features. The following section explains our methods using Naïve Bayes Classifier and Random Forest algorithm for developing machine learning models, which can functionally predict the grades for ECEN 214.
Naïve Bayes Classifier
For each student, the possibility of getting a final letter grade for one course will not affect the possibility of getting a final letter grade for the other. Therefore, the final letter grades for each input course contributes independently to the probability of the outcome, which is the final letter grades for ECEN 214 course. Based on this assumption, Naïve Bayes classifier can be
values of features. The Naïve Bayes classifier used P(Ck, X1,…,Xn) and P(X1,…,Xn | Ck) to
estimate P(Ck), as follows:
P(Ck, X1,…,Xn) = P(Ck) * P(X1,…,Xn | Ck) ≈ P(Ck) * ∏ni=1P(Xi | Ck) (“Naïve Bayes Classifier”)
where Ck stands for the final letter grades for ECEN 214 course, and Xi represents the final letter
grades for ENGR 111, ENGR 112, CSCE 121, MATH 151, MATH 152, MATH 251, PHYS 208, PHYS 218, CHEM 107, CHEM 117. Thus, our value for n will be 10.
To begin with, using 80% of students in our sample space, we took their final letter grades for the ECEN 214 course and ten other input courses. We used this as training data which will be used to drive our model. Using those values we can calculate P(Ck, X1,…,Xn) and
∏n
i=1P(Xi | Ck). Then the final letter grades for the ten input courses for the remaining 20%
samples were used as testing data, where the final letter grade for ECEN 214 course was estimated for each sample. The same process was repeated five time until each folder has a chance to be the testing data. The accuracy for each folder and the accuracy for the overall data were recorded.
Random Forest
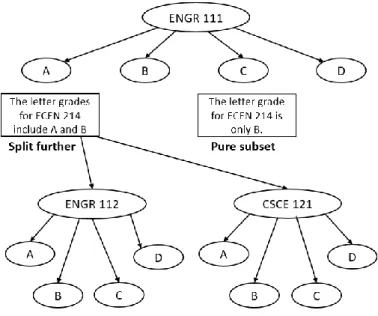
The Random Forest algorithm is based on a tree-like flow chart model, an example of which can be seen in figure 1 on the next page. The tree-like structure consists of nodes and leaves. Each node corresponds to each input variable. While each leaf represents all the different outcome that could be achieved, when given the inputs variables represented by the path from the root to the leaf. The tree-like model can be driven by splitting the source set into subsets based on the attribute value test (“Decision tree learning”).
In research, the nodes consisted of each of the 10 courses. Each leaf represented a
for each node were determined by the possible final letter grades for that. Then a subset composed of the final letter grades for ECEN 214 would be collected. If the subset is pure, the final letter grades for the subset are all the same, it will be a leaf, otherwise the current node will be split further and the same steps will be repeated for the other input course. The node would keep being split until the result is a pure subset. However, if the subset is still not pure after passing through all the nodes (input variables), the outcome will be assumed to be the letter grade with highest probability.
Figure 1 shows an example of the Random Forest algorithm.
CHAPTER III
RESULTS
This section verifies two models by analyzing the results coming from the models with the actual corresponding data, followed by a brief discussion about their effectiveness. The final predicting results sheet from both models are attached in the appendix.
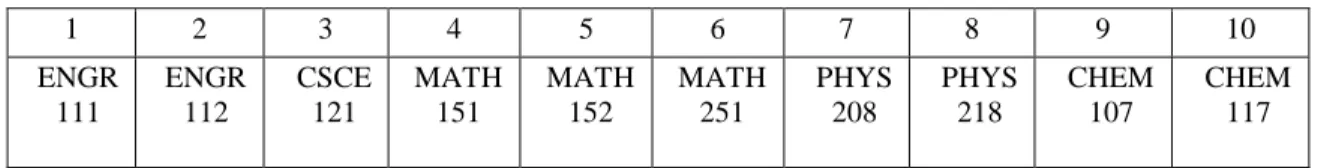
After filtering out all the missing and IP values, as well as grades transferred from other colleges, the correlation coefficient between the pairs of variables (the grades for ECEN 214 and the grades for other courses) were able to get. From those results, ten features with the top ten correlation coefficients were selected, as shown in Table 1.
Table 1- A List of Features
1 2 3 4 5 6 7 8 9 10 ENGR 111 ENGR 112 CSCE 121 MATH 151 MATH 152 MATH 251 PHYS 208 PHYS 218 CHEM 107 CHEM 117
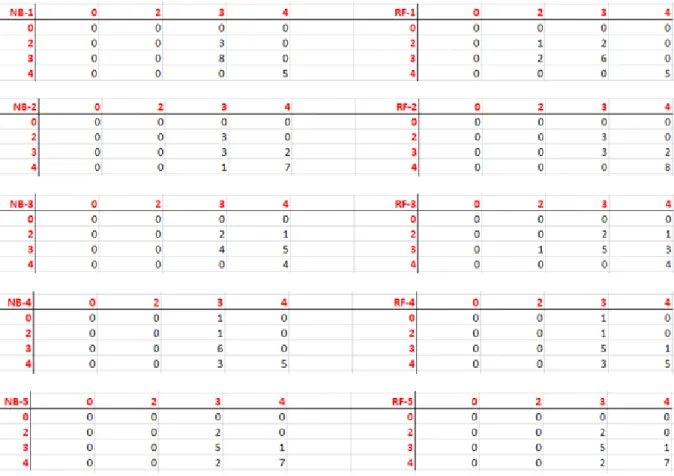
Figure 2 shows five confusion matrixes of five folders where each one is used as testing data, from which we could clearly compare the different predicting results from the two models. The vertical axis represents the predicting values, while the horizontal axis represents the actual values. 0 stands for F, 2 stands for C, 3 stands for B, 4 stands for A. None of the samples got a D for ECEN 214 course. So only 0,2,3,4 were listed in the chart. Figure 3 shows the accuracy of each folder and overall accuracy for NB and RF models.
Figure 2- Results of 5 confusion matrixes for 5 folders from Naïve Bayes and Random Forest algorithm. Horizontal number bar is actual data; vertical number bar is predicted data
Except one sample in folder 4, who got an F in ECEN 214 but is predicted to be a B, all other predictions are within one letter’s range with the actual values. And the differences between two models are within a reasonable range for all folders. We went back and checked that specific sample from the original data sheet, finding that he got an A, two Bs, six Cs, and a D in all other feature courses. Therefore, we could draw the conclusion that his grade for ECEN 214 is a particular case according to his history records.
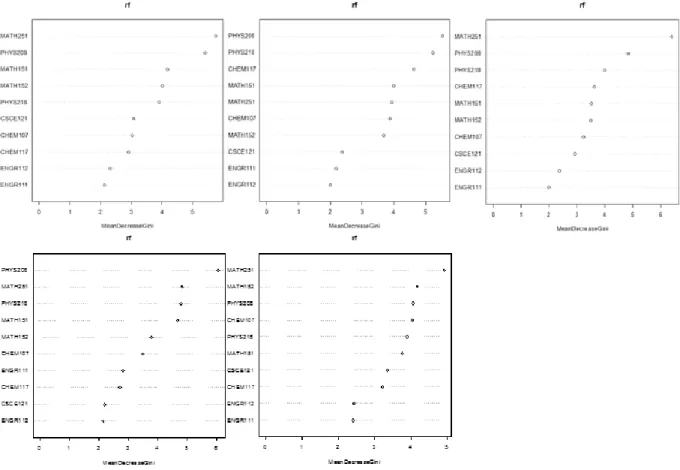
In the method of RF, we could graph the order of importance of feature (from top to bottom) with regards to the target variable. Figure 4 displays the results from folder 1 to 5 in sequence, from which we could roughly pick out the courses with higher relationship to ECEN 214 course.
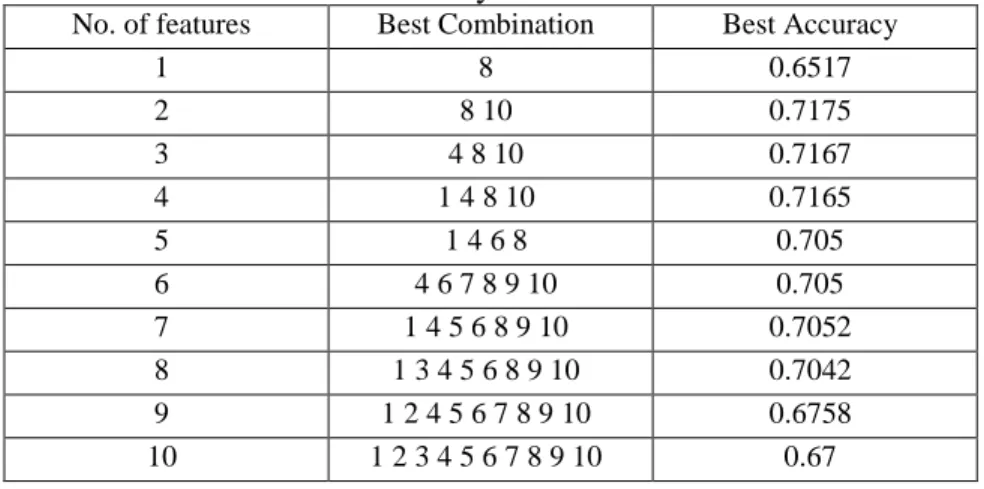
To make it clearer, we also tested a set of best accuracies from the best combinations, as the number of features increase from 1 to 10. The results of best accuracy for best combinations are shown in table 2. The corresponding number to each feature course can be found in Table 1.
Table 2- Best Accuracy for Best Combinations
No. of features Best Combination Best Accuracy
1 8 0.6517 2 8 10 0.7175 3 4 8 10 0.7167 4 1 4 8 10 0.7165 5 1 4 6 8 0.705 6 4 6 7 8 9 10 0.705 7 1 4 5 6 8 9 10 0.7052 8 1 3 4 5 6 8 9 10 0.7042 9 1 2 4 5 6 7 8 9 10 0.6758 10 1 2 3 4 5 6 7 8 9 10 0.67
CHAPTER IV
CONCLUSION
The accuracies of both Naïve Bayes model and Random Forest model are around 70%, so both models have similar prediction power. However, the Random Forest model is able to give more information, such as quantifying the importance of different features. From the results, the conclusion can be draw that MATH 151, MATH 251, PHYS 208, and CHEM 117 have strong powers over predicting the grades for ECEN 214.
Therefore, if academic advisors for ECEN department will consider using such machine learning models while providing freshman engineers with advisors about selecting ECEN major in their future, not only the prediction accuracy will be improved, but the advising time will also be saved.
REFERENCES
Bridgeman, Brent, Judith Pollack, and Nancy Burton. “Predicting Grades in different Types of Colleges Courses.” The College Board 1 (2008). Web.
“Decision tree learning.” Wikipedia. Wikimedia Foundation, 06 Apr. 2017. Web. 24 Apr. 2017. Gorr, W., D. Nagin, and J. Szcaypula. “Comparative Study of Artificial Neural Network and
Statistical Models for Predicting Student Grade Point Averages.” International Journal
of Forecasting 10(1994): 17-34. Web.
Meier, Ynnick, Jie Xu, Onur Atan, Mihaela Van der Schaar. “Predicting Grades.” IEEE. Web “Naïve Bayes classifier.” Wikipedia. Wikimedia Foundation, 29 Mar. 2017. Web. 24 Apr. 2017.
Tekin, Ahmet. “Early Prediction of Students’ Grade Point Average at Graduation: A Data Mining Approach.” Eurasian Journal of Educational Research 54 (2014): 207-26. Web.