ORIGINAL ARTICLE
Effects of radiotherapy on salivary gland
function in patients with head and neck
cancers
Chia-Yung Lin
a, Shine-Shine Ju
b, Jean-San Chia
b,
Chin-Hao Chang
c, Ching-Wen Chang
a, Min-Huey Chen
b*
a
Department of Dentistry, National Taiwan University Hospital Hsinchu Branch, Hsinchu 30059, Taiwan ROC
b
Department of Dentistry, School of Dentistry, National Taiwan University, Taipei 10048, Taiwan ROC c
Department of Medical Research, National Taiwan University Hospital, Taipei 10002, Taiwan ROC Received 5 December 2014; Final revision received 14 January 2015
Available online 27 May 2015
KEYWORDS
buffering capacity; dental plaque; head and neck
cancer; radiotherapy; saliva
Abstract Background/purpose:We explored changes in salivary gland function of
head-and-neck cancer patients after radiotherapy, including pH of saliva, stimulated salivary flow rate, and saliva buffering capacity. The pH of saliva included that of parotid gland, submaxillary gland, and total resting saliva. We also investigated whether the acidity of dental plaque low-ered pH of saliva.
Materials and methods:From a total of 62 patients, 11 had repeated measurements taken before and every month after radiotherapy. The remaining 51 patients had a single measure-ment taken after radiotherapy. Seven normal patients served as the control group.
Results:In the repeated measurement group, all examinations decreased dramatically in the 1stmonth after radiotherapy (P<0.0001), and recovered from the 3rdmonth to the 6thmonth, but the flow rate could not return to pretreatment level. In the single measurement group, uni-labiate linear regression analysis showed that the time-period after radiotherapy was a signif-icant predictor influencing the pH of the submaxillary gland and total resting saliva. Pearson correlation coefficient analysis showed that the pH of dental plaque had a positive linear cor-relation with that of saliva. Concerning the influence of time-period, within 1 year after radio-therapy, all examinations were dropped. After 1 year the pH of resting saliva and plaque began to increase over time. The stimulated flow rate, pH of stimulated saliva, and buffering capac-ity, dropped<1 year after radiotherapy group, increased 1e5 years after radiotherapy group, but dropped again>5 years after radiotherapy group.
* Corresponding author. Department of Dentistry, School of Dentistry, National Taiwan University, Number 1, Changde Street, Jhongjheng District, Taipei City 10048, Taiwan ROC.
E-mail address:minhueychen@ntu.edu.tw(M.-H. Chen).
http://dx.doi.org/10.1016/j.jds.2015.01.004
1991-7902/Copyrightª2015, Association for Dental Sciences of the Republic of China. Published by Elsevier Taiwan LLC. All rights reserved. Available online atwww.sciencedirect.com
ScienceDirect
j o u r n a l h o m e p a g e :w w w . e - j d s . c o mConclusion:Our results indicated that oral hygiene care is important especially during the early period after radiotherapy.
Copyrightª2015, Association for Dental Sciences of the Republic of China. Published by Else-vier Taiwan LLC. All rights reserved.
Introduction
Head-and-neck cancer (HNC) is one of the leading causes of cancer mortality in Taiwan. For these patients, radiotherapy plays an important role in the treatment. However, xero-stomia caused by salivary gland dysfunction is a common complication in HNC patients after radiotherapy.1 Consid-erable acute and long-term side effects severely reduce life quality of HCN patients.2At present, there is no effective
therapy for xerostomia.3 Understanding detailed saliva change of HCN patients after radiotherapy is mandatory for prevention of dental caries, periodontitis, mucositis, etc. As salivary glands are in the path of ionizing radiation and very radiosensitive, the striking reduction in saliva output accompanied by significant increases in saliva Naþ, Cl, Caþþ, Mgþþ, protein concentrations, and a decrease in HCO3content are frequently observed after radiotherapy.4 Stimulated salivary production is largely (60e70% of total) derived from the parotid glands, with the balance from other glands; resting (unstimulated) salivary production is primarily due to the submaxillary and sublingual glands and numerous small oral salivary glands.5,6 On average, unsti-mulated flow rate of saliva is 0.3e0.5 mL/min, whereas stimulated flow rate is 1.1e3.0 mL/min.7
Saliva functions in the following areas: (1) modulate pH and the buffering ca-pacity of saliva; (2) cleanse oral microorganisms and dental plaque; (3) modulate demineralization and remineraliza-tion; and (4) provide antibacterial action.8 The buffering capacity of saliva is very important for oral hygiene main-tenance of HCN patients after radiotherapy, works more efficiently during stimulated high flow rates but is almost ineffective during periods of low flow with unstimulated saliva.9,10 There are different types of acinar cells in different salivary glands. Serous acinar cells, mainly in the parotid glands, are more easily damaged than mucous acinar cells in the sublingual and submaxillary glands after radiotherapy.11 This study aimed to explore changes in salivary gland function of HCN patients after radiotherapy. Individual functional examinations were performed and all detailed data were collected to plot the change-tendency of every single salivary function. We also figured out whether the acidity of dental plaque decreased the pH level of saliva after radiotherapy.
Materials and methods
Eligibility criteria
Saliva samples from a consecutive clinical cohort of patients were collected during 2010e2011. We obtained samples from 62 head and neck cancer patients (45 male and 17
female participants) at the Department of Oral and Maxil-lofacial Surgery, National Taiwan University Hospital, Taipei, Taiwan. The study samples were required to be from pa-tients over 18 years old and new to radiotherapy. Those who had already received radiotherapy, taken any medication, or suffered any systemic disease interfering with salivary gland function, and had trouble in communication were excluded. The age distribution of 62 patients was 26e70 years (Table 1). The study was approved by the Institutional Review Board of the National Taiwan University Hospital. All par-ticipants provided informed written consent before being included. Among these 62 patients, 11 (7 male and 4 female) had repeated measurements taken before and every month after radiotherapy (Table 2). In this repeated measurement group, functional examinations were performed to track salivary gland changes due to radiotherapy. The remaining 51 patients (38 male and 13 female) had a single measure-ment taken at an arbitrary time after radiotherapy (Table 3). Additionally, seven normal patients (2 male and 5 female) agreed to participate in this study (Table 4). The following functional examinations and observations were performed and recorded by one person. Salivary samples were collected using GC Saliva-Check Buffer kits (GC America INC.http:// www.gcamerica.com/products/preventive/Saliva_Check_ BUFFER/index.php.). Samples were collected before meals
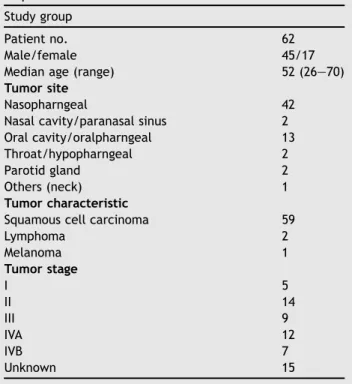
Table 1 The age distribution and tumor classification of
62 patients were demonstrated. Study group
Patient no. 62
Male/female 45/17
Median age (range) 52 (26e70)
Tumor site
Nasopharngeal 42
Nasal cavity/paranasal sinus 2 Oral cavity/oralpharngeal 13
Throat/hypopharngeal 2
Parotid gland 2
Others (neck) 1
Tumor characteristic
Squamous cell carcinoma 59
Lymphoma 2 Melanoma 1 Tumor stage I 5 II 14 III 9 IVA 12 IVB 7 Unknown 15
or at least 2 hours after meals. For this purpose, samples were collected between 2:00PMand 4:00PMduring the day for collection to minimize effects of the diurnal variability in salivary composition. During the time of collection, smoking, eating, and talking were prohibited.12 The following data were also then recorded from the patients at the time point of saliva collection.
Decayed/Missing/Filling Teeth (DMFT)
The DMFT method (D Z decayed, M Z missing, and FZfilling)13was used to record patients’ dentition situa-tions. All third molars were excluded.
pH of saliva
The test paper in GC Saliva-Check Buffer kit was put in the opening of Stenson’s duct for 10 seconds for the pH of the parotid gland saliva and recorded as pH(P), and put in the opening of Wharton’s duct for 10 seconds for the pH of submaxillary gland saliva and recorded as pH(S). When patients were in the rest situations, they were asked to spit saliva gently into collecting cups. The test paper was then put in the cup provided by the GC Saliva-Check Buffer kit for 10 seconds for the pH of total resting saliva and recorded as pH(total). The test paper would change color after 10 seconds and the pH could be read according to the color demonstration by the manufacture’s instruction.
Stimulated salivary flow rate
After chewing the bite-wax in the GC saliva-Check Buffer kit for 30 seconds, the patient was instructed to spit saliva gently into saliva collecting cups and this first sample was excluded. Then the patient kept chewing for 5 minutes and spit every 15e20 seconds, which was recorded as flow rate (mL/5 min). The pH of this stimulated saliva was also examined by test paper and recorded as pH(B).
Saliva buffering capacity
The stimulated saliva was also examined by the buffering capacity pad in the kit. The sample was applied on three pads for 10 seconds and the color of the pads were changed individually. The sum of three color scores (green Z 4; green/blueZ 3; blueZ 2; blue/redZ 1; and blueZ0) indicated the buffering capacity (high Z 10e12; middleZ6e9; and lowZ0e5).
pH of dental plaque
The dental plaque from the central incisor and first molar were collected by the probe and its pH was examined by test paper and recorded as pH(p).
Statistical analysis
A mixed model was used in the repeated measurement group because some patients were absent at some
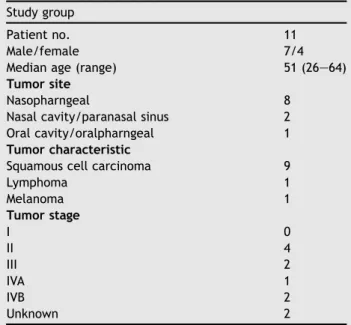
Table 2 Eleven patients had repeated measurements
taken before and every month after radiotherapy. Study group
Patient no. 11
Male/female 7/4
Median age (range) 51 (26e64)
Tumor site
Nasopharngeal 8
Nasal cavity/paranasal sinus 2 Oral cavity/oralpharngeal 1 Tumor characteristic
Squamous cell carcinoma 9
Lymphoma 1 Melanoma 1 Tumor stage I 0 II 4 III 2 IVA 1 IVB 2 Unknown 2
Table 3 Fifty-one patients had a single measurement
taken at an arbitrary time after radiotherapy. Study group
Patient no. 51
Male/female 38/13
Median age (range) 53 (29e70)
Tumor site
Nasopharngeal 34
Nasal cavity/paranasal sinus 2 Oral cavity/oralpharngeal 11
Throat/hypopharngeal 1
Parotid gland 2
Others (neck) 1
Tumor characteristic
Squamous cell carcinoma 50
Lymphoma 1 Tumor stage I 5 II 10 III 7 IVA 11 IVB 5 Unknown 13
Table 4 The age distribution of seven normal patients
was demonstrated. Study group
Patient no. 7
Male/female 2/5
appointments due to discomfort (nwas not always equal to 11). The details are demonstrated inTable S1. The change tendency of salivary gland function, including pH(P), pH(S), pH(total), buffering, pH(B), and pH(p), before and every month after radiotherapy was analyzed. A universal linear regression model was used in the single measurement group. The influences of age, sex, and time-period after radiotherapy on salivary gland function were analyzed, and Pearson correlation coefficient was used to analyze the relationship among pH(p), pH(P), pH(S), and pH(total). Studentttest was also used to distinguish the relationship between time-period and salivary gland function among these groups: pretreatment,< 1 year after radiotherapy, 1e5 years after radiotherapy, and> 5 years after radio-therapy. The software was SAS version 9.2 (SAS Institute Inc., Cary, NC, USA) and the value ofawas 0.05.
Results
DMFT
The average DMFT in the pretreatment group, < 1 year after radiotherapy, 1e5 years after radiotherapy group, and>5 years after radiotherapy were 14, 10.44, 12.59, and 13.71. The normal control group was 14.
pH of saliva and plaque
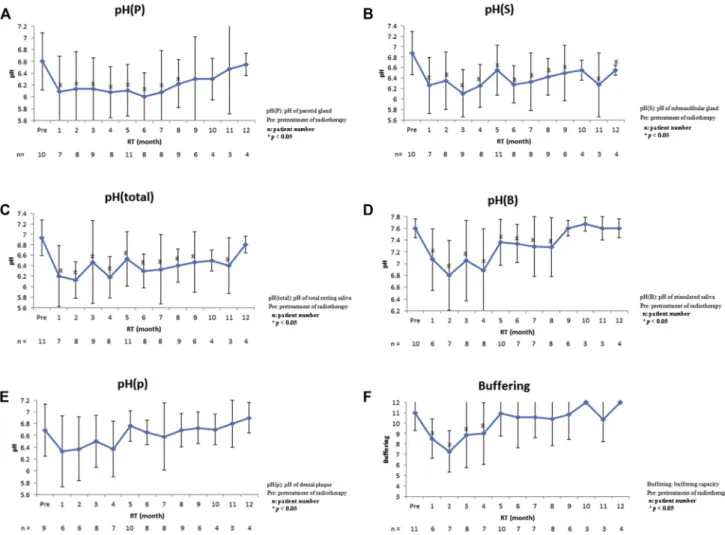
In the repeated measurement group (n Z 11), the pH(P), pH(S), pH(total), pH(B), and pH(p) are demonstrated in Fig. 1. The pH(P) was 6.60 before radiotherapy, and declined steadily to the lowest 6.00 (P Z 0.148) at 6
Figure 1 The pH(P), pH(S), pH(total), pH(B), pH(p), and buffering capacity were analyzed in the repeated measurement group;
(A) pH(P) declined from 6.60 to 6.09 (PZ0.002) 1 month after radiotherapy, to the lowest 6.00 (PZ0.148) 6 months after radiotherapy, and then began to increase; (B) pH(S) declined from 6.88 to 6.26 (PZ0.0003) 1 month after radiotherapy, to the lowest 6.11 (P<0.0001) at 3 months, and returned to 6.55 12 months after radiotherapy; (C) pH(total) declined from 6.93 to 6.20 (PZ0.0002) 1 month after radiotherapy, to the lowest 6.13 (PZ0.0001) 2 months after radiotherapy, and returned to 6.80 12 months after radiotherapy; (D) pH(B) declined from 7.60 to 7.07 before and 1 month after radiotherapy (PZ0.003). Then it increased to 7.60 9 months after radiotherapy; (E) pH(p) declined from 6.69 to 6.33 before and 1 month after radiotherapy (PZ0.053). Then it increased to 6.90 12 months after radiotherapy; (F) the score of buffering capacity declined from 11 to 8.50 1 month after radiotherapy, to the lowest 7.29 (P<0.0001) 2 months after radiotherapy, and then increased.
months after radiotherapy. There was no difference be-tween before and 9 months after radiotherapy (P> 0.05; Fig. 1A). The pH(S) was 6.88, higher than pH(P), before radiotherapy, and declined to the lowest 6.11 (P<0.0001) at 3 months after radiotherapy. Even though it returned to 6.55, there was a significant difference between before and 12 months after radiotherapy (P Z 0.018; Fig. 1B). The pH(total) was 6.93, higher than pH(P)/pH(S), before radiotherapy, and declined to the lowest 6.13 (PZ0.0001) at 2 months after radiotherapy. There was no difference between before and 12 months after radiotherapy (P >0.05;Fig. 1C). The pH(B) declined from 7.60 to 7.07 before and 1 month after radiotherapy (PZ0.003). There was no difference between before and 9 months after radiotherapy (P>0.05;Fig. 1D). The pH(p) declined from 6.69 to 6.33 before and 1 month after radiotherapy (PZ0.053). There was no difference between before and 12 months after radiotherapy (P > 0.05; Fig. 1E). In the single measurement group (n Z 51), the pH(P), pH(S), pH(total), pH(B), and pH(p) are demonstrated inTable 5. According to the univariate linear regression model, the average pH(P) decreased 0.002 with age, decreased 0.018 in male patients, and increased 0.074 with time. The average pH(S) decreased 0.011 with age, decreased 0.068 in male patients, and increased 0.098 with time. The average pH(total) decreased 0.005 with age, decreased 0.116 in male patients, and increased 0.128 with time. The average pH(B) increased 0.009 with age, increased 0.292 in male patients, and decreased 0.128 with time. The average pH(p) decreased 0.005 with age, decreased 0.216 in male patients, and increased 0.053 with time. Concerning the influence of time-period, four groups: pretreatment, < 1 year after radiotherapy, 1e5 years after radiotherapy, and
>5 years after radiotherapy were analyzed. The pH(P) in each group was 6.60, 6.24, 6.27, and 6.40 respectively, and there were no significant differences in all groups (Fig. 4A). The pH(S) in each group was 6.88, 6.49, 6.63, and 6.68 respectively, and there were no significant differences (Fig. 4B). The pH(total) in each group was 6.93, 6.24, 6.54, and 6.59 respectively, and statistically significant differ-ence was reached between pretreatment and < 1 year after radiotherapy groups (Fig. 4C). The pH(B) in each group was 7.6, 7.16, 7.35, and 6.97 respectively, and sta-tistically significant differences were reached between pretreatment group,<1 year after radiotherapy group and
>5 years after radiotherapy group (Fig. 4D). The pH(p) in each group was 6.69, 6.53, 6.57, and 6.70 respectively, and there were no significant differences in all groups (Fig. 4E).
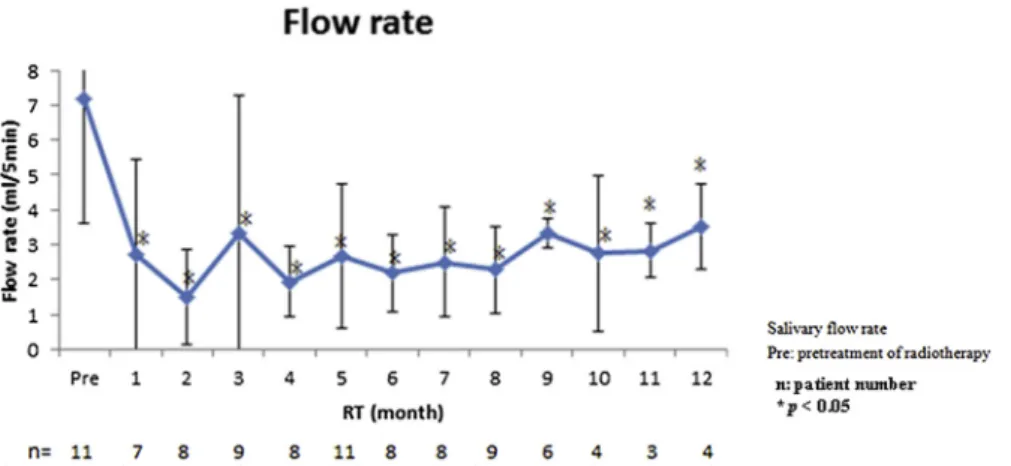
Stimulated salivary flow rate
In the repeated measurement group, the flow rate (mL/ 5 min) was 7.18 before radiotherapy. It declined steeply to 2.71 (P<0.0001) 1 month after radiotherapy, and to the lowest 1.5 at 2 months after radiotherapy. Although it increased slowly at 3 months after radiotherapy, it still could not return to the pretreatment level (P < 0.0001; Fig. 2). In the single measurement group, the flow rate decreased 0.009 with age, increased 1.156 in male pa-tients, and decreased 0.197 with time (Table S2). Con-cerning the influence of time-period, four groups:
pretreatment,<1 year after radiotherapy, 1e5 years after radiotherapy, and > 5 years after radiotherapy were analyzed. The flow rate in each group was 7.18, 2.19, 3.78, and 1.47 respectively, and the latter three groups showed significant differences with pretreatment group (Fig. 4F).
Saliva buffering capacity
In the repeated measurement group, the score was 11 before radiotherapy. It declined steeply to 8.50 at 1 month after radiotherapy, to lowest 7.29 (P<0.0001) at 2-months after radiotherapy, and then increased. There was no significant difference between before and 5 months after radiotherapy (P> 0.05; Fig. 1F). In the single measurement group, the score increased 0.005 with age, increased 0.588 in male pa-tients, and increased 0.125 with time (Table 5). Concerning the influence of time-period, four groups: pretreatment,<1 year after radiotherapy, 1e5 years after radiotherapy, and>
5 years after radiotherapy were analyzed. The score of each group was 11, 7.94, 10.11, and 8.46 respectively, and
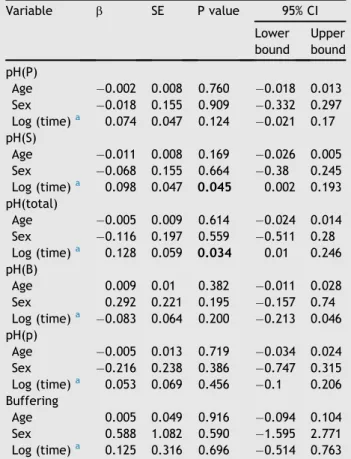
Table 5 The pH(P), pH(S), pH(total), pH(B), pH(p), and
buffering capacity were analyzed in the single measure-ment group. Variable b SE P value 95% CI Lower bound Upper bound pH(P) Age 0.002 0.008 0.760 0.018 0.013 Sex 0.018 0.155 0.909 0.332 0.297 Log (time)a 0.074 0.047 0.124 0.021 0.17 pH(S) Age 0.011 0.008 0.169 0.026 0.005 Sex 0.068 0.155 0.664 0.38 0.245 Log (time)a 0.098 0.047 0.045 0.002 0.193 pH(total) Age 0.005 0.009 0.614 0.024 0.014 Sex 0.116 0.197 0.559 0.511 0.28 Log (time)a 0.128 0.059 0.034 0.01 0.246 pH(B) Age 0.009 0.01 0.382 0.011 0.028 Sex 0.292 0.221 0.195 0.157 0.74 Log (time)a 0.083 0.064 0.200 0.213 0.046 pH(p) Age 0.005 0.013 0.719 0.034 0.024 Sex 0.216 0.238 0.386 0.747 0.315 Log (time)a 0.053 0.069 0.456 0.1 0.206 Buffering Age 0.005 0.049 0.916 0.094 0.104 Sex 0.588 1.082 0.590 1.595 2.771 Log (time)a 0.125 0.316 0.696 0.514 0.763 P<0.05, significant difference.
BZregression estimated value; BufferingZbuffering capac-ity; CIZconfidence interval; pH(B)ZpH of stimulated saliva; pH(p)ZpH of dental plaque; pH(P)Z pH of parotid gland; pH(S)ZpH of submandibular gland; pH(total)ZpH of total resting saliva; SEZstandard error; TimeZtime period after radiotherapy.
aThe time period was not normally distributed and so took the logarithmic form.
statistically significant differences were reached between the pretreatment group,<1 year after radiotherapy, and>5 years after radiotherapy groups (Fig. 4G).
Pearson correlation coefficient
As shown inFig. 3, pH(p) had a positive linear correlation with pH(P), pH(S), and pH(total). Statistically significant differences were found between pH(p) and pH(S), and with pH(total) respectively.
Discussion
Dysfunctions due to radiosensitivities of salivary glands might be differentiated into the early radiation event to
alter cell signal transduction and the late radiation expo-sure to damage acinar progenitor cells in stem cells niche.14e16 Therefore we investigated salivary gland
func-tion changes of HCN patients in different time-intervals after radiotherapy. In the repeated measurement group, individual difference can be excluded because baseline data are from the same patient before radiotherapy, but patients are not easily kept for a long time. In the single measurement group, data from more patients for a longer time after radiotherapy can be easily collected, but inter-individual variation may interfere with results because baseline data are from other normal patients. Many arti-cles17,18indicated that there were relatively large interin-dividual differences with respect to salivary functional changes, which was the reason why we performed
Figure 2 Salivary flow rate was analyzed by a mixed model in the repeat measurement group. Salivary flow rate was 7.18 before
radiotherapy. It decreased steeply to 2.71 (P<0.0001) at 1 month after radiotherapy and to the lowest 1.5 at 2 months after radiotherapy. Even though it increased to around 3.5 10e12 months after radiotherapy, it still could not return to the original level.
Figure 3 Pearson correlation coefficients indicated that pH(P), pH(S), and pH(total) had a statistically significant positive
correlation with pH(p). The correlation coefficient of pH(p) with pH(S) was 0.66030 (P<0.05). The correlation coefficient of pH(p) with pH(total) was 0.81178 (P < 0.05). pH(p)Z pH of dental plaque; pH(P) Z pH of parotid gland saliva; pH(S) Z pH of submaxillary gland; pH(total)ZpH of total resting saliva.
consecutive repeated measurements to figure out more accurate data. In our results, salivary flow rate decreased steeply from 7.18 to 2.71 (P < 0.0001) 1- month after radiotherapy and it could not return to the original level
(Fig. 2). It was also reported that salivary flow rate reduced 50e70% after radiotherapy.18 According to Blanco et al,19
salivary flow rate recovered from 2.15 to 3.15 (6e12 months after radiotherapy), which was consistent with
Figure 4 Concerning the influence of time-period, four groups: pretreatment, <1 year after radiotherapy, 1e5 years after
radiotherapy, and>5 years after radiotherapy were analyzed. (Details are demonstrated inTable S3); (A) pH(P) in each group was 6.60, 6.24, 6.27, and 6.40 respectively, and there were no significant differences in all groups; (B) pH(S) in each group was 6.88, 6.49, 6.63, and 6.68 respectively, and there were no significant differences; (C) pH(total) in each group was 6.93, 6.24, 6.54, and 6.59 respectively, and statistically significant difference was reached between pretreatment and<1 year after radiotherapy; (D) pH(B) in each group was 7.6, 7.16, 7.35, and 6.97 respectively, and statistically significant differences were reached between the pre-treatment group,<1 year after radiotherapy group and>5 years after radiotherapy group; (E) pH(p) in each group was 6.69, 6.53, 6.57, and 6.70 respectively, and there were no significant differences in all groups; (F) flow rate in each group was 7.18, 2.19, 3.78, and 1.47 respectively, and the latter three groups showed significant differences with the pretreatment group; (G) buffering ca-pacity score of each group was 11, 7.94, 10.11, and 8.46 respectively, and statistically significant differences were reached between pretreatment group,<1 year after radiotherapy and>5 years after radiotherapy groups.
our results (from 2.19 to 3.5). Besides, Mo¨ller et al20 also
reported that flow rate would slowly recover 4-months after radiotherapy but cannot return to the original level. From the results of the single measurement group, age, sex, and time-interval after radiotherapy were all not sig-nificant predictor factors for salivary flow rate. Most arti-cles only reported the data of total saliva or stimulated parotid gland saliva.21We further surveyed different types
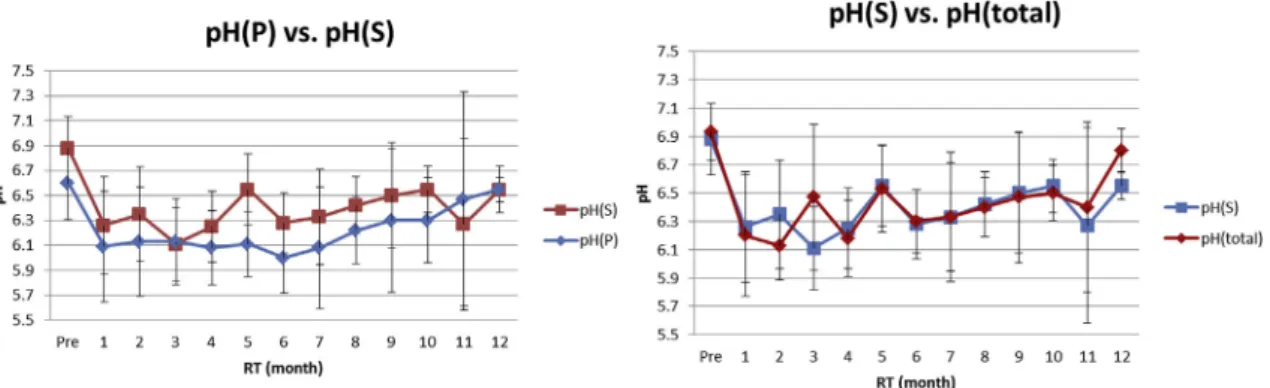
of saliva. Traditionally, the Lashley cup was put into the Stenson’s duct opening for parotid gland saliva and micro-pipette was put in the Wharton’s duct opening for sub-maxillary gland saliva collection. The acid base titrations, pH test strips, and handheld portable pH meters were mentioned for pH measurement,22e24whereas the Modified Ericsson method, Dentobuff method, and Strip method were mentioned for buffering capacity.25e27 We used the GC Saliva-Check Buffer kit for its advantages of non-invasiveness, simplicity, and elegance.28 For patients who have fragile buccal mucossa, it is very important to collect their saliva gently. The advantages of this kit are ease of use, direct chair-side testing, simple symbols for tracking results, and adjunctives for caries risk assessment. How-ever, it does not include bacterial testing and caries-risk predictability. To keep following patients who experi-enced radiotherapy for a long time, treating them gently and carefully was very important. From our results, pH(P), pH(S), and pH(total) all declined steeply at 1 month after radiotherapy, which was the same tendency with our sali-vary flow rate results. However, pH of saliva could recover back to near the original level (Fig. 1AeC). The high cor-relation of salivary flow rate and pH (R Z 0.71) could explain our results.20 Besides, the value and tendency of pH(total) were more similar to pH(S) than pH(P) (Fig. 5). It might be because the total saliva wasw65e80% composed of saliva from submaxillary and sublingual glands.8
How-ever, pH(P) was overall lower than pH(S) and pH(total), and pH(P) also later recovered back until 6 months after radiotherapy. This might be because serous acinar cells in parotid glands are more easily damaged by radiotherapy than mucous acinar cells in submaxillary glands.11,29 The
lower flow rate of the parotid gland might also lead to its low pH value. Some articles indicated that salivary acinar and duct cells deteriorated then the secretion HCO3 was
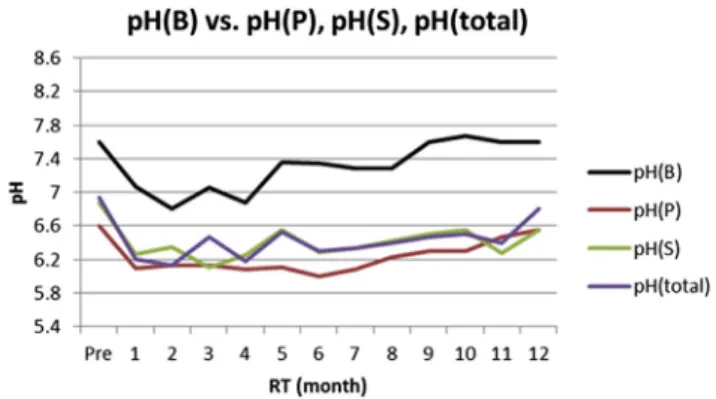
reduced.4,21,30 Therefore, we hypothesized that the low saliva pH was due to accumulated acidic plaque which could not be neutralized by bicarbonate. Our results showed that pH(p) was higher than pH(P) and only slightly lower than pH(total) and pH(S) before radiotherapy, which means that the parotid gland was damaged more easily than the submaxillary gland. We also found that pH(p) was even higher than pH(total) and pH(S) for 1 year after radiotherapy (Fig. 6), which indicated that after a long time the buffering capacity of saliva was changed. It was diffi-cult to prove our hypothesis. Because the pH of dental plaque was affected by complicated multifactors,8 more accurate pH measuring methods shall be performed to further examine our hypothesis. Our results also indicated that the pH of stimulated saliva, pH(B), was much higher than pH(P), pH(S), and pH(total) at every time point (Fig. 7). This might be because the bicarbonate was mostly produced by parotid gland into stimulated saliva.31
Ac-cording to our results, to enhance stimulated saliva secre-tion would be very useful in oral hygiene improvements for
Figure 5 The value and tendency of pH(total) were more similar to pH(S) than pH(P). The lowest pH(P) was measured 6 months
after radiotherapy whereas the lowest pH(S) and pH(total) were both at 3 months after radiotherapy. The pH(P) was always lower than pH(S) whereas pH(S) was almost the same as pH(total) 1 year after radiotherapy. pH(B)ZpH of stimulated saliva; pH(P)ZpH of parotid gland saliva; pH(S)ZpH of submaxillary gland; pH(total)ZpH of total resting saliva.
Figure 6 The pH(p) was higher than pH(P) and only slightly
lower than pH(total) and pH(S) before radiotherapy. The pH(p) was even higher than pH(total) and pH(S) 1 year after radio-therapy. The change in pH(p) followed a similar tendency as that of pH(total). pH(B)ZpH of stimulated saliva; pH(p)ZpH of dental plaque; pH(P) Z pH of parotid gland saliva; pH(S) Z pH of submaxillary gland; pH(total) Z pH of total resting saliva.
HCN patients after radiotherapy. The buffering capacity was inversely proportional to the caries rate.32Our results indicated that the buffering capacity declined steeply at 1 month after radiotherapy but recovered back partially; whereas Mo¨ller et al20indicated the buffering capacity and flow rate were irreversibly reduced after radiotherapy. Development of radiotherapy from traditional isocentric cobalt-60 into intensity modulated radiation therapy (IMRT) might help to decrease the radiation exposure and provide the possibility of buffering capacity recovery. The appli-cation of IMRT since 2006 in National Taiwan University Hospital might be the reason. During these decades, IMRT is an advanced form of three-dimensional conformal radio-therapy (3D-CRT). It uses the 3D treatment planning capa-bilities, such as computed topography, magnetic resonance imaging, on a slice-by-slice basis as opposed to drawing beam portals on a simulator radiograph. It appears to offer several advantages including a significant reduction in irradiated volume for normal salivary glands. It is antici-pated that this reduction would translate into overall re-ductions in acute and potentially late treatment-related toxicity. According in our results, pH(B) and buffering ca-pacity had a high correlation. As during the period of 4
months after radiotherapy, both pH(B) and buffering ca-pacity were down to low levels, oral hygiene education would be very important (Fig. 8). Finally, according to the results of the single measurement group, the time period after radiotherapy was a significant predictor influencing the pH of submaxillary gland and whole resting saliva, which demonstrated their correlation again. Moreover, although we could not tell that the lower pH of saliva was due to dental plaque, results of Pearson’s correlation co-efficient indicated that pH(P), pH(S), and pH(total) had a statistically significant positive correlation with pH(p) (Fig. 4). To reduce pellicle and plaque accumulation would be important in oral hygiene maintenance for HCN patients after radiotherapy.
Conflicts of interest
The authors have no conflicts of interest relevant to this article.
Acknowledgments
The authors would like to thank the grant support from Min-istry of Science and Technology (MOST 103-2314-B-002-004) and the Core Facility from NTUH Medical Research Center.
Appendix A. Supplementary data
Supplementary data related to this article can be found at http://dx.doi.org/10.1016/j.jds.2015.01.004.
References
1.Lee TF, Chao PJ, Ting HM, et al. Using multivariate regression model with least absolute shrinkage and selection operator (LASSO) to predict the incidence of xerostomia after intensity-modulated radiotherapy for head and neck cancer.PLoS One 2014;9:e89700.
2.Dirix P, Nuyts S, Vander Poorten V, Delaere P, Van den Bogaert W. The influence of xerostomia after radiotherapy on quality of life: results of a questionnaire in head and neck cancer.Support Care Cancer2008;16:171e9.
3.Thoeny HC, De Keyzer F, Claus FG, Sunaert S, Hermans R. Gustatory stimulation changes the apparent diffusion coeffi-cient of salivary glands: initial experience.Radiology2005;235: 629e34.
4.Dreizen S, Brown LR, Handler S, Levy BM. Radiation-induced xerostomia in cancer patients. Effect on salivary and serum electrolytes.Cancer1976;38:273e8.
5.Deasy JO, Moiseenko V, Marks L, Chao KS, Nam J, Eisbruch A. Radiotherapy doseevolume effects on salivary gland function. Int J Radiat Oncol Biol Phys2010;76(3 Suppl. l.):S58e63. 6.Dawes C, Wood CM. The contribution of oral minor mucous
gland secretions to the volume of whole saliva in man.Arch Oral Biol1973;18:337e42.
7.Edgar WM. Saliva and dental health. Clinical implications of saliva: report of a consensus meeting. Br Dent J 1990;169: 96e8.
8.Humphrey SP, Williamson RT. A review of saliva: normal compo-sition, flow, and function.J Prosthet Dent2001;85:162e9. 9.Edgar WM. Saliva: its secretion, composition and functions.Br
Dent J1992;172:305e12.
Figure 7 The pH of stimulated saliva, pH(B), was much
higher than pH(P), pH(S), and pH(total) at every time point. pH(B)ZpH of stimulated saliva; pH(P)ZpH of parotid gland saliva; pH(S)ZpH of submaxillary gland; pH(total) ZpH of total resting saliva.
Figure 8 The pH of stimulated saliva, pH(B), and buffering
capacity had a high correlation. Both pH(B) and buffering ca-pacity were down to low levels during the period of 4 months after radiotherapy, and returned back to normal 10 months after radiotherapy.
10.Dowd FJ. Saliva and dental caries.Dent Clin North Am1999;43: 579e97.
11.Eisbruch A, Ship JA, Kim HM, Ten Haken RK. Partial irradiation of the parotid gland.Semin Radiat Oncol2001;11:234e9. 12.Kho HS, Lee SW, Chung SC, Kim YK. Oral manifestations and
salivary flow rate, pH, and buffer capacity in patients with end-stage renal disease undergoing hemodialysis. Oral Surg Oral Med Oral Pathol Oral Radiol Endod1999;88:316e9. 13.Ishii T, Yoshida S. Methods of oral health check-upebasic
methods and application of dental health surveys by WHO. Shikai Tenbo1978;52:343e53.
14.Konings AW, Coppes RP, Vissink A. On the mechanism of sali-vary gland radiosensitivity.Int J Radiat Oncol Biol Phys2005; 62:1187e94.
15.Konings AW, Faber H, Cotteleer F, Vissink A, Coppes RP. Sec-ondary radiation damage as the main cause for unexpected volume effects: a histopathologic study of the parotid gland. Int J Radiat Oncol Biol Phys2006;64:98e105.
16.Jeong J, Baek H, Kim YJ, et al. Human salivary gland stem cells ameliorate hyposalivation of radiation-damaged rat salivary glands.Exp Mol Med2013;45:e58.
17.Leslie MD, Dische S. Parotid gland function following acceler-ated and conventionally fractionacceler-ated radiotherapy.Radiother Oncol1991;22:133e9.
18.Franzen L, Funegard U, Ericson T, Henriksson R. Parotid gland function during and following radiotherapy of malignancies in the head and neck. A consecutive study of salivary flow and patient discomfort.Eur J Cancer1992;28:457e62.
19.Blanco AI, Chao KS, El Naqa I, et al. Dose-volume modeling of salivary function in patients with head-and-neck cancer receiving radiotherapy.Int J Radiat Oncol Biol Phys2005;62: 1055e69.
20.Mo¨ller P, Perrier M, Ozsahin M, Monnier P. A prospective study of salivary gland function in patients undergoing radiotherapy for squamous cell carcinoma of the oropharynx.Oral Surg Oral Med Oral Pathol Oral Radiol Endod2004;97:173e89.
21.Marks JE, Davis CC, Gottsman VL, Purdy JE, Lee F. The effects of radiation of parotid salivary function.Int J Radiat Oncol Biol Phys1981;7:1013e9.
22. Moritsuka M, Kitasako Y, Burrow MF, Ikeda M, Tagami J, Nomura S. Quantitative assessment for stimulated saliva flow rate and buffering capacity in relation to different ages.J Dent 2006;34:716e20.
23. Karami Nogourani M, Janghorbani M, Kowsari Isfahan R, Hos-seini Beheshti M. Effects of chewing different flavored gums on salivary flow rate and pH.Int J Dent2012;2012:569327. 24. Cogulu D, Sabah E, Kutukculer N, Ozkinay F. Evaluation of the
relationship between caries indices and salivary secretory IgA, salivary pH, buffering capacity and flow rate in children with Down’s syndrome.Arch Oral Biol2006;51:23e8.
25. Bratthall D, Hager B. Simple method for the evaluation of the buffering action and secretory velocity of saliva. Tand-lakartidningen1977;69:677e8.
26. Wikner S, Nedlich U. A clinical evaluation of the ability of the Dentobuff method to estimate buffer capacity of saliva.Swed Dent J1985;9:45e7.
27. Kitasako Y, Moritsuka M, Foxton RM, Ikeda M, Tagami J, Nomura S. Simplified and quantitative saliva buffer capacity test using a hand-held pH meter.Am J Dent2005;18:147e50. 28. Carounanidy U, Satyanarayanan R, Velmurugan A. Use of an
aqueous extract of Terminalia chebula as an anticaries agent: a clinical study.Indian J Dent Res2007;18:152e6.
29. Someya M, Sakata K, Nagakura H, Nakata K, Oouchi A, Hareyama M. The changes in irradiated salivary gland function of patients with head and neck tumors treated with radio-therapy.Jpn J Clin Oncol2003;33:336e40.
30. Valdez IH, Atkinson JC, Ship JA, Fox PC. Major salivary gland function in patients with radiation-induced xerostomia: flow rates and sialochemistry.Int J Radiat Oncol Biol Phys1993;25: 41e7.
31. Li Y, Taylor JM, Ten Haken RK, Eisbruch A. The impact of dose on parotid salivary recovery in head and neck cancer patients treated with radiation therapy. Int J Radiat Oncol Biol Phys 2007;67:660e9.
32. Dreizen S, Mann AW, Cline JK, et al. The buffer capacity of saliva as a measure of dental caries activity.J Dent Res1946; 25:213e22.