CIEP PAPER 2014 | 03
SUNSET OR SUNRISE?
ELECTRICITY BUSINESS IN NORTHWEST EUROPE
PIER STAPERSMA
VISITING ADDRESS Clingendael 12 2597 VH The Hague The Netherlands POSTAL ADDRESS P.O. Box 93080 2509 AB The Hague The Netherlands TEL +31 (0)70 - 374 66 16 www.clingendaelenergy.com ciep@clingendaelenergy.comCIEP is affiliated to the Netherlands Institute of International Relations ‘Clingendael’. CIEP acts as an independent forum for governments, non-governmental organizations, the private sector, media, politicians and all others interested in changes and
developments in the energy sector.
CIEP organizes lectures, seminars, conferences and roundtable discussions. In addition, CIEP members of staff lecture in a variety of courses and training programmes. CIEP’s research, training and activities focus on two themes:
• European energy market developments and policy-making; • Geopolitics of energy policy-making and energy markets
CIEP is endorsed by the Dutch Ministry of Economic Affairs, the Dutch Ministry of Foreign Affairs, the Dutch Ministry of Infrastructure and the Environment, BP Europe SE- BP Nederland, Delta N.V., GDF SUEZ Energie Nederland N.V., GDF SUEZ E&P Nederland B.V., Eneco, EBN B.V., Essent N.V., Esso Nederland B.V., GasTerra B.V., N.V. Nederlandse Gasunie, Heerema Marine Contractors Nederland B.V., ING Commercial Banking, Nederlandse Aardolie Maatschappij B.V., N.V. NUON Energy, TenneT TSO B.V., Oranje-Nassau Energie B.V., Havenbedrijf Rotterdam N.V., Shell Nederland B.V., TAQA Energy B.V.,Total E&P Nederland B.V., Koninklijke Vopak N.V. and Wintershall Nederland B.V..
CIEP Energy Papers are published on the CIEP website: www.clingendaelenergy.com/ publications
TITLE
Sunset or Sunrise?
SUBTITLE
Electricity Business in Northwest Europe
AUTHOR Pier Stapersma
COPYRIGHT
© 2014 Clingendael International Energy Programme (CIEP)
NUMBER 2014 | 03
EDITOR
Deborah Sherwood
DESIGN
Studio Maartje de Sonnaville
PUBLISHED BY
Clingendael International Energy Programme (CIEP)
ADDRESS
Clingendael 7, 2597 VH The Hague, The Netherlands P.O. Box 93080, 2509 AB The Hague, The Netherlands
TELEPHONE +31 70 374 66 16 TELEFAX +31 70 374 66 88 EMAIL ciep@clingendaelenergy.com WEBSITE www.clingendaelenergy.com
SUNSET OR SUNRISE?
ELECTRICITY BUSINESS
IN NORTHWEST EUROPE
PIER STAPERSMA7
TABLE OF CONTENTS
LIST OF ABBREVIATIONS EXECUTIVE SUMMARY
1 THE DECARBONIZATION AGENDA FOR ELECTRICITY Electricity Markets
Present Power Market Environment
2 ALTERED BUSINESS LOGIC
The Business Case for Conventional Generation Building a Business on Subsidies?
From User to Consumer to Client Towards a Service-Oriented View?
3 SHIFTING BUSINESS MODELS The Revitalized Electric Utility
The Large-scale RES Generator The New Electricity Service Platform
The Default Option: The State-Sponsored Electric Utility
CONCLUSION APPENDIX A – FIGURES APPENDIX B – TABLES 9 11 13 14 15 19 21 23 25 27 31 33 34 37 39 43 45 51
9
LIST OF ABBREVIATIONS
CAPEX Capital Expenses
CCGT Combined Cycle Gas Turbine
CRM Capacity Remuneration Mechanism
DSO Distribution System Operator
EU European Union
EU ETS European Union Emission Trading Scheme
EUA European Union Allowance
GW Gigawatt
ICT Information and Communication Technology
kW Kilowatt
kWh Kilowatt-hour
MW Megawatt
MWh Megawatt-hour
RES Renewable Energy Sources
PV Photovoltaic
TSO Transmission System Operator
TWh Terawatt-hour
UK United Kingdom
11
EXECUTIVE SUMMARY
The decarbonization agenda presently shapes business activity in the Northwest European electricity sector. With the embrace of decarbonization targets, the need for changes to the market design as well as for new utility business models is increasingly recognized. This report reflects on recent developments in the electricity sector and explores how the business logic and business models of incumbents are affected. It aims to contribute to the industry-wide process of rethinking market designs as well as utility business models, by providing insights into the complexities and challenges associated with it.
There have been transitions in the electricity mix in the past, most notably in national mixes. The process that is regularly referred to as transition may in fact be never-ending, as it is shaped by continuously changing societal demands on the electricity system. This is relevant for business in the electricity sector, because electricity markets are often strongly regulated markets.
As a result of the introduction of variable generation from Renewable Energy Resources (RES), the business logic for conventional generation has changed. With the increase of overall investment risks, the relative advantage of less capital-intensive new-built generation plants, such as gas-fired power plants, over more capital-intensive alternatives emerges. In the current market this seems counter-intuitive because many existing gas-fired power stations are being mothballed, while new coal-fired stations are coming on stream. Furthermore, subsidies as an indispensable driver for investment in RES can be expected to continue, challenging the major utilities to consider such income streams as part of their business models. Subsidy-averseness has implications for business model preferences. Apart from changes in supply, electricity consumers have become a heterogeneous group of electricity system clients who can seek services from other parties to make their activities work. As a consequence, the logic of having a vertically integrated business model in the Northwest European electricity sector could become weaker, especially given the currently stressed balance sheets among electric utilities.
Strategic responses can be expected to differ from one utility to another. The general picture that emerges is that generation-based business models in Northwest Europe have essentially become riskier, while there is a growing need for more services.
12 SUNSET OR SUNRISE? ENERGY PAPER
Consequently, the emphasis can be expected to shift towards service-oriented business models. The implications of such a shift are yet unclear. What is clear is that electricity generation and investment in new generation capacity continues to be needed and that a business model can only be successful as long as it fits in the electricity market design; here lies a shared responsibility for the public and private sectors.
Three high-level business models are sketched in this paper, and one ‘alternative outcome’. The latter outcome is not so much the result of shifting business model preferences, but rather, it could emerge from the threat of a crucial utility default. The 2002 events surrounding British Energy in the United Kingdom are illustrative. If an electric utility’s business model collapses while its generation assets are essential for the electricity system to function, the state may have to come to rescue.
Last, it is important to stress that decarbonization policies cannot be based solely upon the single component of introducing new supplies and technologies to the market; decarbonization policies should also provide a framework for assets and infrastructures that are vital for system adequacy and security of electricity supplies during the transition phase.
13
1 THE DECARBONIZATION
AGENDA FOR ELECTRICITY
Transitions in the power sector have occurred before. In that respect, the current decarbonization agenda is not unique. In the United Kingdom (UK), the dash-for-gas
greatly changed the power generation mix during the 1990s1. In France, the Mesmer
plan, which implied a rapid introduction of nuclear power, effectively decarbonized the power sector, with carbon intensity falling some 80% over a 10-15 years period, illustrated in Figure 1. Presently, the power generation capacity mix is changing fast in the United States (US), with gas-fired capacity additions being dominant over
coal-fired additions2, which could be the start of a dash-for-gash as a result of
abundant domestic (unconventional) gas supplies.
FIGURE 1. CARBON INTENSITY OF ELECTRICITY GENERATION (GR/KWH)3
1 UK Energy Research Centre (2012), Case Study 9 - The Development of CCGT and the 'Dash for Gas' in the UK Power Industry (1987-2000), www.ukerc.ac.uk/support/tiki-download_file.php?fileId=2325, retrieved on 20 March 2014. See also Figure 15 in Appendix A.
2 U.S. Energy Information Administration (2013), Annual Energy Outlook 2013 - With Projections to 2040, http://www.eia. gov/forecasts/ieo/pdf/0484(2013).pdf, retrieved 21 January 2014. See also Figure 16 in Appendix A.
3 Ministère de l’Écologie, du Développement durable et de l’Énergie (2012), Chiffres clés du Climat – France et Monde – Edition 2013, http://www.developpement-durable.gouv.fr/IMG/pdf/Rep_-_Chiffres_cles_du_climat.pdf, retrieved on 21 January 2014.
6
The Decarbonization Agenda for Electricity
Transitions in the power sector have occurred before. In that respect, the current decarbonization agenda is not unique. In the United Kingdom (UK), the dash-‐for-‐gas greatly changed the power generation mix during the 1990s1. In France, the Mesmer plan, which implied a rapid introduction of nuclear power, effectively decarbonized the power sector, with carbon intensity falling some 80% over a 10-‐15 years period, illustrated in Figure 1. Presently, the power generation capacity mix is changing fast in the United States (US), with gas-‐fired capacity additions being dominant over coal-‐ fired additions2, which could be the start of a dash-‐for-‐gash as a result of abundant domestic (unconventional) gas supplies.
Figure 1. Carbon intensity of electricity generation (gr/kWh)3
The European-‐wide decarbonization agenda has features in common with some of these examples, but it also differs greatly. It is strongly policy-‐driven, like the Mesmer plan in France4. Very different from the Mesmer plan, however, is that the current changes are taking place in liberalized markets. Moreover, the present transformation of the European electricity system does not focus solely on decarbonization, but includes additional objectives, most notably the introduction of generation from variable Renewable Energy Sources (RES). In this respect, consider Figure 2 for a range of decarbonization scenarios put forward by the European Commission, which all include generation from variable RES. This leads to a mix of features that can be considered challenging: the European
1 UK Energy Research Centre (2012), Case Study 9 -‐ The Development of CCGT and the 'Dash for Gas' in the UK
Power Industry (1987-‐2000), www.ukerc.ac.uk/support/tiki-‐download_file.php?fileId=2325, retrieved on 20 March 2014. See also Figure 17 in Appendix A.
2 U.S. Energy Information Administration (2013), Annual Energy Outlook 2013 -‐ With Projections to 2040,
http://www.eia.gov/forecasts/ieo/pdf/0484(2013).pdf, retrieved 21 January 2014. See also Figure 18 in Appendix A.
3 Ministère de l’Écologie, du Développement durable et de l’Énergie (2012), Chiffres clés du Climat – France et
Monde – Edition 2013, http://www.developpement-‐durable.gouv.fr/IMG/pdf/Rep_-‐ _Chiffres_cles_du_climat.pdf, retrieved on 21 January 2014.
4 AEN-‐NEA (2011), The Financing of Nuclear Power Plants (p. 60-‐63), http://www.oecd-‐
14 SUNSET OR SUNRISE? ENERGY PAPER
The European-wide decarbonization agenda has features in common with some of these examples, but it also differs greatly. It is strongly policy-driven, like the Mesmer
plan in France4. Very different from the Mesmer plan, however, is that the current
changes are taking place in liberalized markets. Moreover, the present transformation of the European electricity system does not focus solely on decarbonization, but includes additional objectives, most notably the introduction of generation from variable Renewable Energy Sources (RES). In this respect, consider Figure 2 for a range of decarbonization scenarios put forward by the European Commission, which all include generation from variable RES. This leads to a mix of features that can be considered challenging: the European decarbonization process is a policy-driven transformation of the electricity system in liberalized markets, in which electricity generation from (variable) RES plays an important role.
FIGURE 2. ELECTRICITY GENERATION MIX IN 2050 IN VARIOUS EC DECARBONIZATION SCENARIOS5
ELECTRICITY MARKETS
The power market can hardly be considered a natural market, because of the very nature of the product that is produced, traded, and consumed, i.e. a megawatt-hour (MWh) which cannot be put in a barrel or liquefied and stored in a tank. The power market and its functioning is the result of a set of rules that is agreed upon by a
4 AEN-NEA (2011), The Financing of Nuclear Power Plants (p. 60-63), http://www.oecd-nea.org/ndd/reports/2009/ financing-plants.pdf, retrieved on 21 January 2014.
5 CIEP analysis of data provided by the European Commission (2011), Energy Roadmap 2050 - Impact Assessment and Scenario Analysis, http://ec.europa.eu/energy/energy2020/roadmap/doc/roadmap2050_ia_20120430_en.pdf, retrieved on 21 January 2014.
7
decarbonization process is a policy-‐driven transformation of the electricity system in liberalized
markets, in which electricity generation from (variable) RES plays an important role.
Figure 2. Electricity generation mix in 2050 in various EC decarbonization scenarios5
Electricity Markets
The power market can hardly be considered a natural market, because of the very nature of the
product that is produced, traded, and consumed, i.e. a megawatt-‐hour (MWh) which cannot be put
in a barrel or liquefied and stored in a tank. The power market and its functioning is the result of a
set of rules that is agreed upon by a range of actors involved. These rules determine what is traded,
what revenue streams exists for generators, and what costs they incur. Policy makers – past, present
and future – strongly influence how a business case can work or not work for the actors involved. The
‘quality’ as well as the ‘price’ of the power supply system is a concern here. On the one hand, the
(macro-‐economic) cost of supply (price) is a concern for economic and industrial policy as well as for
employment reasons. On the other hand, quality is an issue, as the security of electricity supply must
be guaranteed, as well as safety and a limited environmental footprint.
In recent years the views on what constitutes an acceptable quality of the electricity system have
been gradually changing. Increasingly, in addition to the reliability requirement, this entails
generation from RES, most notably from solar and wind resources. At the same time coal-‐fired power
plants are clearly less favoured, and although views on nuclear power have been mixed in recent
years, the Fukushima incident moved nuclear power further to the background, at least in some
markets. It is this context that presently guides the evolution of the electricity supply system and
power market regulation and policies.
Present Power Market Environment
Increasingly, public and private actors question the relevance of the current market coordination
mechanism for the envisioned decarbonization process; they do this under the auspices of a new
5 CIEP analysis of data provided by the European Commission (2011), Energy Roadmap 2050 -‐ Impact Assessment and Scenario Analysis,
http://ec.europa.eu/energy/energy2020/roadmap/doc/roadmap2050_ia_20120430_en.pdf, retrieved on 21 January 2014.
15
range of actors involved. These rules determine what is traded, what revenue streams exist for generators, and what costs they incur. Policy makers – past, present and future – strongly influence how a business case can work or not work for the actors involved. The ‘quality’ as well as the ‘price’ of the power supply system is a concern here. On the one hand, the (macro-economic) cost of supply (price) is a concern for economic and industrial policy as well as for employment reasons. On the other hand, quality is an issue, as the security of electricity supply must be guaranteed, as well as safety and a limited environmental footprint.
In recent years the views on what constitutes an acceptable quality of the electricity system have been gradually changing. Increasingly, in addition to the reliability requirement, this entails generation from RES, most notably from solar and wind resources. At the same time coal-fired power plants are clearly less favoured, and although views on nuclear power have been mixed in recent years, the Fukushima incident moved nuclear power further to the background, at least in some markets. It is this context that presently guides the evolution of the electricity supply system and power market regulation and policies.
PRESENT POWER MARKET ENVIRONMENT
Increasingly, public and private actors question the relevance of the current market coordination mechanism for the envisioned decarbonization process; they do this
under the auspices of a new market design6. What constitutes the market design is
not always clear, but at least three aspects of the present-day utility business environment can be considered central to it, all of which are heavily debated: (1) the European Union Emission Trading Scheme (EU ETS), (2) renewable support schemes, and (3) capacity mechanisms (as opposed to the absence of such mechanisms, resulting in a market situation frequently referred to as the ‘energy-only market’). These three aspects must be considered in the context of the European Union (EU) internal energy market.
6 For instance, IEA (2012), Securing Power during the Transition, http://www.iea.org/publications/freepublications/ publication/name,33897,en.html, retrieved on 27 January 2014; Electricity Market Reforms in the UK, information available at https://www.gov.uk/government/policies/maintaining-uk-energy-security--2/supporting-pages/electricity-market-reform; UMSGroup and E-Bridge (2013), Towards a Sustainable Market Model, http://www.umsgroup.com/ documents/viewpoints/EndReportMarketModel_final14052013.pdf, retrieved on 20 March 2014; Oxford Institute for Energy Studies (2012), Decarbonization of the Electricity Industry - is there still a place for markets, https://www. oxfordenergy.org/2012/11/decarbonisation-of-the-electricity-sector-is-there-still-a-place-for-markets, retrieved on 27 January 2014; etc.
16 SUNSET OR SUNRISE? ENERGY PAPER
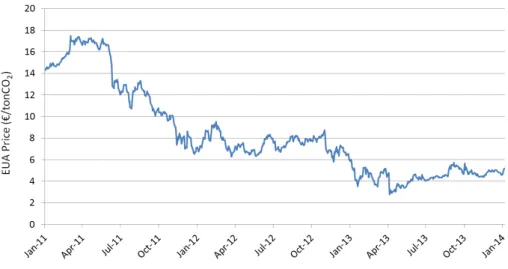
FIGURE 3. EU EMISSION ALLOWANCE (EUA) PRICES BETWEEN JANUARY 2011 AND JANUARY 2014 (EUA FUTURES)7
In contrast to command-and-control policy measures, the EU ETS is a market-based
environmental policy instrument, as is an environmental tax or levy8. However, while
a tax or levy is a price-based instrument, the EU ETS is a quantity-based instrument. As such, the quantity of emissions is fixed by setting the amount of emission allowances in the market, which in turn follows from long-term emission reduction
objectives (e.g. 20-20-20)9; the price is not fixed and is merely a result of supply/
demand balances. From this perspective, the EU ETS functions as it is supposed to, i.e. capping carbon emissions along a linearly declining pathway, defined by policy makers.
Now, several years down the road, it turns out that demand/supply balances are not tight. The availability of emission allowances well exceeds demand (see Figure 17 in
Appendix A)10, resulting in low prices for emission allowances in the carbon-trading
scheme (Figure 3). In principle this should not be an issue, since emissions are capped by the very nature of the policy instrument. But it does have relevant side
7 Data retrieved from http://www.theice.com
8 Recommended further reading: Keohane, N. O., & Olmstead, S. M. (2007), Markets & The Environment. Washington, D. C.: Island Press.
9 As Article 9 of Directive 2003/87/EC (as amended by Directive 2009/29/EC) reads: ‘The Community-wide quantity of allowances issued each year starting in 2013 shall decrease in a linear manner beginning from the mid-point of the period from 2008 to 2012. The quantity shall decrease by a linear factor of 1,74 % compared to the average annual total quantity of allowances issued by Member States in accordance with the Commission Decisions on their national allocation plans for the period from 2008 to 2012. […]’
10 European Commission (2012), The State of the European Carbon Market in 2012, http://ec.europa.eu/clima/policies/ets/ reform/docs/com_2012_652_en.pdf, retrieved on 21 January 2014.
17
consequences. That is to say, at present it provides little incentive for market actors to take measures to (further) reduce carbon emissions. Hence, there is currently much discussion as to whether policy makers and regulators should intervene, in ways ranging from soft measures like ‘back-loading’, to price controls, to setting a
more stringent reduction pathway and thereby creating more scarcity in the system11.
Clearly, such discourse leads to uncertainty regarding the way forward.
At the same time, doubts are emerging as to whether an energy-only market (wholesale market) can provide for electricity system adequacy while also introducing
variable RES12. In that respect, the introduction of capacity remuneration mechanisms
(CRMs) is on the agenda of many national policy makers13. Such CRMs could create
a new source of revenues for generators through the sale of available generation capacity (megawatts, MW), but it would have consequences for the traditional source of revenues (i.e. energy sales, MWh). As such, two central characteristics of the EU internal market for electricity, i.e. the market-based EU ETS as well as the energy-only market paradigm, are being heavily debated. The 2012 CIEP report
‘Capacity Mechanisms in Northwest Europe’ took a deep dive into this discussion14.
In all, the nature of this market-based segment of European electricity supply raises much discussion. At the same time, this very segment is itself losing prominence since an increasing amount of investments in generation projects is not driven by the combined construct of wholesale markets and EU ETS, but by renewable support
schemes, which vary greatly from one member state to another15. This clearly has
implications for the functioning of the market and hence for the degree to which the present market design is optimal for delivering an electricity supply system that meets the costs and quality requirements set by society at large.
11 A public debate was initiated by the European Commission about options for structural reform of the EU ETS. See http:// ec.europa.eu/clima/policies/ets/reform/index_en.htm, retrieved on 20 March 2014.
12 A relevant study is provided by the IEA (2012), Securing Power during the Transition, http://www.iea.org/publications/ insights/SecuringPowerTransition_Secondeedition_WEB.pdf, retrieved on 21 January 2014.
13 See Figure 7 in publication by Eurelectric (2012), Powering Investments - Challenges for the Liberalized Electricity Sector, http://www.eurelectric.org/media/68619/powering_investments-_findings_and_recommendations-lr-2012-101-0003-01-e.pdf, retrieved 21 January 2014.
14 CIEP (2012), Capacity Mechanisms in Northwestern Europe, http://www.clingendaelenergy.com/publications/publication/ capacity-mechanisms-in-northwest-europe, retrieved 3 March 2014.
15 An overview can be found in the Fraunhofer-ISI/Energy Economics Group/ Ecofys (2012) publication: Recent Developments of Feed-in Systems in the EU, http://www.feed-in-cooperation.org/wDefault_7/download-files/research/101105_feed-in_evaluation_update-January-2012_draft_final_ISI.pdf, retrieved on 21 January 2014.
19
2 ALTERED BUSINESS
LOGIC
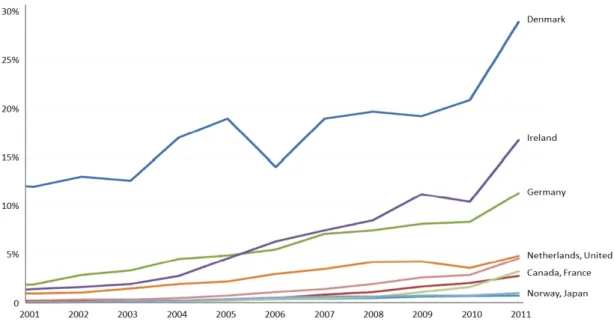
The introduction of substantial amounts of variable power generation changes the functioning of electricity markets. In recent years we have already seen an increase in power generation from variable RES in Northwest Europe (i.e. generation from wind
and solar capacity16), incentivized by German feed-in tariffs, Dutch feed-in premiums,
Belgian and UK quota obligations, etc. (Figure 4).
FIGURE 4. VARIABLE RES-E GENERATION AS A SHARE OF TOTAL GENERATION (IEA, 2013)17
Even if the renewable focus in electricity policy decreases post-2020, for instance as
a result of non-binding national RES targets for 203018, the effects of what has
happened in recent years and what can firmly be expected to happen in the coming
16 For wind, see The European Wind Energy Association (2013), Wind in Power - 2012 European Statistics, http://www.ewea. org/statistics/european, retrieved on 21 January 2014; for solar, see European Photovoltaic Industry Association (2013), Global Market Outlook for Photovoltaics 2013-2017, http://www.epia.org/news/publications/global-market-outlook-for-photovoltaics-2013-2017, retrieved on 21 January 2014.
17 IEA (2013): RES-E-NEXT, Next Generation of RES-E Policy Instruments, http://iea-retd.org/archives/publications/res-e-next, retrieved 27 January 2014.
18 European Commission (EC) press release of 22 January 2014, http://europa.eu/rapid/press-release_IP-14-54_en.htm, retrieved on 27 January 2014.
10
Altered Business Logic
The introduction of substantial amounts of variable power generation changes the functioning of
electricity markets. In recent years we have already seen an increase in power generation from
variable RES in Northwest Europe (i.e. generation from wind and solar capacity
16), incentivized by
German feed-‐in tariffs, Dutch feed-‐in premiums, Belgian and UK quota obligations, etc. (Figure 4).
Figure 4. Variable RES-‐E Generation as a share of total generation (IEA, 2013)17
Even if the renewable focus in electricity policy decreases post-‐2020, for instance as a result of non-‐
binding national RES targets for 2030
18, the effects of what has happened in recent years and what
can firmly be expected to happen in the coming years will have consequences for the power markets
in Northwest Europe for years to come (see Figure 22, Figure 23, and Table 1 in Appendix A).
Although annual generation figures from solar and wind capacity may be modest, the variable nature
of generation implies that generation from these sources is substantial and significant at times.
Consider Figure 5 for solar photovoltaic (solar PV) in Germany and notice the continuous change in
the actual utilization of the installed solar PV capacity (which is generally obscured by graphs showing
annual production volumes)
19. Some days utilization of the installed solar PV capacity is close to 24
GW, while on other days, most notably in the darker winter months, utilization is only several GWs.
16 For wind, see The European Wind Energy Association (2013), Wind in Power -‐ 2012 European Statistics,
http://www.ewea.org/statistics/european, retrieved on 21 January 2014; for solar, see European Photovoltaic Industry Association (2013), Global Market Outlook for Photovoltaics 2013-‐2017,
http://www.epia.org/news/publications/global-‐market-‐outlook-‐for-‐photovoltaics-‐2013-‐2017, retrieved on 21 January 2014.
17 IEA (2013): RES-‐E-‐NEXT, Next Generation of RES-‐E Policy Instruments, http://iea-‐
retd.org/archives/publications/res-‐e-‐next, retrieved 27 January 2014.
18 European Commission (EC) press release of 22 January 2014, http://europa.eu/rapid/press-‐release_IP-‐14-‐
54_en.htm, retrieved on 27 January 2014.
19 Illustration from slide 40 in Fraunhofer (2014), Electricity Production From Solar And Wind In Germany in
2013, http://www.ise.fraunhofer.de/en/downloads-‐englisch/pdf-‐files-‐englisch/news/electricity-‐production-‐ from-‐solar-‐and-‐wind-‐in-‐germany-‐in-‐2013.pdf, retrieved on 21 January 2014.
20 SUNSET OR SUNRISE? ENERGY PAPER
years will have consequences for the power markets in Northwest Europe for years to come (see Figures 20 and 21 in Appendix A, and Table 1 in Appendix B). Although annual generation figures from solar and wind capacity may be modest, the variable nature of generation implies that generation from these sources is substantial and significant at times.
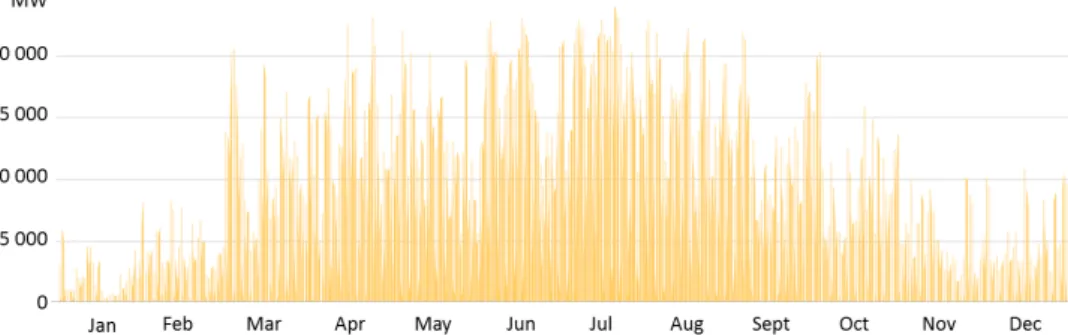
Consider Figure 5 for solar photovoltaic (solar PV) in Germany and notice the continuous change in the actual utilization of the installed solar PV capacity (which
is generally obscured by graphs showing annual production volumes)19. Some days
utilization of the installed solar PV capacity is close to 24 GW, while on other days, most notably in the darker winter months, utilization is only several GWs. Even on a day when utilization reaches the 24 GW around noon, the following night-time utilization falls back to zero and electricity generation has to come from alternative generating capacity.
FIGURE 5. GENERATION FROM THE INSTALLED SOLAR-PV CAPACITY IN GERMANY IN 201319
Given present numbers and the 2020 targets for European Union member states (see Figure 21 in Appendix A), variable generation can no longer be regarded as an anomaly in the electricity system; rather, it is ‘the new base-load’ around which the rest of the system is assumed to function and to which the rest of the system is supposed to adapt. The main difference with ‘the traditional baseload’, however, is that this base has varying output.
19 Illustration from slide 40 in Fraunhofer (2014), Electricity Production From Solar And Wind In Germany in 2013, http:// www.ise.fraunhofer.de/en/downloads-englisch/pdf-files-englisch/news/electricity-production-from-solar-and-wind-in-germany-in-2013.pdf, retrieved on 21 January 2014.
21
THE BUSINESS CASE FOR CONVENTIONAL GENERATION
One example of changing business logic following from the changing functioning of the electricity market concerns the business case for conventional generation. This is the example being discussed most extensively in the present discourse regarding capacity mechanisms. As is increasingly recognized, the growing amount of variable generation has implications for the number of hours conventional power plants can run.
A less heard but relevant related issue is that the ‘levelized costs of electricity generation’ concept should consequently be treated with caution. This concept incorporates capital expenses, operational expenses, as well as fuel and carbon costs and transposes these onto a per-MWh-basis. It should be avoided, now more than ever, to start such a cost calculation with the (implicit) assumption that a generation technology operates in some sort of green-field situation in which no particular generation mix is installed and there is no competition with other sources. Such an assumption could imply that generation technologies produce according to technical availability, e.g. in the range of 6500 to 8500 hours for gas-fired, coal-fired and nuclear power plants. Levelized costs of electricity calculations could then show that gas-fired, coal-fired, and nuclear generation costs are relatively similar (see, for a recent overview of levelized costs of various generating technologies, Figure 22 in Appendix A).
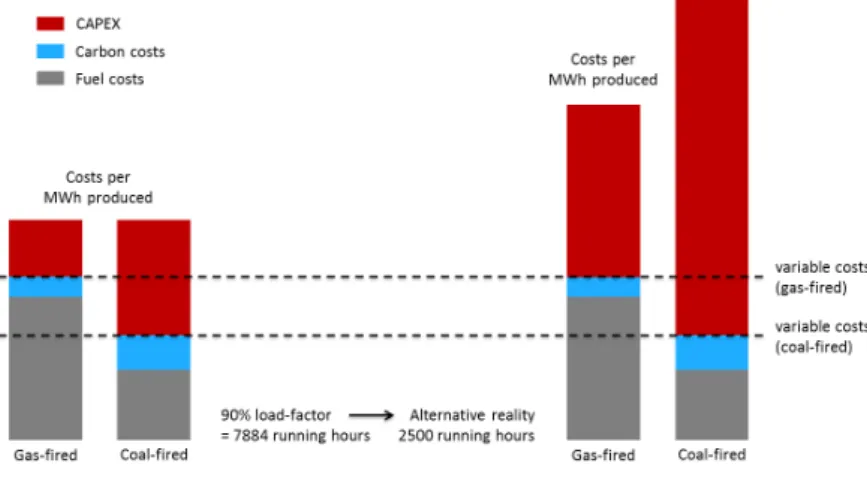
In an electricity supply system in which substantial amounts of variable generation are a given, conventional power plants run substantially fewer hours. The effects on per-MWh-costs differ from one technology to the other, having more severe
implications for capital-intensive technologies than for less capital-intensive ones20,
as is illustrated in Figure 6. This effect was extensively analyzed for gas-fired and
coal-fired power plants in the 2011 CIEP study ‘Wind and Gas’21.
20 Exact cost levels vary with assumptions on fuel prices, carbon price levels, conversion efficiencies, CAPEX levels, costs of capital, economic lifetime of assets, etc. One things stands out, however. If a particular amount of capital expenses is to be earned back over a smaller quantity of product (power produced), then costs per unit (MWh produced) go up. The more capital-intensive a generation technology is, the stronger its effect.
21 CIEP (2011), Wind and Gas. Back-up or Back-out - ‘That is the Question’, http://www.clingendaelenergy.com/publications/ publication/wind-and-gas, retrieved 21 January 2014.
22 SUNSET OR SUNRISE? ENERGY PAPER
FIGURE 6. ILLUSTRATING THE EFFECT OF DECREASING NUMBERS OF RUNNING HOURS FOR CONVENTIONAL NEW-BUILDS20
Overall, generation costs per MWh from conventional sources are increasing in an electricity market that has substantial amounts of variable generation from RES, more so for the more capital-intensive coal-fired builds than for gas-fired new-builds, and even more so for nuclear new-builds that do not operate baseload. As a result, in a market with substantial amounts of variable generation from wind and solar, the technology preference for new-builds is affected.
It is important to stress that this is an investor’s perspective. In contrast, once power plants have been built, variable costs determine which power plants are actually used; at that moment the capital expenses (CAPEX) are sunk costs. Because of lower variable costs, coal-fired power plants outcompete gas-fired plants in the daily operation in present Northwest European power markets (coal-fired power plants
have a more favourable position in the ‘merit order’)22. However, paradoxically, with
increasing amounts of variable generation in the system and decreasing amounts of running hours for conventional plants, such coal-fired power plants can actually be financially underwater, potentially more so than gas-fired generation facilities that do not produce.
22 This article illustrates these dynamics: Financieel Dagblad, 4 March 2013, De schoonste gascentrale van Nederland staat stil, http://fd.nl/economie-politiek/102413-1303/de-schoonste-gascentrale-van-nederland-staat-stil, retrieved on 27 January 2014.
23
While increasing amounts of variable electricity generation seemingly strengthen the business case for gas-fired generation projects relative to coal-fired new builds, this
is not to say that the new environment is an attractive place to invest per se; it has
become riskier, too. In a power market in which wholesale prices follow essentially from the variable costs of the marginal power plant, there is a risk of an increasing misfit between electricity prices and costs-per-MWh-produced (illustrated in Figure 6). This is the base of the discussion on the introduction of CRMs, which, as the argument goes, can decrease the risks for an investor by introducing an alternative revenue stream for generators.
BUILDING A BUSINESS ON SUBSIDIES?
In a similar vein, the concept of levelized costs must also be treated with caution when considering investments in renewable technologies. A blunt way to assess the competitiveness of a generation technology using the concept of levelized costs is to compare the particular cost level with baseload electricity prices in a market. If baseload futures, as traded on electricity exchanges, show prices higher than levelized costs of a particular generation technology, that technology could seemingly
be the basis for a positive business case23. Reality, however, is more complicated.
The issue is that much of the wind energy produced can be expected to enter the market in the Northwest European region right at the same time. At these particular moments electricity prices drop as a result. Revenues for wind energy producers are consequently relatively low. This suggests that additional revenue streams continue to be necessary to realize a high share of (offshore) wind energy in the mix, and possibly even to sustain such a high share in the mix.
23 Baseload futures are derivatives traded at electricity exchanges such as ICE Endex, The European Energy Exchange (EEX), etc. Prices for baseload futures reflect expectations regarding the future value of electricity in a specific time frame, e.g. a future calendar year. Baseload futures are used by utilities to hedge price and volume risks.
24 SUNSET OR SUNRISE? ENERGY PAPER
FIGURE 7. CORRELATION COEFFICIENTS FOR ON- AND OFFSHORE WIND IN NORTHERN EUROPE (NORTH SEA REGION HIGHLIGHTED)24,25
Generation from wind capacity in different countries is correlated across geographical areas such as the North Sea region; see specifically the UK, Belgium, the Netherlands, Germany and Denmark in Figure 7. This implies that revenues can only be captured when a substantial amount of wind energy is available in a vast market area. Even though wholesale markets may show fairly high prices for baseload futures (effectively representing annual averages), reality can be that at times of abundant wind generation, prices are actually low and consequently captured revenues are also relatively low. At times when there is not much wind generation in the market, wholesale market prices are high and revenues are high for those generators producing electricity, but wind farms are unable to capture them. Modelling by Pöyry of the future UK electricity market, shown in Figure 8, illustrates this. With low levels of wind energy penetration, it is not a prominent issue; but with increasing levels of wind energy penetration, the issue becomes more relevant.
24 CIEP analysis of OffshoreGrid data, obtained through CEPS (2012), The Benefits of Investing in Electricity Transmission - Lessons from Northern Europe, http://www.ceps.eu/ceps/dld/6542/pdf, retrieved on 22 January 2014.
25 Data for Norway shows some correlation with (other) North Sea countries too, but due to the vast geography of Norway, data from Norway is not necessarily related to wind parks in the North Sea region. Therefore, Norway is not shown in the North Sea block.
25
FIGURE 8. MODELLING UK ELECTRICITY MARKET IN JANUARY 2030 WITH 43 GW INSTALLED WIND CAPACITY26
Even though ambitious technological measures like an extensive pan-European high-voltage grid combined with the completion of the EU internal energy market could increase the absorption capacity of electricity markets in the long run, a commercial business developing an electricity generation project cannot ignore the risk that such an extensive grid and integrated European electricity market would not be present during the economic lifetime of the project at hand.
The time dimension is extremely important for electricity generation. So even though technological learning may drive down costs of generation technologies, revenue streams can be driven down, too. Similar reasoning could apply for other variable generation technologies such as solar energy that show high correlation in a market area. It remains to be seen as to what extent major utilities are willing to allow subsidy mechanisms to substantially determine their revenues; subsidy averseness could have implications for business model preferences.
FROM USER TO CONSUMER TO CLIENT
At the same time, traditional electricity users (who evolved into electricity ‘consumers’ in the liberalized market) increasingly not only consume electricity but also generate electricity (see Figure 23 in Appendix A for RES capacity ownership in Germany as of April 2013).
26 This graph shows the utilization of a hypothetical 43 GW of installed wind capacity in January 2030 in the UK, if the weather conditions in that month were similar to the conditions in January 2000. Pöyry (2009), Impact of Intermittency: How Wind Variability could change the shape of the British and Irish Electricity Markets, http://www.poyry.com/sites/ default/files/imce/files/impactofintermittencygbandi-july2009-energy.pdf, retrieved on 21 January 2014. With permission.
14
of wind energy is available in a vast market area. Even though wholesale markets may show fairly high prices for baseload futures (effectively representing annual averages), reality can be that at times of abundant wind generation, prices are actually low and consequently captured revenues are also relatively low. At times when there is not much wind generation in the market, wholesale market prices are high and revenues are high for those generators producing electricity, but wind farms are unable to capture them. Modelling by Pöyry of the future UK electricity market, shown in Figure 8, illustrates this. With low levels of wind energy penetration, it is not a prominent issue; but with increasing levels of wind energy penetration, the issue becomes more relevant.
Figure 8. Modelling UK electricity market in January 2030 with 43 GW installed wind capacity26
Even though ambitious technological measures like an extensive pan-‐European high-‐voltage grid combined with the completion of the EU internal energy market could increase the absorption capacity of electricity markets in the long run, a commercial business developing an electricity generation project cannot ignore the risk that such an extensive grid and integrated European electricity market would not be present during the economic lifetime of the project at hand. The time dimension is extremely important for electricity generation. So even though technological learning may drive down costs of generation technologies, revenue streams can be driven down, too. Similar reasoning could apply for other variable generation technologies such as solar energy that show high correlation in a market area. It remains to be seen as to what extent major utilities are willing to allow subsidy mechanisms to substantially determine their revenues; subsidy averseness could have implications for business model preferences.
From User to Consumer to Client
At the same time, traditional electricity users (who evolved into electricity ‘consumers’ in the liberalized market) increasingly not only consume electricity but also generate electricity (see Figure 9 for RES capacity ownership in Germany as of April 2013).
26 This graph shows the utilization of a hypothetical 43 GW of installed wind capacity in January 2030 in the UK,
if the weather conditions in that month would be similar to the conditions in January 2000. Pöyry (2009), Impact of Intermittency: How Wind Variability could change the shape of the British and Irish Electricity Markets, http://www.poyry.com/sites/default/files/imce/files/impactofintermittencygbandi-‐july2009-‐ energy.pdf, retrieved on 21 January 2014. With permission.
26 SUNSET OR SUNRISE? ENERGY PAPER
Access to generation technologies through the advancement of distributed generation technologies, together with easier access to energy exchanges through the advancement of Information and Communication Technologies (ICT), implies that such actors can no longer be referred to as electricity consumers. Rather, they act as clients who expect services from a service provider; these services must enable them to engage in those activities they prefer, using the generation assets they prefer, as well as having the consumption pattern they prefer. As a result, clients are a heterogeneous group of actors. Consider Figure 24 in Appendix A for a classification.
A range of factors, of which recent technological advancements and technology cost reductions in combination with renewable support schemes are likely to be the most relevant, drive these changes. They can be ideologically driven, too, or driven by the desire of clients to capture rents themselves rather than consuming an all-in service regarding electricity supply where the rents are captured by another entity. In this respect, micro-economics for individual actors have become an increasingly relevant factor in electricity investments; clients embrace technologies such as solar PV (potentially in combination with small-scale electricity storage) as an
energy-efficiency measure, enabling them to save on their electricity bills27. Such investment
decisions do not follow the logic of commodity wholesale markets, but rather that of consumer logic.
FIGURE 9. THE ELECTRICITY VALUE CHAIN
At the same time, however, for many clients the harsh reality is that the electricity system is a technologically complex, financially challenging and ICT-intensive system, in which at present true autonomy is either a dream or an illusion. Which is to say, many clients need services from a service provider to make their activities work. It is
27 For relevant calculations showing how micro-economics can be driving continued expansion of solar-PV capacity in a number of markets, consider reading UBS (2013), The unsubsidised solar revolution.
27
here that the service-oriented view on business activities in the electricity sector comes in, reinforced by the fact that some electric utilities have doubts on the future return on investment in electricity generation projects.
TOWARDS A SERVICE-ORIENTED VIEW?
Thinking of utility business models typically centres on the concept of the electricity value chain (Figure 9). Rethinking business models can therefore start with revisiting the electricity value chain and determining how it is changing. Implicitly, however, the concept itself seems to follow the logic of the vertically integrated electric utility, i.e. starting with generation, followed by electricity transport and distribution and ultimately leading to end-use.
Unbundled electric utilities operating in liberalized markets adopted a renewed version of the electricity value chain by seeking an integrated chain consisting of generation, wholesale/trading, retail/sales, and leading to consumption (see also Figure 9). This renewed view is still strongly rooted in the original concept, and might turn out to be too one-dimensional and one-directional for understanding changes in interactions between relevant actors in the electricity supply system.
One approach that could be better capable of grasping such changes is adopting a
more service-oriented view on business activities28. Increasingly, the electricity system
serves as a platform for a range of system users, i.e. clients as shown in Figure 24 in Appendix A. As explained, these clients are a heterogeneous group. They can include
‘traditional’ generators such as a CCGT-operator29, industrial consumers such as an
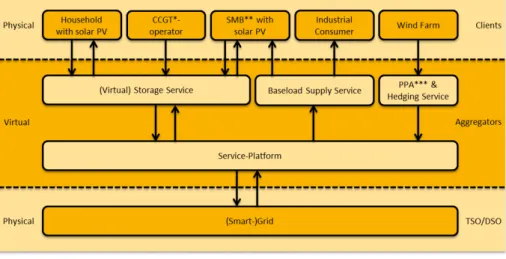
aluminium smelter, but also smaller-scale generators (distributed generation) and hybrid generator/consumers such as a household or a medium-sized business. A high-level graphic representation of such a service-oriented view which could serve as an example is shown in Figure 10.
28 Although not always clearly defined, service-oriented business models increasingly appear to be regarded as an answer to present challenges in the European Utility industry. One example of this can be found in the article: RWE Sheds Old Business Model, Embraces Transition, at http://www.energypost.eu/exclusive-rwe-sheds-old-business-model-embraces-energy-transition, retrieved on 22 January 2014. Another example is Dutch utility Eneco’s view on its business model, expressed at http://annualreport2012.eneco.com/report-of-the-board/who-we-are-what-we-do/business-model, retrieved on 22 January 2014.
28 SUNSET OR SUNRISE? ENERGY PAPER
FIGURE 10. SERVICE-ORIENTED VIEW ON BUSINESS ACTIVITY IN THE ELECTRICITY SECTOR
Clients and the grid itself have a strong ‘physical’ nature (technology, hardware). At the same time, there is a layer with a ‘virtual’ nature that manages interactions between clients, building on the grid (similar to the role of software in ICT). These
interactions entail virtual electricity flows30. It is the virtual layer that has become
increasingly relevant for actors involved in electricity business.
In this respect, interesting lessons can be learned from the ICT business. Think of how Android and iOs operating systems for smart-phones have become platforms for a wide range of apps that serve smart-phone users. The platform developer and owner does not tightly control the complete value chain but manages to realize a strong position by having the most appealing platform for apps (which can be
regarded as services)31. Crucially, the platform owner does not necessarily develop all
services (apps) him/herself, but rather his/her platform is open for other service
developers32. Another relevant observation can be made in online retailing. That is to
say, think of the business model of eBay, which offers a platform for buyers and
30 The word ‘virtual’ is explicitly used here; in contrast to virtual flows and corresponding money flows, physical flows follow the technological characteristics of the electricity grid; these physical flows are managed by transmissions and distribution system operators (TSOs/DSOs).
31 In fact, one could also relate this thinking to ‘franchising’, as suggested by RWE CEO Peter Terium in a Q&A-session following his CIEP-lecture Energy Transition – A European Challenge at Huys Clingendael (The Hague, Netherlands), 14 March 2014.
32 For a brief overview of how the history Apple, iOs, and its apps store, consider reading: Wired.com, 7 October 2013, 5 Years On, The App Store Has Forever Changed the Face of Software, http://www.wired.com/gadgetlab/2013/07/five-years-of-the-app-store, retrieved on 31 January 2014.
29
sellers that enables them to interact33. eBay competes with retail stores not by
keeping stocks and selling goods but by offering a digital platform.
Standardized platforms and services can be used by entrepreneurs to develop applications for clients. This line of reasoning is common in ICT business. A recent
article in The Economist, ‘A Cambrian Moment’34, argues that this principle is
presently a driving force behind innovation and entrepreneurship in the wider economy. Given the virtual nature of electricity trading, sales and retailing, this principle could serve as a base for future business activity in the electricity sector. Such a service-oriented view to business activity could reveal that now, after the first phase of market-liberalization, preferences for vertical integration are becoming weaker.
33 The Financial Times reports: ‘Now eBay is on its next three-year plan, positioning itself to be a platform for retailers by creating a suite of technology offerings that allow store owners to be their own Amazon, and forging partnerships with large retailers such as Best Buy, Home Depot, and Toys R Us that give eBay customers more product choices and shipping options.’ See Financial Times, 18 October 2012, http://www.ft.com/intl/cms/s/0/df3723ca-1773-11e2-8cbe-00144feabdc0.html#axzz2qMgyNKhN, retrieved on 23 January 2014.
34 The Economist, Jan 18th 2014. Tech Startups – A Cambrian Moment, http://www.economist.com/news/special-report/21593580-cheap-and-ubiquitous-building-blocks-digital-products-and-services-have-caused, retrieved on 22 January 2014.
31
3 SHIFTING BUSINESS
MODELS
As explained in the previous chapter, the traditional view on business activity in the electricity sector centres around the electricity value chain. This value chain includes upstream (the procurement activities regarding inputs for generation), midstream (trading activities, as well as transport and distribution) and downstream (retail and sales) activities. However, these business activities can be revisited in a different fashion, as is shown in Figure 11. The objective of this the graph is not to provide a final, complete and perfect overview of business activity in the realm of the electric utility, but rather to show that activities can be clustered and that interfaces exist with actors in other industries.
FIGURE 11. BUSINESS ACTIVITIES IN AND AROUND THE SPHERE OF THE UTILITY
32 SUNSET OR SUNRISE? ENERGY PAPER
The cluster of activities in the centre used to be the heart of ‘the electric utility’ as it emerged with market liberalization. It is relevant to realize that this cluster is not something that follows from laws of nature. As a result of the changing business logic, new clusters can be preferred and old clusters can split or dissipate. At the same time, actors from other industries can increasingly be drawn into activities in the electricity sector.
As an example, it can be argued that there is a growing disconnect between upstream activities (be it in the gas, coal or nuclear value chain) and downstream activities (retail, decentralized generation, energy services). While the former is closely related to activities for which the global market environment is strongly relevant and in which globally active actors continue to have a strong interest and expertise, the latter has a more local/regional dimension. At the same time, downstream activities are becoming technologically more complex, more integrated with grids, and have higher information (ICT) requirements, potentially attracting new types of actors.
This leads to a range of questions regarding to the way forward. Will generation activities based on combustible fuels turn out to be more attractive as a downstream outlet for international or state-owned oil and gas companies? Are nuclear generation activities more attractive for globally active nuclear enterprises than for an electric utility primarily operating in the future Northwest European electricity market? Is generation from conventional sources increasingly an extension of a transmission system operator’s (TSO) or distribution system operator’s (DSO) responsibility to guarantee system adequacy? Is the utility the logical ‘platform owner’ or ‘service manager’, or will ICT-enterprises enter the market that already manage other interactions with consumers?
The future is highly uncertain. Moreover, different electric utilities can have different responses, depending on their perceived strengths and existing portfolios. As such, the remainder of this chapter explores three potential models an electric utility could pursue, i.e. the Revitalized Electric Utility, the Large-Scale RES Generator and the New Electricity Service Platform. One additional ‘model’ is also explored, i.e. the State-Sponsored Utility, which is not so much an outcome of changing business model preferences but rather is the result of a utility default. It is relevant to note that in the real world, a variety of business models currently exist and can be expected to continue to exist in future. No utility is likely to put all its eggs in one basket, so hybrid models emerge, new ventures are started in order to experiment with new models, etc.
33
THE REVITALIZED ELECTRIC UTILITY
Some utilities may be seeking an extended future for the typical business model that emerged in past years with market liberalization, with innovations in particular business activities rather than in the whole business model. Alleviation from present financial stress in the sector is key here.
In principle, such alleviation could be the result of combined developments opposite to what caused the ‘perfect storm’ that was extensively reported in the 2013 CIEP
publication ‘European Power Utilities Under Pressure?’35. One can think of general
economic recovery in Europe, leading to electricity demand growing faster than the further expansion of RES capacity; a growing market for conventional capacities could then re-emerge. A relevant factor here could be a post-2020 policy emphasizing carbon emissions reduction rather than RES share increases; the public policy focus could be on completion of the EU internal energy market and the EU
ETS as a means of reducing greenhouse gases36. Such an approach to carbon
emissions reductions would be most likely if affordability issues regarding RES
continue to dominate the public discourse37.
It is highly questionable whether such a road to recovery is truly realistic, however. As was explained in the previous chapter, RES capacity additions in recent years, combined with what can firmly be expected for the coming years, have long-lasting effects on power markets. And even if Europe were to focus less on the introduction of RES, individual member states could still make different choices; for the Northwest European region Germany is highly relevant in this respect (consider the 2023 forecasts by German TSOs shown in Table 1 in Appendix B).
In this context, it is important to note that an alternative route to regaining financial strength could be the introduction of aforementioned CRMs, which could create a revenue stream for generation in addition to revenues from energy sales. Such CRMs would create a market for generation capacity that can ensure security of electricity
35 CIEP (2013), European Power Utilities Under Pressure?, http://www.clingendaelenergy.com/publications/publication/ european-power-utilities-under-pressure, retrieved 4 March 2014.
36 The EC proposals of January 2014 suggest that there may be no 2030 targets for member states regarding RES shares in the energy mix. See the press release of 22 January 2014, http://europa.eu/rapid/press-release_IP-14-54_en.htm, retrieved on 27 January 2014.
37 Spiegel, 4 September 2013, Germany’s Energy Poverty: How Electricity Became a Luxury Good, http://www.spiegel.de/ international/germany/high-costs-and-errors-of-german-transition-to-renewable-energy-a-920288.html, retrieved on 22 January 2014; Financial Times, 13 January 2014, EU Considers Scrapping 2030 Binding Renewables Targets, http://www. ft.com/intl/cms/s/0/b7de8ac2-7b98-11e3-a2da-00144feabdc0.html#axzz2qMgyNKhN, retrieved on 22 January 2014; Financial Times, 11 November 2013, Industry Warns Over German Move To Cut Green Energy Subsidies, http://www. ft.com/intl/cms/s/0/56f252aa-4adf-11e3-8c4c-00144feabdc0.html#axzz2kcykjkYc, retrieved on 22 January 2014.
34 SUNSET OR SUNRISE? ENERGY PAPER
supply for times when variable RES do not produce. Energy companies represented
in the ‘Magritte group’ stress the need for such CRMs38.
A strengthened future for conventional generation assets creates the strongest rationale for continued vertical integration across the electricity value chain; a revitalized electric utility could pursue continued presence in the entire cluster of business activities depicted in Figure 11. Inclusion of upstream activities would be most uncertain, however, since some utilities have decided but others are yet to
decide about selling assets in order to generate cash39.
There is a risk involved in anticipating revenue streams from CRMs, though. CRMs
do not create substantial additional revenues per se. If a market-based approach is
chosen for CRMs, revenues could turn out to be low. Indeed, if the price for reliable capacity is a function of demand for capacity vs. the availability of capacity, prices in a competitive capacity market can be expected to be low in market areas with
substantial amounts of capacity installed, such as the Netherlands40. This is especially
true if the completion process of the EU internal energy market is hampered and barriers between market areas continue to exist.
It is highly questionable whether the revitalized business model is a robust model for the long-term, given the changing business logic described in the previous chapter; but for the short- to medium term, it could enable a utility to initiate a more gradual longer-term transformation process; present debt-laden and cash-strapped utilities may not have this option.
THE LARGE-SCALE RES GENERATOR
Some utilities are increasingly attracted by electricity generation from large-scale RES. In Northwest Europe, offshore wind capacity in the North Sea region is highly relevant in this regard. A business model focusing on large-scale RES could be
38 EurActiv.com, 11 October 2013, Energy CEOs Call For End To Renewable Subsidies, http://www.euractiv.com/energy/ energy-ceos-call-renewable-subsi-news-531024, retrieved on 22 January 2014.
39 ICIS, 10 February 2011, Vattenfall Puts Dutch Upstream Assets Up For Sale, http://www.icis.com/heren/ articles/2011/02/10/9434316/vattenfall-puts-dutch-upstream-assets-up-for-sale.html, retrieved on 22 January 2014; ICIS, 17 March 2014, German Utility RWE Sells Natural Gas And Oil Arm To LetterOne Group, http://www.icis.com/heren/ articles/2014/03/17/9763527/german-utility-rwe-sells-natural-gas-and-oil-arm-to-letterone.html, retrieved on 19 March 2014.
40 IPA PWC (2013), page 5, commissioned by Energie-Nederland, Financial and Economic Impact of a Changing Energy Market, http://www.energie-nederland.nl/wp-content/uploads/rapporten/PwC-Financial-and-economic-impact-of-a-changing-energy-market-Final.pdf, retrieved on 22 January 2014.
35
consistent with a continued public policy focus on renewables in environmental/
climate policy including 2030 targets41.
However, the financial situation in the utility industry might have to improve for this
business model to work42. Moreover, in many respects, offshore wind energy is still a
risky undertaking, most certainly so in the near term43. Innovative approaches by
utilities (financing models) as well as public policy makers (public support models) are therefore needed for this business model to work. As explained in the previous chapter in the section ’Building a Business on Subsidies?’, the risk of falling wholesale prices due the strong correlation of generation from wind capacity in the Northwest European region may have to be accommodated in public support models; such (national) models must be designed in harmony with the EU internal energy market so as to avoid (further) distortion of (cross-border) electricity wholesale markets, as
argued by Eurelectric44.
Business activities by The Large-scale RES Generator are increasingly disconnected from nuclear and coal-fired generation activities. A utility anticipating a large role for variable RES in the electricity supply system must conclude that investments in relatively capital-intensive conventional technologies, such as nuclear and coal-fired capacity, are less attractive. As explained in the previous chapter in the section ’The Business Case for Conventional Generation’, from an investor’s perspective, new-build gas-fired power plants could become more attractive because of the lower CAPEX. Paradoxically, however, gas-fired power plants are currently outcompeted by coal-fired power plants due to daily operations based on variable costs combined with relatively low coal and carbon prices. Moreover, utilities may be forced to sell underutilized gas-fired power generation assets in order to generate cash to solve
41 Contrasting the statements by the Magritte group, a statement was expressed by a different group of companies involved in electricity business. See the open letter: EREC, October 2013, Industry Statement for Binding Renewable Energy Target in 2030 Framework, http://www.erec.org/fileadmin/erec_docs/Documents/Open_Letters/Industry_Statement_for_ Binding_2030_RES_Target_October_2013.pdf, retrieved on 22 January 2014.
42 Financial Times, 26 November 2013, RWE Axes £4bn UK Wind-Farm Project, http://www.ft.com/intl/cms/s/0/464439ca-5672-11e3-ab12-00144feabdc0.html#axzz2llRXnig8, retrieved on 22 January 2014.
43 Standard & Poor’s Rating Services, 13 December 2012, How The Explosive Growth In Offshore Wind Generation Could Affect European Utilities' Credit Quality, http://www.standardandpoors.com/spf/upload/Ratings_EMEA/ HowTheExplosiveGrowthInOffshoreWin dGenerationCouldAffectEuropeanUtilities.pdf, retrieved on 22 January 2014. 44 Eurelectric, 5 November 2013, EURELECTRIC Welcomes EC’s Pro-Market Stance on Public Intervention, http://www.
eurelectric.org/news/2013/eurelectric-welcomes-ec%E2%80%99s-pro-market-stance-on-public-intervention, retrieved on 5 November 2013.