A COMPARISON OF ALTERNATIVE FUNCTIONAL FORMS FOR PARAMETRIC
ESTIMATION OF THE LORENZ CURVE
by Kwang Soo Cheong
Working Paper No. 99-2R October 1999
AN EMPIRICAL COMPARISON OF
ALTERNATIVE FUNCTIONAL FORMS FOR THE LORENZ CURVE
by
Kwang Soo Cheong University of Hawaii at Manoa
Abstract
Using U.S. income data, we evaluate several functional forms for the Lorenz curve. On the basis of the goodness of fit, estimated income shares and Gini coeffi-cients, the form proposed by Kakwani (1980) is found to be overall superior to the other forms.
Keywords: Income inequality, the Lorenz curve and the Gini coefficient. JEL Codes: D31, D63.
Address for correspondence: Department of Economics, University of Hawaii, 2424 Maile Way, Social Sciences Building #528, Honolulu, HI 96822, U. S. A. Phone:
1. Introduction
Although the Lorenz curve can be calculated directly from empirical data, para-metric estimation of the Lorenz curve remains useful and worthwhile in income studies,1 and many researchers have proposed functional forms for the estimation.
Little efforts, however, have been devoted to assess the relative performance of these forms2 with a few exceptions. Among them, Chotikapanich (1993) provided
an interesting comparison of alternative functional forms. She first proposed a new single-parameter form, then evaluated the performance of that form along with two others in the literature: one proposed by Kakwani and Podder (1976) and the other by Rasche et al. (1980). Employing expenditure data from Thailand, she found that her new form estimated the Gini coefficient more accurately than the other two forms.
In this paper, we report the results from a similar empirical study employing U.S. income data in Basmann et al. (1993). Along with those mentioned above, we include additional functional forms proposed by Kakwani (1980) and by Ortega et al. (1991). 3 Unlike Chotikapanich, we find that the Gini coefficients estimated
1 See Chapter 4 in Ryu and Slottje (1998) for discussion of this point.
2 Quoted from Wan (1999), p.597. Wan’s paper provided an empirical assessment
of the flexible functional form proposed by Basmann et al. (1990), using the Chinese income data. In this paper, we focus on fixed functional forms proposed in the literature.
3 These five forms are far from exhaustive; there are several other well-known
forms in the literature. Forms proposed by Gupta (1984) and Rao and Tam (1987) are not included since they are special cases of the form proposed by Kakwani and Podder (1973), which is itself a special case of the general form used in Basmann
using the Kakwani-Podder form are closest to the actual Gini coefficients and the Rasche et al. form best approximates the actual Lorenz curve in terms of R2.
Overall, the Chotikapanich form is outperformed by all other forms considered. In addition, the performance of the Kakwani form is most impressive; it estimates the Gini coefficients almost as accurately as the Kakwani-Podder form and it fits the data as perfectly as the Rasche et al. form in the regression of the Lorenz curve.
Interestingly, we find the same trends in income inequality over the data periods regardless of the functional forms used. The consistent use of a functional form, therefore, seems important for comparative income studies.
2. Alternative Functional Forms
The Lorenz curve graphs the cumulative income share, L(p), as a function of the cumulative population share, p, when the income units are arranged according to income size. A functional form for the Lorenz curve must satisfy the following conditions:
(i) L(0) = 0, (ii) L(1) = 1, (iii) L0(p)≥0, (iv) L00(p)>0.
For the parametric estimation of the Lorenz curve, Kakwani and Podder (1976) et al. (1993, Ch.3). Since we use the same data as Basmann et al., our results are directly comparable to theirs. We also choose not to include the form proposed by Ogwang and Rao (1996), which reports an estimated Gini coefficient of 0.39 for the 1997 data in Basmann et al. (1993). That seems to be beyond reasonable acceptability; as shown in Table 5, the actual Gini coefficient is 0.3682, and the estimates based on the five forms range from 0.3611 to 0.3695.
proposed the following functional form: 1 √ 2(p−L(p)) = a º 1 √ 2(p+L(p)) »α º√ 2− √1 2(p+L(p)) »β , (1)
where a≥0, 0< α, β≤1.From Equation (1), the Gini coefficient is derived as
G= 2a (√2)(α+β+1) B(1 +α,1 +β), (2)
where B is the beta function.
Rasche et al. (1980) instead proposed the following functional form:
L(p) ={1−(1−p)α}β1 , (3)
where 0< α, β ≤1.
From Equation (3), the Gini coefficient is derived as
G= 1− 2 α B( 1 α, 1 β + 1). (4)
Ortega et al. (1991) proposed another alternative given by
L(p) =pα ¨1−(1−p)β©, (5)
where 0< α and 0< β≤1.
From Equation (5), the Gini coefficient is derived as
G= α−1
α+ 1 + 2a B(α+ 1, β+ 1). (6) Chotikapanich (1993) proposed yet another form given by
L(p) = e kp−1
ek −1 , (7)
From Equation (7), the Gini coefficient is derived as
G= (k−2)e
k + (k+ 2)
kek−1 . (8)
In his 1980 study of poverty measures, Kakwani used the following form: 4
p−L(p) =apα(1−p)β , (9)
wherea,α,β >0.The left-hand side of (9) measures the vertical distance between the equality line and the Lorenz curve, and the conditions (i) - (iv) are all satisfied if 0< α, β <1. This functional form is criticized on the ground that it may allow negative values for L(p); 5 however, we find L(p) positive in all our estimation
results.
Cheong (1986) derived the Gini coefficient from Equation (9) as follows:
G= 2a B(α+ 1, β+ 1). (10)
3. Empirical Evaluation
To evaluate the performance of the alternative functional forms, we use the annual U.S. income data from the Current Population Survey: March le for the years 1977 to 1983 as reported by Basmann et al. (1993, Ch.3). These data are arranged with income units grouped into 100 income classes, each class being one percent of the sample population. The number of income classes is reasonably large
4 This form has not been used widely, but, using the Australian income data from
the original papers, Cheong (1986) showed that this form better approximated the Lorenz curve than did the forms in Kakwani and Podder (1973 and 1976).
for making a proper estimation of the Lorenz curve. It should be also noted that data points are fixed and equally spaced in the data; consequently, our results are not likely to be severely biased in favor of or against any particular functional form. For this reason, we believe it is an interesting and meaningful task to compare our results with what Chotikapanich found using individual expenditure data, despite having used grouped data in this paper.
We compare the performance of functional forms in terms of the goodness-of-fit measure (R2), estimated income shares and estimated Gini coefficients. First, Table
1 presents the R2 values for the regression of the Lorenz curves using alternative
functional forms. 6 For all sample years, the Kakwani and Rasche et al. forms
fit the data almost perfectly. They are followed by the Ortega et al. and Kakwani-Podder forms and the Chotikapanich form obtains the lowest R2. 7 However, it
should be noted that the Chotikapanich form has more degrees of freedom since it has only one parameter to be estimated while all others have two or more.
Tables 2 - 4 summarize the comparison of the actual and estimated income shares of decile groups.
The income shares for three selected years, 1977, 1980 and 1982 are presented in
6 We use the nonlinear least squares estimation method with the Gauss-Newton
algorithm for all functional forms and, therefore, R2 may not necessarily be in the
range of 0 to 1. However, it still serves as a useful measure of the fit of the regression.
7 Basmann et al. reported the R2 values obtained from the same data using the
form in Kakwani and Podder (1973). TheirR2values are between 0.9904 and 0.9862
over the sample years, and hence even lower than the values for the Chotikapanich form in Table 1.
Table 2. We choose those years for presentation because the Ortega et al., Kakwani-Podder and Chotikapanich forms obtain their highestR2for the 1977, 1980 and 1982
data, respectively. Although no single functional form consistently outperforms the others, no functional forms produce as many closest estimates as the Kakwani form. The Rasche et al. form estimates income shares almost as well. From the table, we notice a few interesting patterns. First, the Basmann et al. form (their general form without any parameter restrictions) best estimates the income share of the first decile while the Chotikapanich form overestimates it by the largest margin. The Chotikapanich form, though, almost precisely estimates the next decile’s income share. It is also shown that the income shares of the middle income classes are particularly well estimated by the Kakwani form.
Each of the patterns discussed was repeatedly observed for other other sample years. Table 3 presents the functional form that best approximates the decile income shares in each sample year while Table 4 presents the functional form that produces the poorest estimate.
Although the sample period of seven years is too short to provide any strong empirical evidence, the results shown here are generally in favor of the Kakwani form and against the Chotikapanich form. 8 Certainly, these results offer some
useful implications for income studies. For example, the Kakwani-Podder form is not recommended in a study focused on the lower income classes. On the other hand, one should use the Kakwani or Rasche et al. form rather than the Basmann et al. form if he is mainly concerned about the upper income classes.
8 This is consistent with Chotikapanich’s finding that her form was outperformed
by the Kakwani-Podder and Rasche et al. forms in the estimation of expenditure shares.
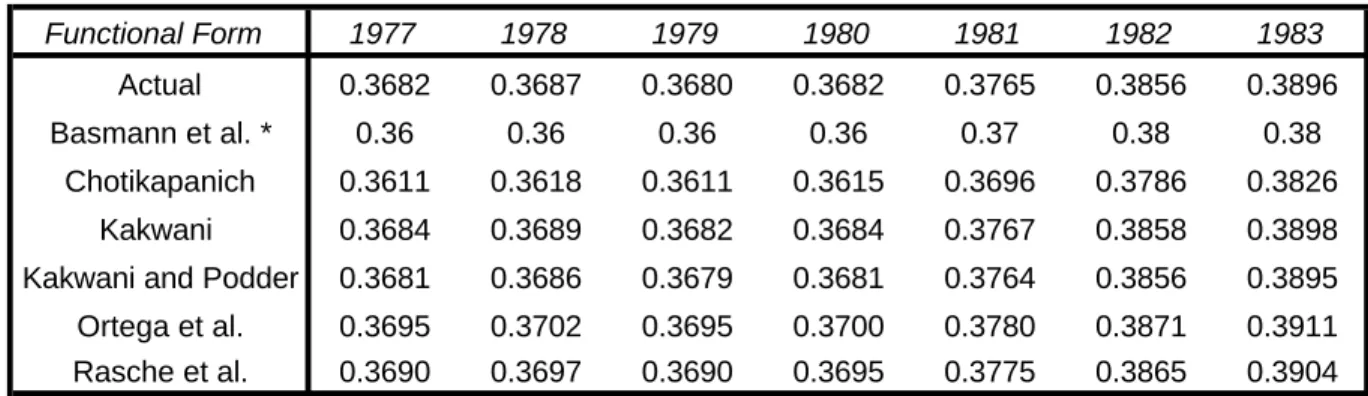
Table 5 presents the actual and estimated Gini coefficients. Following the con-ventional method, the actual Gini coefficients are computed from the Lorenz curve obtained as the piecewise linear interpolant over the percentile data points, and the formula is, therefore, given by
G=
99
X
i=1
(piL(pi+1)−pi+1L(pi)).
The estimated Gini coefficients for each form are computed from Equations (2), (4), (6), (8) and (10), respectively.
First of all, the Kakwani and Kakwani-Podder forms produce fairly good esti-mates of the actual Gini coefficients for all sample years although the former per-forms marginally better than the latter. The performance of the Kakwani-Podder form here is rather surprising since it estimates the decile income shares relatively poorly.
In contrast with Chotikapanich’s findings, the Gini coefficients estimated using her form are farthest from the actual Gini coefficients and, thus, the U.S. income data used in this paper do not seem to empirically support the Chotikapanich form. It is also shown that the Basmann et al., Kakwani-Podder and Chotikapanich forms consistently lead to an underestimation of the actual Gini coefficients while the Kakwani, Ortega et al. and Rasche et al. forms consistently provide overestimates. Nevertheless, Figure 1, which is drawn from Table 5, demonstrates that no functional form fails to project the trend in income inequality shown by the fluctuation of the actual Gini coefficient over the sample years. Depending upon the purpose of the study, it may then be more crucial to consistently use a functional form rather than identify and use the best-fit forms for individual sample periods.
4. Concluding Remarks
On the basis of the goodness of fit, estimated income shares and Gini coeffi-cients, we conclude that the functional form proposed by Kakwani (1980) has the best overall performance among all the forms considered. We also find that the form proposed by Kakwani and Podder (1976) is very reliable in estimating the Gini coefficients, although it performs relatively poorly in estimating income shares. On the other hand, the form proposed by Rasche et al. (1980) obtains the highest R2 while it does not estimate the Gini coefficients as accurately as the Kakwani
or Kakwani-Podder form. On the whole, the form proposed by Chotikapanich is outperformed by each of the other forms.
These results are in sharp contrast with what Chotikapanich found in her study with Thailand expenditure data. It is possible that the differences are due to the intrinsic nature of income distribution and expenditure distribution and/or the dis-tinct characteristics of Thailand and U.S. income distributions, and further studies are called for. Meanwhile, the Kakwani form seems to be the most reasonable choice in U.S. income studies. Our results also draw attention to the importance of consistently using the same functional form in comparative studies.
References
Basmann, R. L., K. J. Hayes and D. J. Slottje (1993) Some new methods for measur-ing and describmeasur-ing economic inequality (JAI Press, Greenwich, Connecti-cut).
Basmann, R. L., K. J. Hayes, D. J. Slottje and J. D. Johnson (1990) A general func-tional form for approximating the Lorenz curve, Journal of Econometrics, 43, 77-90.
Cheong, K. S. (1986) Inequality indices as tools for analyzing income distributions, mimeo. (Abstract available in English), Seoul National University.
Chotikapanich, D. (1993) A comparison of alternative functional forms for the Lorenz curve, Economics Letters, 41, 129-138.
Gupta, M. R. (1984) Functional forms for estimating the Lorenz curve, Economet-rica, 52, 1313-1314.
Kakwani, N. C. (1980) On a class of poverty measures, Econometrica, 48, 437-446. Kakwani, N. C. and N. Podder (1973) On the estimation of Lorenz curves from
grouped observations, International Economic Review, 14, 278-292.
Kakwani, N. C. and N. Podder (1976) Efficient estimation of the Lorenz curve and associated inequality measures from grouped observations, Econometrica, 44, 137-148.
Ogwang, T. and U. L. G. Rao (1996) A new functional form for approximating the Lorenz curve, Economics Letters, 52, 21-29.
Ortega, P., G. Martin, A. Fernandez, M. Ladoux, and A. Garcia (1991) A new functional form for estimating Lorenz curves, Review of Income and Wealth, 37, 447-452.
Rao, U. L. G. and A. Y-P. Tam (1987) An empirical study of selection and estimation of alternative models of the Lorenz curve, Journal of Applied Statistics, 14,
275-280.
Rasche, R. H., J. Gaffney, A. Y. C. Koo, and N. Obst (1980) Functional forms for estimating the Lorenz curve, Econometrica, 48, 1061-1064.
Ryu, Hang Kyu and Daniel J. Slottje (1998) Measuring trends in U.S. income in-equality (Springer-Verlag, Berlin).
Wan, Guano Hua (1999) An empirical assessment on alternative functional forms of the Lorenz curve, Applied Economics Letters, 6, 597-599.
Table 1. The R2 for the Regression of Parametric Lorenz Curves Functional Form 1977 1978 1979 1980 1981 1982 1983 Chotikapanich 0.9983 0.9984 0.9985 0.9987 0.9983 0.9982 0.9980 Kakwani 1.0000 1.0000 1.0000 1.0000 1.0000 1.0000 1.0000 Kakwani - Podder 0.9989 0.9991 0.9992 0.9993 0.9991 0.9994 0.9993 Ortega et al. 1.0000 0.9999 0.9999 0.9999 0.9999 0.9999 0.9999 Rasche et al. 1.0000 1.0000 1.0000 1.0000 1.0000 1.0000 1.0000
Table 2. Actual and Estimated Percentage Income Shares for Decile Income Groups *
1977 Decile Actual BHS DC NK KP OMFLG RGKO
1 1.80 1.80 2.78 1.79 1.43 1.57 1.63 2 3.48 3.57 3.51 3.49 3.87 3.45 3.49 3 4.87 4.84 4.45 4.89 5.11 4.98 4.98 4 6.29 6.10 5.63 6.29 6.30 6.43 6.39 5 7.80 7.54 7.13 7.76 7.62 7.89 7.83 6 9.40 9.32 9.03 9.37 9.17 9.43 9.37 7 11.17 11.54 11.44 11.19 11.06 11.17 11.13 8 13.33 14.39 14.48 13.41 13.44 13.29 13.31 9 16.45 18.07 18.33 16.50 16.82 16.31 16.46 10 25.41 22.83 23.21 25.31 25.19 25.48 25.42
1980 Decile Actual BHS DC NK KP OMFLG RGKO
1 1.73 1.75 2.77 1.84 1.45 1.50 1.56 2 3.49 3.55 3.51 3.40 3.79 3.39 3.42 3 4.87 4.82 4.44 4.80 5.05 4.94 4.94 4 6.25 6.10 5.63 6.24 6.27 6.42 6.39 5 7.77 7.55 7.13 7.76 7.61 7.92 7.86 6 9.39 9.33 9.03 9.42 9.20 9.50 9.44 7 11.22 11.56 11.43 11.30 11.13 11.27 11.23 8 13.46 14.42 14.48 13.56 13.58 13.41 13.43 9 16.75 18.09 18.35 16.67 17.05 16.42 16.56 10 25.07 22.83 23.24 25.00 24.87 25.22 25.17
1982 Decile Actual BHS DC NK KP OMFLG RGKO
1 1.50 1.52 2.54 1.62 1.22 1.36 1.42 2 3.27 3.33 3.27 3.19 3.58 3.16 3.20 3 4.67 4.62 4.19 4.59 4.84 4.69 4.70 4 6.08 5.88 5.38 6.03 6.06 6.18 6.14 5 7.55 7.35 6.91 7.56 7.43 7.70 7.64 6 9.20 9.15 8.87 9.25 9.03 9.32 9.25 7 11.08 11.47 11.38 11.18 10.99 11.16 11.11 8 13.45 14.49 14.61 13.53 13.53 13.41 13.42 9 16.92 18.47 18.76 16.82 17.20 16.62 16.78 10 26.28 23.72 24.08 26.23 26.11 26.41 26.35 * Note:
1.Underlined are the estimated income shares closest to the actual income shares.
2. Forms: BHS: The unrestricted form in Basmann et al. (1993) DC: Chotikapanich (1993)
NK: Kakwani (1980)
KP: Kakwani and Podder (1976) OMFLG: Ortega et al. (1991) RGKO: Rasche et al. (1980)
Table 3. The Functional Forms that Best Estimate the Decile Income Shares * Decile 1977 1978 1979 1980 1981 1982 1983 1 BHS BHS BHS BHS BHS BHS BHS 2 NK/RGKO DC DC DC DC DC DC 3 NK NK NK BHS NK OMFLG BHS 4 NK NK NK NK KP KP KP 5 RGKO NK NK NK NK NK NK
6 NK/RGKO RGKO RGKO NK NK NK NK/RKGO
7 OMFLG OMFLG RGKO RGKO RGKO RGKO RGKO
8 RGKO RGKO RGKO RGKO RGKO RGKO NK
9 RGKO NK NK NK NK NK NK
10 RGKO RGKO RGKO NK RGKO NK RGKO
* Note: BHS: The unrestricted form in Basmann et al. (1993) DC: Chotikapanich (1993)
NK: Kakwani (1980)
KP: Kakwani and Podder (1976) OMFLG: Ortega et al. (1991) RGKO: Rasche et al. (1980)
Table 4. The Forms that Most Poorly Estimate the Decile Income Shares * Decile 1977 1978 1979 1980 1981 1982 1983 1 DC DC DC DC DC DC DC 2 KP KP KP KP KP KP KP 3 DC DC DC DC DC DC DC 4 DC DC DC DC DC DC DC 5 DC DC DC DC DC DC DC 6 DC DC DC DC DC DC DC 7 BHS BHS BHS BHS BHS BHS DC 8 DC DC DC DC DC DC DC 9 DC DC DC DC DC DC DC 10 BHS BHS BHS BHS BHS BHS BHS
* Note: BHS: The unrestricted form in Basmann et al. (1993) DC: Chotikapanich (1993)
NK: Kakwani (1980)
KP: Kakwani and Podder (1976) OMFLG: Ortega et al. (1991) RGKO: Rasche et al. (1980)
Table 5. The Actual and Estimated Gini Coefficients Functional Form 1977 1978 1979 1980 1981 1982 1983 Actual 0.3682 0.3687 0.3680 0.3682 0.3765 0.3856 0.3896 Basmann et al. * 0.36 0.36 0.36 0.36 0.37 0.38 0.38 Chotikapanich 0.3611 0.3618 0.3611 0.3615 0.3696 0.3786 0.3826 Kakwani 0.3684 0.3689 0.3682 0.3684 0.3767 0.3858 0.3898
Kakwani and Podder 0.3681 0.3686 0.3679 0.3681 0.3764 0.3856 0.3895 Ortega et al. 0.3695 0.3702 0.3695 0.3700 0.3780 0.3871 0.3911 Rasche et al. 0.3690 0.3697 0.3690 0.3695 0.3775 0.3865 0.3904
Figure 1. The Actual and Estimated Trend of
Income Inequality
0.3600 0.3650 0.3700 0.3750 0.3800 0.3850 0.3900 0.3950 1977 1978 1979 1980 1981 1982 1983Year
Gini Coefficients
Actual ChotikapanichKakwani Kakwani - Podder