CUSTOMER SATISFACTION AND SWITCHING COST
TOWARD TRUST IN THE BRAND AND CUSTOMER
RETENTION OF SIMPATI IN JEMBER
Mohamad Dimyati,
Management Department,
Faculty of Economics,
Jember University, East Java, Indonesia.
ABSTRACT
The aim of this research was to examine the effects of customer satisfaction towards trust in the brand, switching cost towards trust in the brand, customer satisfaction towards customer retention, switching cost towards customer retention and trust in the brand towards customer retention. A total sample of 120 respondents living in the town of Jember was collected through purposive sampling technique. The model analysis applied was Structural Equation Modeling (SEM). The results showed that customer satisfaction effected significantly positive towards trust in the brand; switching cost effected significantly positive towards trust in the brand; customer satisfaction has no effect towards customer retention; switching cost has no effect towards customer retention; and trust in the brand effected significantly positive towards customer retention.
INTRODUCTION:
The decreasing market growth and heavy market competitions, especially in the telecommunications sector, cause companies tend to maintain its market share by focusing on retaining existing customers (Lee and Feick, 2001). Developing a long-term and mutual relationship with customers can retain existing ones and can stimulate positive influence through word-of-mouth which is an effective and efficient way to influence new customers, and eventually increase the market share and company profitability.
In order to retain existing customers, companies need to create customer loyalty. However, a loyal behavior is inadequate to ensure its survival, but there needs to be actual action from the real loyal customer to the company, which is the existence of customer retention (Buttle, 2004). Consequently, many companies have adopted a customer retention technique to improve the company’s performance. The Government policy of the Republic of Indonesia is set out in the Law No. 36, Year 1999 on telecommunications, i.e. the government is open to emergence of new players in telecommunications sector, thus becomes the beginning of competitive environment in this sector. Many telecommunication companies are competing tightly for market shares due to the fact that there is still huge business potential in this sector. The developing number of cellular phone subscribers in Indonesia is considered arguably very high, while the telecommunication market penetration rate is not yet maximized, as evidenced by the level of the cellular phone tele-density in Indonesia which was around 76.48% (Ditjen Postel, 2010). The cellular phone market in Indonesia is dominated by three main operators, namely Telkomsel, Indosat and Excelcomindo. Telkomsel is the largest cellular phone operator in Indonesia that provides cellular services operating on a network of dual-band (i.e., 900-1800 MHz) and 3G networks in Indonesia with international independent network in 197 countries. Most Telkomsel customers are the simPATI card users.
However, the Telkomsel dominance, particularly simPATI card in the telecommunications world, does not guarantee to withstand against the competitors in ARPU decline (Average Revenue Per User). Although the SimPATI ARPU level is higher than the industry average, there is a yearly decrease in ARPU occurs. The increasing number of alternative cellular phone cards available in the market due to increasing number of operating cellular phone card manufacturers should be of particular concern for Telkomsel. The choice for customers to switch or use more than one card from another operator affect the intensity of customers to use Telkomsel products, especially simPATI card. Therefore, further research needs to be carried out to address this specific phenomenon.
Customer satisfaction is the beginning in creating customer retention, but it is noteworthy if it is not only customer satisfaction but also forming trust behavior towards the brand or products offered by the company and make sure the customers to repeat purchases that have become the customer retention for the company (Kotler et al, 2010). Customer satisfaction as the primary tool to manage customer retention is a major concern in company literature. The research conducted by Dimyati (2011) inferred that customer satisfaction effects significantly positive towards customer trust. Customer satisfaction also significantly effects customer loyalty (retention) (Peltier et al, 2002).
Several marketing literature states that switching cost effects positively towards customer retention. Increasing switching cost for the customer becomes a common strategy to improve customer retention which can affect customers not to switch (Ranaweera and Prabhu, 2003). Switching cost is a contributing factor in maintaining a relationship, thus the higher switching cost lesser the customer tends to switch. (Colgate and Lang, 2001).
Brand is a name, term, sign, symbol or design, or a combination of all that is expected to identify a seller’s product to a product sold by a group of sellers and it is expected to differentiate the product from competitor products (Kotler and Keller, 2006). Building and maintaining trust in the brand is the core of brand equity, because it is a key characteristic of a successful long-term relationship between the company and its customers (Garbarino and Johnson, 1999). One factor that can increase the probability of customer interest in a repeated purchasing behavior is the trust (Walczuch et al, 2001). Interest of loyal customer behavior (retention) is greatly influenced by their trust in the goods or services (Liu et al, 2003). The existence of trust is the main driver for customer retention because the trust can create an exchange of valuable relationship. Researches by Chen et al (2004) and Dimyati
(2011) concluded that trust have significant positive effect on customer loyalty. Trust towards the brand in this context does not focus only on behavior towards a brand, but also related to the repeated purchasing behavior. Therefore, brand loyalty underlies continuous relationship and also maintains valuable and important relationships created from the trust towards the brand.
In cellular telecommunication sector, customer retention is vastly determined by the usage intensity of services provided by the operator to customers. The advantages provided by a cellular card operator becomes the basis for a customer to prioritize the use of that specific cellular card compared to others. Hence, there needs to be a research on the variables that can be used as the basis to build a strategy to influence customer retention in this era of intense competitive conditions in the cellular phone sector. Based on the previous business phenomenon and research results, the issues addressed in this research paper towards simPATI card customers includea) how is the effect of customer satisfaction towards customer trust in the brand?; b) how is the effect of switching cost towards customer trust in the brand?; c) how is the effect of customer satisfaction towards customer retention?; d) how is the effect of switching cost towards customer retention?; and e) how is the effect of customer trust towards customer retention?.
The aim of this research is to examine the effects of: a) customer satisfaction towards customer trust in the brand; b) switching cost towards customer trust in the brand; c) customer satisfaction towards customer retention; d) switching costs towards customer retention; and e) customer trust in the brand towards customer retention.
LITERATURE REVIEW AND CONCEPTUAL FRAMEWORK: CUSTOMER SATISFACTION:
Customer satisfaction is a person's feeling of satisfaction or disappointment caused by the perceived performance of a product when compared to its expectation (Kotler and Keller, 2006). The level of customer satisfaction can determine a company’s ability to survive in a long term to earn profit. It does not mean companies should only maximize customer satisfaction, but the company must earn profit through ensuring customer satisfaction. In order to gain victory, the companies should truly have the ability to provide satisfaction to its customers. The basic goal of a company should be to manage and improve customer satisfaction in order to increase customer retention (Fornell, 1992). A research in the telecommunications industry discovered that 10% increase in customer satisfaction can be predicted to 2% increase in customer retention rate and 3% increase in interest revenue. Based on these data, it is concluded that customer satisfaction act as a main indicator of customer retention, revenue, and improved corporate income. In addition to effect towards customer trust, customer satisfaction significantly effects customer loyalty (retention) (Peltier et al, 2002). Customer satisfaction is the customer's feelings that was considered as an assessment result on the perceived performance of their chosen SimPATI card to meet or exceed their expectations. Alike the indicators developed by Hennig-Thurau et al (2002), this variable is measured by three indicators, namely satisfied with the simPATI prepaid card network coverage; satisfied with the simPATI prepaid card signal reception; and satisfied with the advantages of the simPATI prepaid card.
SWITCHING COST:
Switching cost is the cost to be incurred by the consumer when switching to another service provider which will not be experienced if a consumer remains loyal to their current service provider (Lee, Lee, and Feick, 2001). This cost is related to the perceived risk, which is the customer’s perception of adverse uncertainties and consequences for purchasing other products or services. It appears to be an important reason for customers not to switch to another service provider frequently (Dwyer and Tanner, 1999). Switching cost can also create a consumer dependency on a provider (Morgan and Hunt, 1994). When there are many service providers in a market and at a low switching cost, most dissatisfied customers are likely to switch to another service provider; whereas if there is high switching cost, customers tend not to switch (loyal) (Lee, Lee, and Feick, 2001). Customers will also remain loyal to a company if customers feel they receive a greater value than other companies. Switching cost is
measured by three indicators according to Klemperer (1995), namely: procedural switching cost; financial switching cost; and relational switching cost.
TRUST IN THE BRAND:
Brand is not only a symbol but also an entity (something that has unique and distinct existence) which can be easily recognized and promise certain values (Nicolino, 2004). Brand is actually a reflection of promises about the product promoted by producer to the consumer about the product’s quality. Hence, there needs to be a trust in the brand. Its the belief that a person will find what they want in a partner exchange. In branding, trust is the willingness or the want of consumers in facing the risk associated with the notion that the purchased brand will provide a positive or favorable results (Lau and Lee, 1999). According to Keller (2003), brand lowers the risk in using the product. Consumers often interact with brands as if the brand is human, thus the similarities between the consumer self-concept to the brand can build trust towards the brand. Trust involves the willingness of a person to behave particularly because of the belief that its partner will deliver what he/she expected, and an expectation that is generally owned by someone that the word, promise or statement of other people can be trusted. It is the emerging force of customer retention, because the trust can create a relationship exchange with great value to both parties. Herbiniak (in Morgan and Hunt, 1994) stated that relationship, which is characterized by trust, is highly valued on parties with a desire to commit or bind themselves to a particular relationship. Commitment is prone to change without involving trust aspects. Therefore, trust in the brand became the basis of ongoing relationship in maintaining valuable and important relationships created by the existence of the trust. Trust in the brand is the customer’s trust behavior toward the simPATI prepaid card brand, which is measured through three variable indicators according to Lau and Lee (1999), namely trust in the company competence (Telkomsel) in the Information Technology sector; trust in the reliability of simPATI prepaid card; and trust in conformity of simPATI prepaid card towards the customer's personality.
CUSTOMER RETENTION:
Based on few research conducted so far, customer retention is considered as customer loyalty and used interchangeably (Hesket et al, 1994). However some researchers assert that customer retention is the relationship that exists between customer loyalty with profitability (Anderson and Mittal, 2000). It is a form of loyalty-related behavior (behavioral loyalty) which can be measured using consumer purchasing behavior that is shown by the high frequency of consumers purchasing a product, while loyality refers more about the attitudinal loyalty measured by the components of behaviors, beliefs, feelings, and the will to re-purchase (Buttle, 2004). Although loyalty is very significant, it is very difficult to measure and monitor due to which there is a need for measuring loyalty behavior i.e., customer retention. Customer retention emphasizes marketing activities in retaining customers. Customer retention focuses on the development of marketing activities that lead to repeated purchasing behavior on the managerial aspects of marketers and customers (Hennig-Thurau and Klee, 1997). According to Ranaweera and King (2003), customer retention is defined as a customer’s tendency to stay in the future against other service providers. Developing and maintaining long-term customer retention becomes the key for survival and growth of any company. Customer retention is a form of customer loyalty associated with the intensity of customer behavior to stay using the simPATI prepaid card that is marked with the re-purchase of the simPATI prepaid card. This is measured by three variable indicators, namely intensively refilling the simPATI prepaid card, incentives in using the simPATI prepaid card and the priority in using the simPATI prepaid card.
CONCEPTUAL FRAMEWORK:
Based on the research problems, aims, and literature review, the conceptual framework of the research has been constructed as shown in Figure 1.
Figure 1: Conceptual Framework
The research hypotheses which will be tested are as follows:
H1 is the customer satisfaction effects significantly positive towards customer trust of the simPATI
brand in Jember regency
H2 is the switching cost effects significantly positive towards customer trust of the simPATI brand
in Jember regency
H3 is customer satisfaction effects significantly positive towards customer retention of the simPATI
card in Jember regency
H4 is the switching cost effects significantly positive towards customer retention on the simPATI
card customers in Jember regency and
H5 is customer trust’ in the brand effects significantly positive towards customer retention on
simPATI card customers in Jember regency.
RESEARCH METODOLOGY:
The research population is the entire resident of Jember regency, East Java, Indonesia who uses the simPATI cellular card. Jember was chosen as sampling location due to the community in Jember which has heterogeneous characteristics that could represent heterogeneity of the society in Jember regency. The purposive sampling technique was applied with sample criteria as follows: (a) at least 15 years old; (b) has used the simPATI prepaid card at least 6 months after activating the card; and (c) residing in the town of Jember. A total sample of 120 respondents were determined by the number of variable indicators multiplied by 10, referring to Roscoe (in Sekaran, 2003) who stated that (a) a sample size of more than 30 and less than 500 are appropriate for most research (b) in a multivariate research, sample size should be several times (preferably 10 times or more) greater than the number of variables in the research. Furthermore, Ferdinand (2006) describes that in connection with the use of the SEM analysis, the sample size depends on the number of variable indicators used in all of the latent variables.
The number of samples should equal to the number of indicators multiplied by 5 to 10. The variables analyzed in this research consisted of two exogenous variables, namely customer satisfaction (X1) and
switching cost (X2), an intervening endogenous variable, namely trust in the brand (Y1); and a bound
endogenous variable, namely customer retention (Y2). The research design applied confirmatory research by
collecting data through surveys. Primary data collection was done by distributing questionnaires to the respondents, while secondary data collection was collected using documentation techniques. Data measurement for all four latent variable indicators used the Likert scale assessment scores with five answer choices ranging from 1 to 5. This scale is an interval scale (Indriantoro and Supomo, 2002; Sekaran, 2003). Based on the conceptual model in Figure 1, a model of SEM can be constructed as follows:
Y1 = λ1.1X1 + λ1.2X2 + Ϩ1; Y2 = λ2.1X1 + λ2.2X2 + Ϩ2;Y2 = λ2.1X1 + λ2.2X2 + β2.1Ϩ3 Trust in Brand (Y1) Customer Satisfaction (X1) Switching Cost (X2) Customer Retention (Y2) X1.1 X1.2 X1.3 X2.1 X2.2 X2.3 Y1.1 Y1.2 Y1.3 Y2.1 Y2.2 Y2.3 H3 H5 H4 H2 H1
λ = path coefficient of exogen to endogen variable; β = path coefficient of endogen to exogen variables; Ϩ = error model
RESULT AND DISCUSSION:
INSTRUMENT VALIDITY AND RELIABILITY:
Validity and reliability tests of the research instrument utilized confirmatory factor analysis on each of the latent variables. Indicators of a latent variable are considered valid if it has a significant loading factor of α (0.05). The research instrument is considered valid unidimensional if it has a value of Goodness of Fit Index (GFI)>0.90. Instrument reliability test employed the construct reliability with the following formula:
Construct-reliability =
j
Loading)
Std
(
Loading)
std
(
2 2
Standard Loading is obtained directly from a standardized loading for each indicator (from AMOS calculations). εj is error measurement of each indicator. Error measurement is equals to 1 – acceptable reliability is ≥ 0.60.
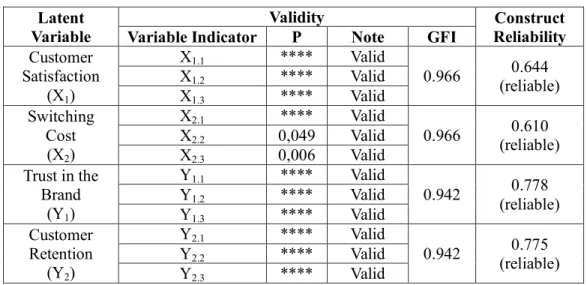
The instrument validity and reliability tests results (Table 1 in appendix) show that all the indicators of all latent variables are valid and reliable which is indicated by the t-value (CR) for the loading factor (λ) all variable indicators of all latent variables have a value greater than the critical value (>1.96) at 0.05 significant level. Furthermore, the significance probability value is smaller than ά (0.05), and construct reliability of all latent variables is greater than the recommended value (≥0.60).
The prerequisites that must be met in the Structural Equation Modeling (SEM) model are, a normal multivariate data, multi-collinearity or singularity does not occur, and there is no outlier in the research data. Normality test result (CR) define the CR value of 0.416 that lies between -1.96 ≤ CR ≤ 1.96 (ά = 0.05), which means the multivariate data is normal. Furthermore, the data is also univariate normal indicated by all the critical ratio value of all the indicators located between -1.96 ≤ CR ≤ 1.96. Multi-collinearity test determines the determinant of the sample covariance matrix value of 13.462 (there is no problem of multi-collinearity and singularity in the analyzed data). The outlier test result showed that none of the cases have Malahnobis distance value greater than 21.026 (χ: df = 12; α = 0.05), thus inferred
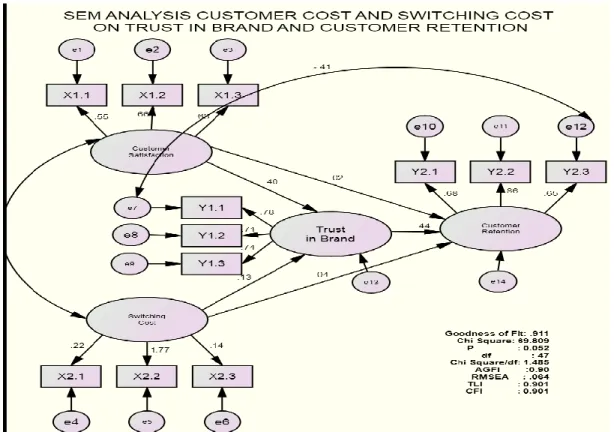
that there is no multivariate outlier in research data. The suitability test result of SEM model (Table 2 and Figure 2 in appendix) shows the resulting models have met the required criteria for the required model, hence the produced SEM model is viable to be used in the data analysis (hypothesis testing). Causality test results between the research variables (hypothesis testing) with the SEM model are presented in Table 3 in appendix.
HYPOTHESIS 1:
Customer satisfaction effects significantly positive towards customer trust in the brand of simPATI card di Jember regency.
The analysis results (Table 3) confirm the second Hypothesis 2 which is consumer satisfaction effects significantly positive towards customer trust in the simPATI card brand in the Jember regency, which is indicated by the positive path coefficient of 0.549 with CR of 2,614,032 (CR> 1.96) and obtained significant probability (P) of 0.009 smaller than significance level (α) that is required 0.05 (P <α). It is inferred from above that customer satisfaction directly effects significantly positive towards trust in brand, which means that if customer satisfaction rises, then the customer trust in the brand will also increase, and vice versa i.e., if the customer satisfaction decreases, customer trust in the brand will also falters. The results showed that the customer assessment statement to the overall customer satisfaction indicators show that majority of respondents felt high satisfaction of 47.77%, the remaining 8.20% felt a very high satisfaction, 39.83% is neutral, and 4.23% felt low satisfaction. This condition means that the customer who has received high satisfaction on the perceived performance of the simPATI card which includes low price rates, wide and strong network coverage, clear voice quality, complete features, and the creation of the customer satisfaction will be able to affect the formation of trust in the
simPATI card brand.
This finding can be explained by logical argument that customer satisfaction is the feeling of pleasure or disappointment of someone caused by the perceived performance of a product than its expectation (Kotler and Keller, 2006). To conclude, the creation of customer satisfaction will affect the creation of customer trust in the brand. This research supported the research conducted by Dimyati (2011) who concluded that customer satisfaction effects significantly positive towards customer trust. The current results also show that customer satisfaction effects significantly positive towards customer trust.
HYPOTHESIS 2:
Switching cost effects significantly positive towards customer trust in simPATI card brand in Jember regency. The analysis results (Table 3) showed that the hypothesis 2 is accepted shown by the positive path coefficient of 0.666 with CR of 2.032 (CR> 1.96) and achieved significant probability (P) of 0.042 which was smaller than significance level (α) that is required 0.05 (P <α). Thus it can be said that switching cost effects significantly positive towards customer trust in the brand of simPATI card in Jember regency. This means that if the switching cost increases, then the customer trust in the brand will increase, and vice versa i.e., if the switching cost decreases, then the customer trust in the brand will automatically decrease.
Scientifically, the acceptance of hypothesis 2 in switching cost, which is the cost incurred by the consumer when switching to another service provider, is clear i.e., higher the switching cost for customers more the customer are encouraged to continue using the same product offered by the company, where in this regard is the simPATI card. This condition occurs because the customer does not want to bear the risk of uncertainty and adverse consequences due to purchasing other products or services. The research result were in accordance with the switching cost theory and appears to be an important reason for customers not to switch to another service provider (Dwyer and Tanner, 1999). Switching cost has been identified as a contributing factor in maintaining a relationship, so that the higher switching cost will increase customer retention (Colgate and Lang, 2001).
HYPOTHESIS 3:
Customer satisfaction effects significantly positive towards customer retention of simPATI card di Jember regency. The result analysis (Table 3) showed that the results of hypothesis 3 is rejected, which means that customer satisfaction has no effect on customer retention of simPATI card in Jember regency, which is indicated by the positive path coefficient of 0.003 with a CR of 0.019 (cr <1.96) with a significance probability value of 0.985 (P> α). This finding means that the debtor's satisfaction on the perceived performance of their chosen simPATI card has not been able to influence the creation of customer retention. This situation occurs because customer satisfaction of simPATI card in Jember regency is included in the customer category of merely satisfied or in the satisfaction confirmation category, where the actual simPATI card performance perceived by customers were relatively the same as expected. They have not reached a very high satisfaction or the positive confirmation satisfaction category, where the actual simPATI card performance perceived by customers seems to be larger than expected performance, which will result in the emotional satisfaction that could lead to the creation of customer retention. This argument is scientifically supported by the research results on the customer assessment statement of the overall customer satisfaction indicators which shows that majority of the respondents felt high satisfaction (merely satisfied).
These findings support the theory of Beckett et al (2000) who stated that customers easily change their purchasing behavior and more often leave products with less customer attention, and then move to another product. This is due to the fact that currently most customers are discerning customers who are able to properly assess and evaluate the products/services they will choose to meet their needs. The research results also support the researches of Bitner (1990) who noted that there is no significant effect on the satisfaction in customer retention (customer loyalty). Jones and Sasser (1995) found the fact that customers are satisfied, but they use the services of other service providers during the need of future services.
satisfaction which has the capability to form true customer retention is actually up to a certain level of satisfaction that cannot be provided by other service providers, which is a pleasant satisfaction (Oliver, 1997) or a pleasant surprise (Zeithaml et al, 1996). The actual loyalty level begins with a very satisfied assessment towards what it receives from the company (Jones and Sasser, 1995). The main cause of any service customer to become loyal is if they are very satisfied with the received services. The circumstances which occurred on the simPATI card customer card in Jember regency is only satisfaction, thus the occurred satisfaction effects insignificantly in shaping customer retention.
HYPOTHESIS 4:
Switching cost effects significantly positive towards customer retention of simPATI card in Jember regency. Table 3 provides information that the research hypothesis 4 is rejected, which means that switching cost has no effect on customer retention of simPATI card in Jember regency. This is indicated by the positive path coefficient of 0.128 with CR of 0.584 (CR <1.96) with a significance probability value of 0.559 (P> α). This finding means that the switching cost is not a barrier/uncertainty risk and adverse consequences for simPATI card customers for purchasing other cellular phone cards.
Logically, the scientific findings of this research can be explained that the competition is increasingly tougher in the telecommunications field, characterized by the number of cellular operators popping up to make cellular card customers easily move from one operator to another without any significant barriers and low switching cost. The research results showed that the respondents assessment statement on the simPATI card switching cost towards another card provider expressed the majority (47.77%) is low, the remaining 28.43% said neutral, 23.1% expressed high, and last 2.53% stated very high. Therefore, majority of simPATI card customers in the Jember regency can switch card to other operators at a low cost. SimPATI card customers also felt no difficult procedures in switching to another card provider and there are more SIM Card sellers with a low price in the market.
This finding is consistent with the theory that when there are many service providers in the market, then at a low switching cost, any dissatisfied customers are likely to switch to another provider, whereas with a high switching cost, customers tend not to switch (stay loyal) (Lee and Feick, 2001).
HYPOTHESIS 5:
Trust in the brand effects significantly positive towards customer retention of simPATI card in Jember regency. Based on the analysis results (Table 3), it can be concluded that hypothesis 5 is accepted, which is the trust about the brand effects significantly positive on customer retention of simPATI card in the Jember regency. This is indicated by the positive path coefficient of 0.427 with CR of 3056 (CR> 1.96) with a significance value probability of 0.002 (P <α). This means that if the customer trust in the simPATI card brand is increased, the customer retention will rise, and vice versa i.e., if the customers trust in the simPATI card brand decreased, it will lower the simPATI card customer retention. This condition means that the customer has trust in the simPATI card brand. Empirically, this finding is supported by the answers of research respondents who feel very confident towards the competence of Telkomsel as the simPATI card manufacturer company that have long operations to provide telecommunications services in Indonesia supported by a competent parent company, namely PT. Telkom has won many awards and provides adequate service centers.
The research findings are consistent with the theory of one factor that can increase the interest probability of consumer repurchasing behavior is the trust (Walczuch et al, 2000). Interest in consumer retention behavior is strongly influenced by their trust in the product or service (Kotler et al, 2010). Trust has a significant positive effect on customer loyalty (retention) (Chen et al, 2004; Dimyati, 2011).
CONCLUSION:
Based on the analysis and discussion of the research, the following summary has been developed. Customer satisfaction effects significantly positive towards customer trust of simPATI card brand in the Jember regency (hypothesis 1 is accepted). This condition means that if the customer satisfaction rises, then the customer trust in the brand will increase, and vice versa. This finding proves that the customer
who has higher satisfaction on the perceived performance of the simPATI card, which includes low rates, wide network coverage, a strong and clear voice quality, complete features, and creation of customer satisfaction, will be able to affect the formation of trust in the simPATI brand. Switching cost effects significantly positive towards customer trust in the simPATI card brand in the Jember regency (hypothesis 2 is accepted). This means that if the switching cost increases then the customer trust in the brand will automatically increase, and vice versa i.e., if the switching cost decreases then customer trust in the brand will lose. Therefore, higher the switching cost for simPATI card customers will encourage them to continue using the simPATI card product. In turn, lower the switching cost for simPATI customers encourage them to stop using the simPATI card product. Customer satisfaction does not positively affected towards simPATI card customer retention in the Jember regency (hypothesis 3 is rejected). This finding means that the customer satisfaction on the perceived performance of their chosen simPATI card has not been able to influence the creation of customer retention. This situation occurs because simPATI card customer satisfaction in Jember is included in the customer category of merely satisfied or in the satisfaction confirmation category, but they have not reached the category of positive satisfaction confirmation which will result in emotional satisfaction leading to the creation of customer retention. Switching cost has no positive effect on simPATI card customer retention in the Jember regency (hypothesis 4 is rejected). This finding means that switching cost is not yet a barrier/uncertainty risk and adverse consequence for simPATI card customers for buying cellular phone cards from other providers. Trust in the brand effects significantly positive towards simPATI card customer retention in the Jember regency (hypothesis 5 is accepted). This means that if the customer trust in the simPATI card brand is increased, then it will increase customer retention, and vice versa.
The implications of this research findings are formulaic, confirmative, and explanative in a practical input for the cellular phone provider company (in this case, Telkomsel simPATI card manufacturer) and also for the marketing research field, in cases of showing how cellular phone companies benefit from the implementation of customer satisfaction and switching cost to the realization of customer trust in the brand in order to create customer retention; demonstrating the role of customer satisfaction and switching cost in creating customer trust in the brand and customer retention; expanding insights on the need to provide high customer satisfaction and high switching cost in developing marketing strategies and tactics on cellular phone operator companies; providing high attention to customer satisfaction and switching cost to build customer trust in the brand for creating customer retention for the product and improving the attention of cellular operator company management to customer vulnerability in switching from one operator to another operator.
REFERENCES:
[1] Anderson, F. W. and V. Mittal. (2000). Strengthening the Satisfaction -Profit Chain. Journal of Service Research, Vol. 3, No. 2, 107-120.
[2] Barnes, J. G. (2003). Establishing Meaning Customer Relationships: Why Some Companies and Brands Mean More to Their Customers. Journal of Managing Service Quality, Vol. 17. No. 1, 99-120.
[3] Beckett, A. et al. (2000). An Exposition of Customer Behavior in the Financial Service Industry. International Journal of Bank Marketing,Vol.18. No. 1, 15-26.
[4] Bitner, M. J. (1990). Evaluating Service Encounter: The Effects of Physical Surroundings and Employee Response. Journal of Marketing, Vol. 54, 69-82.
[5] Buttle, F. (2004). CRM: Concepts and Tools. Amsterdam: Elseiver.
[6] Chen, Z. et al. (2004). Consumers Value Perception of an E-store and Its Impact on E-store Loyalty Intention, Paper Presented and Published at The AMS/ACRA7th Triennial Retail Conference. http://www.cfs.purdue.edu/csr/E-Enterprise%20Research/CSR/E-store%20 attributes.doc.
[7] Colgate, M. and B. Lang. (2001). Switching Barriers in Consumer Market: An Investigation of the Financial Services Industry. Journal of Consumer Marketing, Vol.18. No. 4, 332-347.
[8] Dimyati, Mohamad. (2011). Theoretical Testing On Service Quality and Product Innovation of Small-Micro Credit Banks: A Case Study. Journal Of Economics, Business & Accountancy Ventura, Vol. 14. No. 3 December, 225-238.
[9] Direktorat Jenderal Pos dan Telekomunikasi. (2010). Data Statistik Postel. Jakarta.
[10]Dwyer, F.R and J.F. Tanner. (1999). Business Marketing: Connecting Strategy, Relationship and Learning. Boston: McGraw-Hill.
[11]Ferdinand, A. T. (2006). Metode Penelitian Manajemen: Pedoman Penelitian untuk Penulisan Skripsi, Thesis, dan Disertasi. Semarang: BP-UNDIP.
[12]Fornell, C. (1992). A National Customer Satisfaction Baromater: The Swedish Experience.
Journal of marketing, Vol. 56, 6-21.
[13]Garbarino, E. and M.S. Johnson. (1999). The Different Roles of Satisfaction, Trust, and Commitment in Customer Relationships. Journal of Marketing, Vol. 63, 70-87.
[14] Hennig-Thurau, T. Et al. (2002). Understanding Relationship Outcomes An Integration of Relational Benefits and Relationship Quality. Journal of Service Research, Vol. 4. No. 3, 230-247. [15]Heskett, J. L., T. O. Jones, G. W. Lovemann, W. E. Jr. Sasser, and L., A. Schlesinger. (1994).
Putting the Service-Profit Chain to Work. Harvard 170d Business review, Vol. 72. No. 2,164-
[16]Indriantoro, Nur. dan Bambang Supomo. (2002). Metodologi Penelitian Bisnis, Edisi Pertama, Yogayakarta: BPFE UGM.
[17]Jones, Thomas O., and Sasser W. Earl Jr. (1995). Why Satisfied Customer Defect. Harvard Business Review, Vol. 73. No. 6, 88-100.
[18]Keller, K.L. (2003). Strategic Brand Management. Singapore: Person Education Inc.
[19]Klemperer, P. (1995). Competition When Consumers Have Switching Costs: An Overview with Application to Industrial Organization, Macro Economics, and International Trade. The Review of Economic Studies, Vol. 62, 515-539.
[20]Kotler, Philip and Kevin Lane Keller. (2006) Marketing Management 12e, Pearson International Edition, Upper Saddle River, New Jersey: Pearson Prentice Hall Inc.
[21] Kotler, Philip dan Hermawan Kertajaya, Iwan Setaiawan. (2010). Marketing 3.0. Jakarta: Erlangga. [22] Lee, J., J. Lee and L. Feick. (2001). The Impact of Switching Coston the Customer Satisfaction –
Loyalty Link: Mobile Phone Service in France. Journal of Service Marketing, Vol. 15. No. 1, 35-48.
[23]Liu, C., et al. (2003). Beyond Concern - A Privacy – Trust - Behavioral Intention Model of Electronic Commerce. Information and Management, Vol. 42. No. 1 December, 127-142.
[24]Lau, G. T. and S. H. Lee. (1999). Consumer’s Trust in Brand and The Link to Brand Loyalty.
Journal of Market Focused Management, Vol. 4. No. 4, 341-370.
[25]Morgan, Robert M., Shelby D., Hunt. (1994). The Commitment-Trust Theory of Relationship Marketing. Journal of Marketing, Vol. 58, 20-38.
[26]Nicolino, P. F. (2004). The Complete Ideal’s Guide Brand Management. Jakarta: Prenada. [27]Oliver, Richard L. (1997). Satisfaction: A Behavioral Perspective on The Consumer. New York:
The McGraw-Hill Companies Inc.
[28]Peltier, James W. John A. Schibrowsky, Chistopher R. C. (2002). Patient Loyalty That Lasts a Lifetime, Marketing Health Service, Vol.22, 29.
[29]Ranaweera, C. and J. Prabhu. (2003). The Influence of Satisfaction, Trust and Switching Barriers on Customer Retention in a Continuous Purchasing. International Journal of Service Industry Management, Vol. 14. No. 4, 374-395.
[30]Sekaran, Uma. (2003). Research Methods for Business: A Skill Building Approach. USA: John Wiley and Sons Inc.
[31]Walczuch, R., et al. (2001) Psychological Determinants for Consumer Trust in E-Retailing.
Proceedings of the Eigth Research Symposium on Emerging Electronic Markets (RSEEM 01),
University of Maastricht, International Institute of Infonomics, The Netherland.
[32]Zeithaml, et al. (1996). The Behavioral Consequences of Service Quality, Nature and Determinants of Customer Expectations of Service.Journal of Marketing, Vol. 60 April, 31-46.
APPENDIX
Table 1: Validity and Reliability Test Results of Research Variable Indicators Latent
Variable
Validity Construct
Reliability Variable Indicator P Note GFI
Customer Satisfaction (X1) X1.1 **** Valid 0.966 (reliable) 0.644 X1.2 **** Valid X1.3 **** Valid Switching Cost (X2) X2.1 **** Valid 0.966 (reliable) 0.610 X2.2 0,049 Valid X2.3 0,006 Valid Trust in the Brand (Y1) Y1.1 **** Valid 0.942 0.778 (reliable) Y1.2 **** Valid Y1.3 **** Valid Customer Retention (Y2) Y2.1 **** Valid 0.942 0.775 (reliable) Y2.2 **** Valid Y2.3 **** Valid Source: Data Analysis Results with the AMOS 18 Program.
Table 2: The SEM Model Suitability Index
Criteria Cut Off Value Result Note
Chi Square Expected < Chi Square Table
(χ:df= 47; α=0.05) = 70.011 69.809 Fulfilled
df Must be positive 47 Fulfilled Sig, Probability ≥ 0.05 0.052 Fulfilled RMSEA ≤ 0.08 0.064 Fulfilled GFI ≥ 0.90 0.911 Fulfilled AGFI ≥ 0.90 0.900 Fulfilled Chi Square/df ≤ 2 atau 3 1.485 Fulfilled TLI ≥ 0.95 0.901 Fulfilled CFI ≥ 0.95 0.901 Fulfilled
Source: Data Analysis Results with the AMOS 18 Program.
Figure 2: Customer Satisfaction and Switching Cost towards Trust in Brand and Customer Retention of SimPATI Card
Table 3: Causality Test Results among Research Variables Variable Path Coefficient CR Probability Note
Y1<---X1 0.549 2.614 0.009 Significant
Y1<---X2 0.666 2.032 0.042 Significant
Y2<---X1 0.003 0.019 0.985 Insignificant
Y2<---X2 0.128 0.584 0.559 Insignificant
Y2<---Y1 0.427 3.056 0.002 Significant Source: Data Analysis Results with the AMOS 18 Program.