Csikor, L. and Pezaros, D. P. (2018) End-host Driven Troubleshooting
Architecture for Software-Defined Networking. In: IEEE GLOBECOM
2017, Singapore, 4-8 Dec 2017, ISBN 9781509050192
(doi:
10.1109/GLOCOM.2017.8254759
)
This is the author’s final accepted version.
There may be differences between this version and the published version.
You are advised to consult the publisher’s version if you wish to cite from
it.
http://eprints.gla.ac.uk/147957/
Deposited on: 14 September 2017
Enlighten – Research publications by members of the University of Glasgow
End-host Driven Troubleshooting Architecture for
Software-Defined Networking
Levente Csikor and Dimitrios P. Pezaros
Networked Systems Research Laboratory (netlab), School of Computing Science, University of Glasgow Email: [email protected]; [email protected]
Abstract—The high variability in traffic demands, the advanced networking services at various layers (e.g., load-balancers), and the steady penetration of SDN technology and virtualization make the crucial network troubleshooting tasks ever more challenging over multi-tenant environments. Service degradation is first realized by the users and, as being the only one having visibility to many relevant information (e.g., connection details) required for accurate and timely problem resolution, the infrastructure layer is often forced upon continuous monitoring resulting in wasteful resource management, not to mention the long time frames. In this paper, we propose an End-host-Driven Troubleshooting architecture (EDT), where users are able to share the application-specific connection details with the infrastructure to accelerate the identification of root causes of performance degradation, and to avoid the need for always-on, resource-intensive, and network-wide monitoring. Utilizing EDT, we provide some essential tools for real end-to-end trace routing (PTR), identifying packet losses, and carry out hop-by-hop latency measurements (HEL). In contrast to existing proposals, PTR traces the practical production traffic without the need of crafted probe packets by means of careful tagging mechanisms and additional ephemeral capturing flow rules. Besides involving negligible data plane deterioration, in certain cases PTR can drastically reduce the time needed to find a traversed path compared to existing solutions. Finally, by means of individual network functions, HEL measures the latency of each link along the found path without involving the controller into the calculation, hence resulting in significant reduction of control plane overhead.
Keywords—Network measurement, SDN, NFV, troubleshoot
I. INTRODUCTION
Modern enterprises heavily depend on the smooth oper-ation of their infrastructures, therefore service availability is paramount in not just maintaining existing customers, but also winning over new ones in a highly competitive market. Any level of service degradation reduces costumer confidence and results in loss of revenue [1]. Thus, when an issue arises, accurate and timely diagnosis and problem resolution are crucial to reduce the possible negative effects on business. However, troubleshooting tasks, especially lo-calizing the faulty elements unambiguously, are becoming more challenging due to the advanced networking services in various layers (e.g., load-balancers, caches, accelerators), and the continuously increasing number of traffic demands of todays applications (e.g., processing and storage services running in a data center (DC)). Furthermore, the increasingly popular SDN paradigm with the inherent exposition of new
levels of abstraction just makes the whole process even harder. Service degradation is first realized by the appli-cation layer, and in many cases the users are the first to alert the operator to a service outage [1]. Since all related communication details (e.g., used TCP ports) required for accurate and effective intervention are only available at the application layer, initial inspections are usually conducted by the end-hosts, however since they have no access or even visibility to the underlying infrastructure, they can only become aware of some aggregated measurements data obtained by, for instance, ping or traceroute. Besides the fact that these solutions are barely suitable for an SDN network [2], the data they provide is neither sufficient to spot the roots of the problem [3], nor does it reveal whether the problem resides within their domain. In contrast, even if the infrastructure does have the visibility and access to some information, the timely realization of a possible service degradation would require an always-on, resource-intensive, and network-wide monitoring. However, if the infrastructure was aware of “what-to-look-for-when”, instead of “recognise-everything-at-anytime”, it would not just ease and accelerate the identification of the root causes, it would also involve much less resources due to the highly reduced monitoring time frame.
In this paper, we make the first step towards this di-rection by presenting an End-host-Driven Troubleshooting (EDT) architecture. In EDT, when a service level degradation occurs, a diagnosis isinitiated by the end-hostsbased on the relevant application level information, butcarried out by the infrastructure using low-level tools. Utilizing our proposed architecture, we provide some essential tools for real end-to-end trace routing,identifying packet lossesand carry out
hop-by-hop end-to-end latency (HEL)measurements in SDN networks, all initiated by users. In contrast to existing trace route proposals, our Practical Trace Route (PTR) application not just requires no specially-crafted probe packets, but also enables to locate packet loss at the same time. To this end, PTR traces the practical production traffic by careful tagging mechanisms and additional ephemeral capturing flow rules that, as it will be shown, does only introduce negligible data plane performance deterioration. Furthermore, in certain cases, it can drastically reduce the time needed to find a path compared to existing solutions. Finally, in order to investigate which switching appliance contributed the most to an increased latency, we built HEL on top ofping-based
network functions (NFs) deployed along the path calculated by PTR. The idea behind HEL is that the small NFs can
Fig. 1: A hypothetical service provider’s network offering cloud and access gateway services.
individually measure the latencies of the links between the switches without involving the controller into the calculation, hence resulting in significant reduction of control plane overhead.
The rest of the paper is organized as follows: In Sec. II, the proposed architecture and typical use cases are presented, and in Sec. III we introduce HEL. In Sec. IV, we present our practical trace route mechanism in detail, while in Sec. V, we evaluate its impact on performance and the time it requires to trace a path. Finally, in Sec. VI we conclude the paper.
II. PROPOSEDARCHITECTURE
A. Environment
Since EDT can be realized in any SDN network (here, we concentrate on OpenFlow exclusively), we considered a hypothetical service provider who offers an access gateway that aggregates subscribers located behind customer end-points to the Internet and provides cloud services running in its private data center (see Fig. 1). In particular, the data center consists of4racks (Rack 1, 2, 3, and 4, respectively) and2 spine switches (S1 and S2) that are connected to the gateway. On the other hand, its gateway service consists of, for brevity, one switch as the provider endpoint (PE) supplying wired and wireless Internet access toUser 1 and
User 2, respectively. To meet the desired quality of service, e.g., minimize latency [4], forwarding inside the domain is based on shortest paths [5] and managed by a centralized controller. The solid red thick line between one of the servers in Rack1 and the gateway marks a heavy load on that path causing some congestion and delays.
B. Typical Operational Problems
Next, we sketch up three scenarios: first, assume that
Tenant A runs latency-sensitive e-commerce or banking application [6], [7]. Such applications usually have several distributed components (e.g., storage (S), front-end (F)) that
require low-latency communication paths to reduce applica-tion response times. However, due to the high background traffic going through one of the links in common with the path Tenant A’s traffic traverses, Tenant A realizes that retrieving the data (from Rack 3 at IP address 10.3.1.14) necessary to provide to the users communicating with the front-end (residing in Rack 1 at IP address 10.1.2.3) takes more time than usual. Second, those overloaded links also affectTenant B’s securely accessible web service (available at HTTPS port 443) locally found in Rack 4 at IP address 10.4.2.1. For brevity, we neglect to indicate its public IP address translated at the gateway. Suppose that one of its users (User 1, whose Internet access is also supplied by the same provider) also suffers from the increased response time. Last but not least, consider User 2 (a regular subscriber), whose multiplayer online gaming experience is also degraded by high latency, however his traffic completely avoids the overloaded links meaning that the problem resides outside the domain.
C. End-host-Driven Troubleshooting
EDT can be an extension to any SDN controller and based on a REST API (denoted by EDT Module in Fig. 1) it allows users to share application-specific information with the infrastructure to help narrowing the problem space. Next, we briefly walk through the whole process considering one of the latency-related problems mentioned above. Since from an operational point of view each of them is similar, we concentrate here onTenant A’s case. Nevertheless, note that in Fig. 1 the arrow types and their colors correspond to one of the scenarios, i.e., therequests and the relatedtraffic flows are marked by thin and thick, respectively, green dashed arrows for Tenant A, orange solid arrows forTenant B, and dotted blue arrows forUser 2, respectively. WhenTenant A
experiences an increased latency between two applications, she initiates a measurement by sharing the corresponding communication details with the infrastructure in the granular-ity of 5-tuples (src ip, src port, dst ip, dst port, eth type). Consequently, the infrastructure traces down the path the applications’ traffic traverse by PTR (see in Sec. IV), then initiates a hop-by-hop latency measurement (see in Sec. III) to find out which forwarding element contributes the most to the delay. Once the measurement has been carried out the service provider is able to investigate further the root cause.
D. Customisable Privacy
Note that the infrastructure can decide how much infor-mation it sends back as responses to the users. In particular, it might share the hop-by-hop latency with the tenants without revealing the actual nodes along the paths; or in case of User 2, the infrastructure can notify him to look for an alternative multiplayer service to connect to, as his traffic does not suffer high latency inside the domain. On the other hand, a similar privacy strategy applies for the reverse direction as well. For instance, in case ofTenant B, he is not forced to share any further (application-) specific information about his user or its data being sent through the encrypted channel, hence preserving the users’ and his own privacy.
III. MEASURINGLATENCY INSDN
A. Related Work
NetFlow [8] and sFlow [9]collect flow datausing their agents deployed on the switches. Besides their differences as the former mirrors all packets and restricted to IP, while sFlow only samples a certain amount of packets and can monitor all layers, they both require hardware modifications for their agents. On the other hand, SLAM [10] and the solution in [11] are based onspecially crafted probe packets
inserted into the network at some point by the controller. The aim of using probe packets is: i) put arbitrary information into the payload (e.g., timestamp), and ii) according to its header, install matching flow rules into the switches to send them back to the controller for further processing. The main disadvantages of these solutions are that they require post-processing of several notification packets and they need to consider the propagation and processing delays of the corresponding switches w.r.t. their unequal distances (in terms of latency) from the controller, not to mention their actual processing loads. In [12], temporary flow rules are installed into the switches to send all or a sample of the production traffic to the controller to calculate the latency. However, when there are a lot of flows in the network, it consumes a large control plane bandwidth.
B. Hop-by-Hop End-to-End Latency (HEL)
In contrast to the above-mentioned solutions, our HEL relies on simple ping modules as a measurement routine, running on top of the switching devices as a lightweight isolated network function. This approach has numerous advantages: since the measuring packets (i.e., ICMP pack-ets) are generated, timestamped, and received at the same node, the controllerper seis completely excluded from the measurement process resulting in significant reduction of control plane overhead. Thus, compared to a fully controller-based measurement, the precise delay could be obtained easily instead of taking into account other continuously changing parameters (e.g., control channel latency, actual load). Moreover, since ping packets could not just be sent
from-NF-to-NF, butfrom-NF-to-end-host, HEL can measure the latencies of the first and last links as well without requiring the users to run any specific application. Note that from an applicability aspect, due to the evolution of SDN switches, it is possible to run such a lightweight isolated NF on many switching appliances (such as WhiteBox switches) or even on top of a simple wireless router (OpenWRT).
IV. TRACING PATHS INSDN
A. Related Work
A quintessential requirement of running HEL is clearly the accurate identification of the traversed path. Since tra-ditional applications, such as traceroute, are restricted to IP and ICMP protocols, operators need to rely on more sophisticated tools in an SDN domain. To this end, we are given basically two main approaches. While generic flow monitoring relying on packet sampling (e.g., [8]) is good for coarse-grained visibility, it was shown that the accu-racy it provides is insufficient for fine-grained metrics [13].
On the other hand, relying on probe packets is the most desired method in SDN networks nowadays for numerous purposes (e.g., latency measurements, observing data plane behaviors, congestion, etc.), however as they are injected only at a switch, this method cannot provide real end-to-end (from source to destination) metrics since the controller has no access to end-hosts. Furthermore, tracing down probe packets usually involves heavyhop-by-hop notificationssent to the controller typically realized by OpenFlow’s Packet-In messages. The reason of using Packet-In messages for path tracing originates at the state-less nature of the OpenFlow protocol: even if a comprehensive view of the topology is available at the controller, once a packet leaves the switch nothing but statistics are persistent, i.e., other information such as header fields that have not been considered during forwarding decisions, or even the incoming port identifier perish. Path tracing methods using some forms of such no-tifications include Netsight [14] and its interactive debugger ndb[15] that create “postcards” from each packet traversing a switch and send them to the controller. SDN traceroute [2] also sends “postcard-equivalents”, however in contrast to Netsight, it does not modify the production flow rules. PathletTracer [16] modifies the ToS fields of the IP packets, and installs flow rules into the switches to imprint path IDs on the packets going through. The authors of FlowTrace [17] aimed at reducing the number of control plane – data plane messages by introducing a passive flow table collecting method wherein once the flow tables are gathered, a path tracing algorithm simulates forwarding behavior of physical switches to find flow paths.
B. Practical Trace Route (PTR)
In order to identify the traversed paths, we propose a different method, called Practical Trace Route (PTR), which in some sense lies in the middle of the above-mentioned two main categories: it gathers statistics from the switches, but at the same time in order to catch particular traffic flows, it installs specific matching rules into the switches as well. However, it does not inject any probe packet into the network at all. In contrast, it temporarily tags the actual production traffic with VLAN IDs, and installs corresponding temporary matching flow rules to catch them. Our main aims with such an intermediate solution are seven-fold: eliminate the hop-by-hop notification messages between the control plane and the data plane, since too many continuous control messages can easily overload the controller and make the network unusable [18]; keep the volumeof the remaining necessary control messages in a constant size to make the consumed bandwidth predictable; rely entirely on OpenFlow without the need to modify the hardware appliances or access the hosts; carefully manage the expensive space of TCAMs by making the additional flow rules ephemeral by means of OpenFlow’shard_timeoutparameter;do not modify the production flow rules nor the original production traffic, but use the latter instead of tinkering probe packets.
Next, we show its operation in detail. Assume that ac-cording to the shortest paths, the desired forwarding rules are already installed into the switches. In order to enable more sophisticated and scalable processing, the pipeline consists
of multiple tables [19], i.e., each flow table has its own purpose such as ARP and routing. Note that multi-table pipeline is supported since OpenFlow version 1.1. In the following, we concentrate again on the case of Tenant A
(recall, related traffic flows are denoted with green dashed arrows in Fig. 1). First, consider the initial flow tables of
S1 denoted by the Original pipeline of S1 in Fig. 2b. For brevity, it consists of two tables: the first table (table 5 (ARP)) is intended to filter ARP messages, while the other table (table 100 (IP)) embodies a Layer-3 routing to forward the corresponding packets towards the different racks where the destinations reside. Furthermore, since from
T1 to T3 there exist two shortest paths, the controller has simply installed an ECMP rule into the flow table for load balancing reasons (see the forwarding rules ofT1, similarly denoted by the group Original pipeline of T1 in Fig. 2a). However, due to the unpredictable output of ECMP’s hashing function, the controller cannot know in advance in which direction any given packet will be sent.
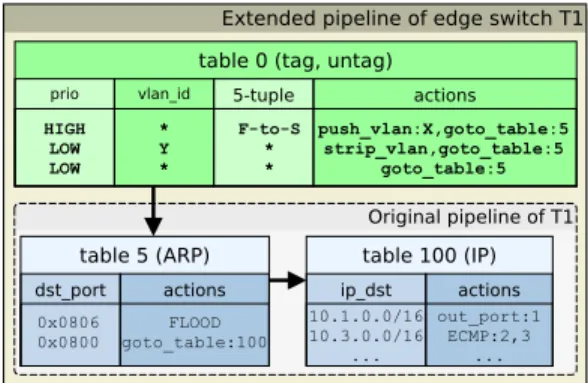
(a) Extended pipeline of “tagging” and “untagging” switchT1
(b) Extended pipeline of “counting” switchS1
Fig. 2: Example pipelines and their extensions in PTR.
1) Phase - Capturing packets: After the request of
Tenant A has been received, the controller needs to trace down the path between the source and the destination (from thefront-end (F) to thestorage (S) in Fig. 1). According to the shortest paths, it first identifies the edge switches, i.e., the switches that are closest to the source and destination, which areT1andT3. Then, based on the connection details available at the application layer, i.e., the 5-tuple, it installs temporary “tagging” and “untagging” rules intoT1andT3,
respectively. Considertable 0in the extended pipeline ofT1
depicted in Fig. 2a: the first high priority rule matches on the 5-tuple and pushes VLAN IDXonto all packets (“tagging”), then the practical forwarding is done by the original flow rules (indicated by the goto_table:5 action). For the reverse direction, the original pipeline of T3 is extended in a similar way by tagging the packets with a different VLAN ID Y. Consequently, a low priority rule is also installed in
T1’s (T3’s) flow table that matches on the VLAN IDY (X), which is being stripped (“untagging”) before continuing the processing in the original pipeline. In order to forward the rest of traffic as usual, a final low priority match-all rule is also installed inT1’s andT3’stable 0, respectively.
Next, the controller installs temporary high priority “counting” rules matching on the corresponding VLAN IDs into the rest of the switches along the shortest paths (see Fig. 2b as an example). Observe that these rules leave the packets completely untouched and commit their further processing to the original pipeline immediately. The reason of having this extra step in the pipeline is to providestates
at the switches by increasing the counters of that specific rules, which is used in the path reconstruction phase (see later) and helps identifying possible packet losses. Note that the two different priorities make it possible that any switch in the network can act the part of counting, tagging, and
untagging role1. Phase 1 is summarized in Alg. 1, where
SP(S, D)is the set of shortest paths betweenS andD.
Algorithm 1 Capture packets
1: t←(5−tuple)
2: k←get unused V LAN(t)
3: S←f irst edge switch(t)
4: D←last edge switch(t)
5: install tagging rule(S, t, k)
6: install untagging rule(D, t, k)
7: forpathinSP(S, D)do
8: forswitchinpath do
9: install counting rule(switch, k)
10: end for 11: end for
2) Phase - Path Reconstruction: In this phase, the con-troller gathers statistics from the tagging, untagging, and
counting switches. In particular, it reads the corresponding flow rules’ packet counter fields by means of OpenFlow’s FlowStats-Requestand Replymessages. In contrast to generic flow monitoring approaches, only a subset of switches are concerned, thus the number of control messages is limited. In the aFlowStat-Requestmessage, the con-troller can indicate thetable of interest, and can also specify afilter for a certain flow rule. This hastwo main benefits: in contrast to usingPacket-InandPacket-Outmessages (e.g., in [2]), where the number of bytes included in the messages depends on the original packet’s header2 (a simple
1Otherwise, for instance, in a counting switch intended to be a tagging
one as well the match-all rule and the tagging rule would interfere.
2If a packet is not buffered either because of no available buffers or
because explicitly requested, the entire packet needs to be included in the message.
Layer-3 packet encapsulated in a Packet-In message is 168 bytes on the wire, while a corresponding Packet-Out is 106 bytes), the amount of data sent as FlowStats messages
is always constant (Request message occupies 130 bytes, while the response is 154 bytes on the wire). This makes the amount of traffic needed for the control plane – data plane communication more predictable. On the other hand, note that since the “counting” rules are in a separate flow table, the overall time to find and gather the relevant information is only affected by the number of capture rules.
Algorithm 2 Reconstruct paths 1: F ←list()
2: forswitchinSP(S, D)do
3: stat←request f lowstat(switch,
table id= 1,
vlan id=k)
4: ifstat.packet counter6= 0then
5: F.append(switch) 6: end if 7: end for 8: P AT H ←list();P AT H.append(S) 9: while F 6=∅ do 10: X =P AT H.last element()
11: P AT H, F =f ind next node(X, F, P AT H)
12: end while
13: P AT H.append(D)
14: function f ind next node(X, F, PATH)
15: NX,D←get next hops(X, D)
16: B=intersect(NX,D, F)
17: P AT H.append(B)
18: F.remove(B)
19: returnPATH, F 20: end function
The methodology ofPhase 2is defined in Alg. 2: first, we gather flow statistics from the concerned switches (lines 2-3), then we filter out those, with a packet counter of 0 and store the remainder in variable F (lines 4-6). For brevity, we omitted the lines that identify packet loss, which is only a simple comparison of the concerned switches’ packet counters. As the first edge switch is S, we store it as the first hop in variable P AT H (line 8). In lines 14-19, we recursively look for the intersection of the set of next-hops of the already reconstructed path’s last elementX (refreshed in each iteration in line 10) and the switches in F. Once a switch (B) is found as an intersection (line 16), it will be removed from F and added to P AT H (line 17-18). This process is repeated untilF 6=∅(line 9-12).
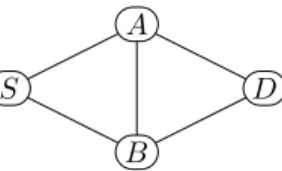
One might observe that the Achilles-heel of the algorithm can be line 16: what if there is more than one node in the intersectionB?In particular, consider a simple network topology depicted in Fig. 3. Under the assumption that the path to find is one between S and D, and we only know that A and B have encountered the packets, we would not be able to determine whether the actual path was (S → A → B → D) or (S → B → A → D). Next, we show that if forwarding is based on the shortest paths, we are always able to determine the actual traversed
S
A
B
D
Fig. 3: A sample network topology to ease the understanding of Proof IV-B2.
path unambiguously. In particular, we theoretically show that if the above-ambiguity arises at all, then forwarding is definitely based on non-shortest paths. Then, accordingly we prove that based on shortest paths, the traversed path could always be reconstructed from F, i.e., Alg. 2 always finds the traversed path. In the following,G(V, E)always denotes an arbitrary network graph with non-negative arbitrary link costs, where V and E mark the set of nodes, and the set of links, respectively. Furthermore, SPS,D denotes the
set of shortest paths, APS,D is the set of all paths, while P PS,Dmarks the possible paths3(i.e., routes) determined by
the controller between a source-destination pair S, D ∈ V. Before digging into details, we recap a common graph theoretical property.
Proposition 1: InG(V, E), the sum of the lengths of two shortest paths is always less than the sum of lengths of any other two paths. In other words, ife, f∈SPS,D, andg, h∈
APS,D\SPS,D⇒e+f < g+h.
Theorem 1: In G(V, E), let F ∈ V be the unordered set of switches that encountered a packet between a given source-destination pair (S, D ∈ V). Now, if two arbitrary pathsi, j∈P PS,D, withi6=j traverse each node inF but
no other nodes, thenP PS,D6=SPS,D, i.e., i, j /∈SPS,D.
Proof: Indirect: Suppose that F = {S, A, B, D} (for an easier comprehension, consider the network in Fig. 3). Let the two different paths i, j∈P PS,D bei= (S→A→ B → D), and j = (S → B → A → D), respectively. In contrast to our statement, let us assume that i, j∈SPS,D.
Suppose that the length S → A = x1, S → B = x2, A → B = x3, A → D = x4, and B → D = x5, respectively. Furthermore, let g, h ∈ APS,D be g =
{S, A, D}, andh={S, B, D}, respectively. Now, according
to Prop. 1 SU M(i, j) < SU M(g, h), where SU M(x, y)
denotes the sum of the lengths of paths xandy. However,
SU M(i, j) = (x1 +x3 +x5) + (x2 +x3 +x4), while SU M(g, h) = (x1 +x4) + (x2 +x5), which obviously
cannot be true as SU M(i, j) = SU M(g, h) + 2x3. Thus,
i, j6∈SPS,D.
Theorem 2: In an given G(V, E), where P PS,D = SPS,D, the proposed algorithm in Alg. 2 can always
recon-struct the traversed path from the unordered set of nodesF
that encountered a tagged packet.
Proof:LetX, Y ∈V andNX,Y be the set of next-hops
ofX towardsY. Furthermore, letB =NX,Y∩F. Next, we
show that for eachZ ∈NX,Y :|B|= 1. First, observe that
|B|>0for eachZ∈NX,Y, since there has been at least one
3Note that in our architecture for eachX, Y ∈V :SP
path that the tagged packet traversed fromX toY. Second, we show that|B|cannot be more than1. In contrast to this, assume that for a given Z, |B| = k, where k > 1. This would imply the following consequences: the possible next-hops of X towards Y can be any of thek nodes, although the tagged packet traversed all of them on its way towards
Y. However, this is a contradiction since it would mean that a next-hop W ∈ NX,Y was not reached directly from X,
i.e.,W /∈NX,Y. Thus,|B|=kif and only if k= 1.
V. EVALUATION
In this section, we evaluate the proposed EDT archi-tecture. First, we concentrate on PTR, in particular, we examine its practical properties. In contrast to other proposals (e.g., [2], [14]), we not just study the time necessary for tracing down a certain path, but we also assess to what extent the data plane throughput of the production traffic is affected. Then, we discuss the possible time frame HEL needs.
A. Implementation and Testbed Setup
From the control plane aspect, we implemented EDT in
python as an extension to Ryu4 SDN controller. From the data plane point of view, the architecture and its operation was first evaluated in a Mininet environment with OVS (Open vSwitch [20]) switches. Then, in order to study the data plane performance in a more realistic environment, we used a testbed consisting two IBM x3550 M5 servers with Intel Xeon E5-2620v3 processors and 64GB of memory running Debian Linux Jessie 8.0/kernel 3.16. Each server was equipped with an Intel X710 NIC with two 10G ports. In our experiment, one of the servers was configured to run NFPA [21] (an Intel DPDK pktgen based performance analyzer) connected back to back with the System-Under-Test (SUT). The SUT was provisioned on the other IBM server, running the latest stable version of OVS (Open vSwitch v2.5.1), compiled with DPDK v16.04 using 1 CPU core. As a specific use case, the SUT was configured to act as a Layer-3 router, having more than100production rules installed in its flow table5.
B. Measurements
First, we examine how the performance is affected at a single switch performingcounting, tagging, or untagging
role, respectively. Then, we investigate the overall time needed to trace down a path as a function of the number of switches along the shortest paths. Relying on NFPA, we put the SUT under a heavy traffic load (using 64-byte sized packets) and first, we examined its nominated throughput as a baseline value. According to the available resources the testbed has and the installed pipeline, OVS attained an average throughput of 4.6 million packets per seconds [Mpps]. Then, in accordance with the used traffic trace, the controller was requested to consecutively trace all possible paths, i.e., install capture rules into the flow tables for all possible 5-tuples. The results as a function of the number of traced paths (i.e., the number of additional rules) are depicted in Fig. 4. The performance of a switch set up for
4https://github.com/cslev/nmaas
5See https://goo.gl/cHknii for more details about the use case.
-12 -10 -8 -6 -4 -2 0 0 20 40 60 80 100 Throughput drop [%]
Number of paths to trace
Counting
Tagging
Untagging
(a) The performance deterioration caused by the different roles
0 5 10 15 20 25 30 35 40 45 1 10 20 30 50 75 100 Time [msec] Number of switches
(b) Time needed to trace a path
Fig. 4: Influence on data plane performance and path tracing time
counting, tagging, and untagging a specific traffic flow is denoted by a black solid line, red dashed line, and blue dotted line, respectively. One can observe that counting has the least effect on performance as it only involves committing a certain amount of traffic to an additional table. On the other hand, the performance deterioration becomes slightly worse when packets have to be tagged/untagged. In particular, pushing a VLAN tag onto the packets has lesser influence on the performance than stripping it. Nevertheless, compared to the baseline throughput, the overall performance is barely affected (ca. 4%) for a handful of coexisting path tracing rules, and even tracing100paths at the same time, introduces only ca. 11%performance drop. Recall that the additional flow rules PTR ushers in are ephemeral meaning that it only affects the performance for a limited time frame.
Next, we turn to the latency of tracing a path. According to Alg. 2, the controller needs to gather statistics from all
countingswitches along all possible shortest paths (and from the edge switches in order to observe any packet loss). Obviously, the time needed to gather all data heavily depends on the number of switches being considered. Furthermore, even if the number of production flow rules does not have any impact, the number of coexisting paths to be traced does (recall Sec. IV-B2). We configured the SUT in a similar way as before, however now we instantiatedi={1,2, . . . ,100}
number of new switch instances chained together, and in each case we requested the controller to consecutively install
j = {1,2, . . . ,100} number of different path tracing flow
rules into each switch’s flow table. We measured the elapsed time between the time the controller initiated the gathering and when all data have been collected. We ran these experi-ments100times, and the averages of the measured results are plotted in Fig. 4b. We found that, on average,i contributed the most to the overall time, while j introduced negligible impact (see error-bars). One can observe that when only 20
switches are concerned, a path can be traced in 10ms, and this number increases to only 40 ms when the controller needs to gather data from100switches. Note, however, that the number of concerned switches does not correlate with the number of hops, i.e., in a scarcer ISP network with an average of 2−3 shortest paths, PTR can trace more than 30-hops long paths in less than 40 ms (compared to SDN traceroute [2] that introduces approx. 2 ms for each hop). Although, in a denser data center topology, for instance in a Clos (Leaf-Spine) topology, where each path is2hops long, the time needed to trace a path is a linear function of the number of Spine switches.
As mentioned in Sec. III, once the tracing is done, HEL deploys the pingNFs along the path and installs temporary flow rules to direct ICMP packets properly. Note that these NFs run in parallel, and the time one NF needs to conduct a measurement only depends on the desired demands. In our implementation, we set the number of packets to 3, and the time-interval to the lowest possible 200 ms meaning that the practical measurement can be conducted in600ms
irrespectively of the number of hops. Note that relying on more sophisticated NFs instead of ping modules might further reduce the measurement period. On the other hand, we believe that the advantages HEL provides (e.g., precision, reduced control plane overhead) can easily overcome its incidentally higher time frame. Furthermore, the desired way these results are sent back to the controller is also up to the network operator. For instance, it could be done via REST API, or even through Packet-In messages. According to the results, the operator can further investigate the root causes of a delay, and decide how much information can be sent back to the users.
VI. CONCLUSION
Modern enterprises heavily depend on their infrastruc-tures’ smooth operation. Any level of service degradation is often realized by loss of reputation and revenue. There-fore, when an issue arises accurate problem resolutions are essential in every network to reduce the negative effects on business. However, troubleshooting tasks are becoming more challenging due to the continuously increasing traffic demands of today’s applications. Moreover, the advanced network services (e.g., load-balancers, caches, accelerators) hide many details between layers. The increasingly popular SDN paradigm and the inherent freedom of defining arbitrary routing policies just make the whole process even harder.
In this paper, we designed EDT in order to accelerate the identification of the root causes of a failure. In EDT the measurements carried out by the infrastructure are driven by the end-hosts providing necessary application level in-formation. We have therefore two troubleshooting tools: we designed PTR for tracing path and identifying packet losses at the same time and HEL, a NF-based hop-by-hop latency measurement tool. Our PTR is completely novel in its kind as it uses the production traffic to trace a flow by temporarily tagging its packets, capturing them with ephemeral flow rules and gathering statistics. We proved that PTR always finds the traversed paths, when the forwarding is based on shortest paths. Furthermore, we showed that for the limited time frame the path tracing lasts, the overall data plane performance is slightly affected (ca.10%), and tracing a path up to30hops long can be done in less than40ms. Finally, relying on PTR we outlined a possible setup for HEL, which due to its NF-based approach can be further customized to meet certain goals (e.g., time frame, precision).
ACKNOWLEDGEMENTS
The work has been supported in part by the UK Engi-neering and Physical Sciences Research Council (EPSRC) projects EP/L026015/1, EP/N033957/1, EP/P004024/1, and EP/L005255/1, and by the European Cooperation in Science
and Technology (COST) Action CA 15127: RECODIS – Resilient communication services protecting end-user appli-cations from disaster-based failures.
REFERENCES
[1] Continuity Central, “Degradation of customer confidence and lost revenues are the most damaging impacts of DDoS attacks,” [Online], goo.gl/aQNZbI, Jul. 2015.
[2] K. Agarwalet al., “Sdn traceroute: Tracing sdn forwarding without changing network behavior,” inProc. of ACM HotSDN ’14, 2014, pp. 145–150.
[3] Z. Huet al.,The Need for End-to-End Evaluation of Cloud Availabil-ity. Cham: Springer International Publishing, 2014, pp. 119–130. [4] Sue Marek, “AT&T Developed an SDN Controller for 400 GbE Trial
Between D.C. and NYC,” SDx Central Article: goo.gl/pXYiSD, Mar 2017.
[5] A. Erickson et al., “An efficient shortest-path routing algorithm in the data centre network DPillar,”CoRR, vol. abs/1509.01746, 2015. [6] Y. Chenet al., “A provider-side view of web search response time,”
ACM SIGCOMM CCR, vol. 43, no. 4, pp. 243–254, 2013. [7] T. Flachet al., “Reducing web latency: the virtue of gentle
aggres-sion,”ACM SIGCOMM CCR, vol. 43, no. 4, pp. 159–170, 2013. [8] B. Claise, “Cisco Systems NetFlow Services Export Version 9,”
Internet Requests for Comments, IETF, RFC 3954, October 2004. [9] sFlow, “Traffic Monitoring using sFlow,” White paper, 2003. [10] C. Yu et al., Software-Defined Latency Monitoring in Data Center
Networks. Cham: Springer International Publishing, 2015, pp. 360– 372.
[11] K. Phemius and M. Bouet, “Monitoring latency with openflow,” in Proc. of the 9th International Conference on Network and Service Management (CNSM 2013), Oct 2013, pp. 122–125.
[12] M. Jarschel et al., “On the accuracy of leveraging sdn for passive network measurements,” in 2013 Australasian Telecommunication Networks and Applications Conference (ATNAC), Nov 2013, pp. 41– 46.
[13] N. Duffieldet al., “Estimating flow distributions from sampled flow statistics,” inProc. of the 2003 Conference on Applications, Technolo-gies, Architectures, and Protocols for Computer Communications, ser. SIGCOMM ’03, 2003, pp. 325–336.
[14] N. Handigol et al., “I know what your packet did last hop: Using packet histories to troubleshoot networks,” in11th USENIX Sympo-sium on Networked Systems Design and Implementation (NSDI 14), 2014, pp. 71–85.
[15] ——, “Where is the debugger for my software-defined network?” in Proc. of HotSDN ’12, 2012, pp. 55–60.
[16] H. Zhang, C. Lumezanu, J. Rhee, N. Arora, Q. Xu, and G. Jiang, “En-abling layer 2 pathlet tracing through context encoding in software-defined networking,” inHotSDN’14. ACM Press, 2014, pp. 169–174. [17] S. Wang, J. Zhang, T. Huang, J. Liu, Y.-j. Liu, and F. R. Yu, “Flowtrace: measuring round-trip time and tracing path in software-defined networking with low communication overhead,”Frontiers of Information Technology & Electronic Engineering, vol. 18, no. 2, pp. 206–219, 2017.
[18] T. Bensonet al., “Network traffic characteristics of data centers in the wild,” inProc. of the 10th ACM SIGCOMM Conference on Internet Measurement, ser. IMC ’10. New York, NY, USA: ACM, 2010, pp. 267–280.
[19] Open Networking Foundation, “Simplifying OpenFlow Interoperabil-ity with Table Type Patterns (TTP),” ONF Solution Brief, May 2015. [20] B. Pfaff et al., “The design and implementation of open vswitch,” in 12th USENIX Symposium on Networked Systems Design and Implementation (NSDI 15), 2015, pp. 117–130.
[21] L. Csikoret al., “NFPA: Network Function Performance Analyzer,” in IEEE Conference on Network Function Virtualization and Software Defined Networks Demo Track, 2015, pp. 17–19. [Online]. Available: http://nfpa.tmit.bme.hu