UNIVERSITY OF THE WITWATERSRAND
JOHANNESBURG
FACULTY OF SCIENCE
MAPPING GRASS NUTRIENT PHOSPHORUS (P) AND SODIUM (NA) ACROSS DIFFERENT GRASS COMMUNITIES USING SENTINEL-2 DATA
BY
TENDANI MASHAMBA (0604731R)
A research report submitted to the Faculty of Science, University of the Witwatersrand, Johannesburg, in partial fulfilment of the requirement for the degree of Master of Science
(Environmental Sciences) at the School of Geography, Archaeology & Environmental Studies
Supervisor: Dr Elhadi Adam
Co-Supervisor: Dr Zakariyya Oumar MARCH 2017
DECLARATION
I, Tendani Mashamba, declare that this research is my own unaided work. It is being submitted to the Degree of Master of Science in Environmental Sciences to the University of the Witwatersrand, Johannesburg. It has not been submitted before for any degree or examination at any other university
……… Signature of candidate
ABSTRACT
Accurate estimates and mapping of grass quality is important for effective rangeland management. The purpose of this research was to map different grass species as well as nutrient Phosphorus (P) and Sodium (Na) concentration across grass communities using Sentinel-2 imagery in Telperion game reserve.
The main objectives of the study were to: map the most common grass communities at the Telperion game reserve using Sentinel-2 imagery using artificial neural network (ANN) classifier and to evaluate the use of Sentinel-2 (MSI) in quantifying grass phosphorus and sodium concentration across different grass communities. Grass phosphorus and sodium concentrations were estimated using Random Forest (RF) regression algorithm, normalized difference vegetation index (NDVI) and the simple ratios (SR) which were calculated from all two possible band combination of Sentinel-2 data.
Results obtained demonstrated woody vegetation as the dominant vegetation and Aristida congesta as the most common grass species. The overall classification accuracy = 81%; kappa =0.78 and error rate=0.18 was achieved using the ANN classifier. Regression model for leaf phosphorus concentration prediction both NDVI and SR data sets yielded similar results (R2 =0.363; RMSE=0.017%) and (R2 =0.36 2; RMSE=0.0174%). Regression model for leaf sodium using NDVI and SR data sets yielded dissimilar results (R2 =0.23; RMSE=16.74 mg/kg) and (R2 =0.15; RMSE =34.08 mg/kg). The overall outcomes of this study demonstrate the capability of Sentinel 2 imagery in mapping vegetation quality (phosphorus and sodium) and quantity.
The study recommends the mapping of grass communities and both phosphorus and sodium concentrations across different seasons to fully understand the distribution of different species across the game reserve as well as variations in foliar concentration of the elements. Such information will guide the reserve managers on resource use and conservation strategies to implement within the reserve. Furthermore, the information will enable conservation managers to understand wildlife distribution and feeding patterns. This will allow integration of effective conservation strategies into decisions on stocking capacity.
ACKNOWLEDGEMENTS
I am very grateful for my supervisor Dr Elhadi Adam for the support, guidance and inputs he provided during my research. I am also thankful to the contributions of the co-supervisor Dr Zakariyya Oumar.
Table of Contents
DECLARATION... i
ABSTRACT ... ii
ACKNOWLEDGEMENTS... iii
List of Figures ... vi
List of Tables ... vii
LIST OF ABBREVIATIONS ... viii
Chapter 1: Introduction ... 1
1.1Background ... 1
1.2 Problem Statement ... 3
1.3 Aims and objectives ... 4
CHAPTER 2 ... 5
2 LITERATURE REVIEW ... 5
2.1Mapping grass communities quality and quantity ... 5
2.2Mapping grass quality and quantity using multispectral data ... 6
2.3 Mapping grass quality and quantity using hyperspectral data ... 7
2.4 Mapping grass quality and quantity using new generation multispectral ... 8
2.5 Classification of vegetation ... 9
2.5.1 Support Vector Machine ... 9
2.5.2 Random Forest ... 10
2.5.3 Artificial Neural Network... 10
2.5 Conclusion... 10
Chapter 3 ... 12
3 Mapping grass communities using Sentinel -2 image... 12
3.1Introduction ... 12
3.2 Methodology... 15
3.2.1Study Area ... 15
3.2.2Image acquisition and pre-processing ... 16
3.2.3 Ground reference data collection ... 17
3.3 Image classification ... 18
3.3.1 Artificial Neural Network (ANN) Classifier... 18
3.3.2 Accuracy assessment ... 19
3.4. Results... 20
3.4.1 Classification ... 20
Chapter 4 ... 25
4 Mapping grass phosphorus and sodium concentration using Sentinel-2 imagery... 25
4.1Introduction ... 25
4.2 Materials and Methods... 28
4.2.1 Study area... 28
4.2.2 Remote sensing data acquisition and processing ... 29
4.2.3 Field data collection ... 31
4.2.4 The calibration and validation dataset ... 31
4.2.5 Chemical analysis ... 31
4.2.6 Data Analysis ... 32
4.2.7 Random forest regression ... 32
4.2.8 Selecting the important band indices... 34
4.3 Results... 34
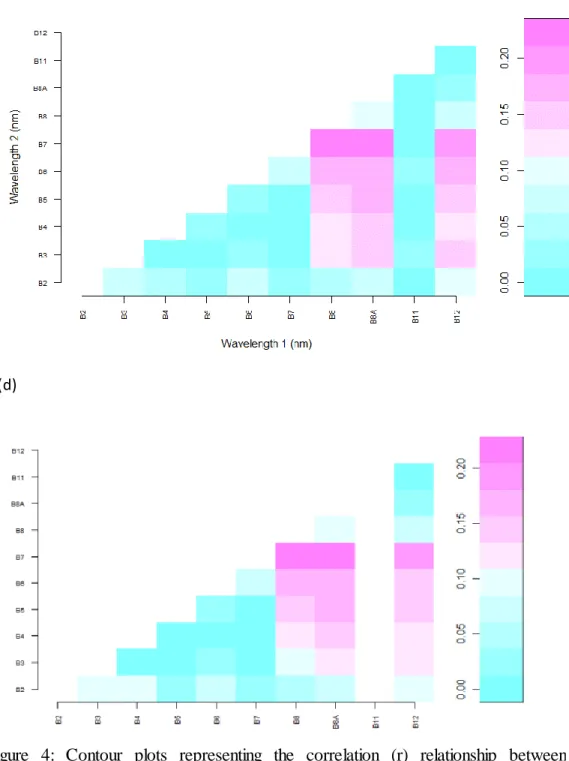
4.3.1 Descriptive statistics... 34
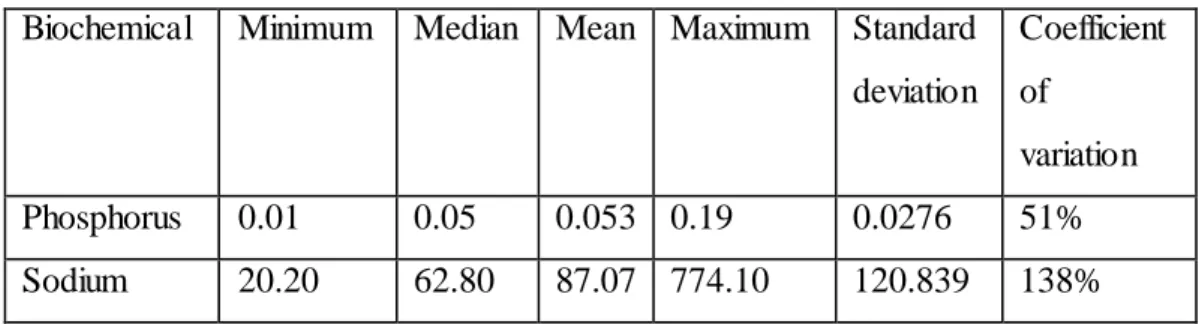
4.3.2 Relationship between the vegetation indices and the phosphorus and sodium concentrations ... 35
4.3.3 Selecting important predictor variable ... 38
4.3.4 Spatial distribution of foliar P and Na ... 44
4.4 Discussion and conclusion ... 45
4.4.1 Prediction of P and Na... 45
4.4.2 Relationship between vegetation indices (NDVIs & SRs) and prediction of P and Na concentrations ... 47
4.4.3 Mapping of P and Na... 48
CHAPTER 5 ... 49
5 CONCLUSION ... 49
List of Figures
Figure 1: Study area map showing Loskop Mountain Bushveld and Rand Highveld vegetation ... 16 Figure 2: Classified vegetation of the study area using ANN classifier... 20 Figure 3: Study area map showing Loskop Mountain Bushveld and Rand Highveld vegetation ... 29 Figure 4: Contour plots representing the correlation (r) relationship between phosphorus NDVI (a) and SR (b) as well as the relationship between sodium NDVI (c) and SR (d) obtained from all two possible band combinations... 37 Figure 5: Measurement of variable of importance (a)-(b) NDVIs and SRs phosphorus (c)-(d) NDVIs and SRs sodium. Highest decrease accuracy represents the most important variables ... 40 Figure 6: The number of variables selected for prediction using phosphorus (a)(b) NDVIs and SRs (4 and 6) and Sodium NDVIs and SRs (c)(d) (6 and 7) ... 42 Figure 7: The actual and predicted phosphorus and sodium concentration showing one-one
relationship developed using NDVIs and SRs best bands for prediction... 44
Figure 8 Spatial distribution maps of sodium (a) and phosphorus (b) ... 45
List of Tables
Table 1Sentinel 2 MSI spatial and spectral resolutions ...177
Table 2 Training and test data set for grass species... Error! Bookmark not defined.8 Table 3 Confusion matrix showing the overall classification and Kappa distinguishing among vegetation species ... 21
Table 4 Producer's accuracy (%) and user's accuracy (%) of nine classes (SP,HH,MG,CD,EC,EG,WGand AC) using all Sentinel-2 bands ... 22
Table 5 Kappa, overall accuracy and Error rate ... 22
Table 6 show Sentinel-2 MSI spatial and spectral resolutions ... 30
LIST OF ABBREVIATIONS
ANN Artificial Neural Network
AVHRR Advanced Very High Resolution Radiometer
ESA European Space Agency
GPS Global Positioning System
MLP Multilayer Perceptron
MSI Multispectral Imager
Na Sodium
NDVI Normalised Difference Vegetation Index
NIR Near Infrared Region
P Phosphorus
RADAR Radio Detection and Ranging
REP Red Edge Position
RF Random Forest
RMSE Root Mean Square Error
ROI Region of Interest
RS Remote Sensing
SA South Africa
SAR Synthetic Aperture Radar
SPOT Satellite Pour I ‘Observation de la Terre
SR Simple Ratio
SVM Support Vector Machine
SWIR Short Wave Infrared Red
Chapter 1: Introduction
1.1Background
The feeding patterns of wildlife has been proved to be linked to the quality and quantity of the grass (Mutanga et al. 2004). Grass quality refers to characteristics that influence grass intake by wildlife such as crude protein (a measure of the total protein present in grass and is directly related to digestibility of grasses) and digestibility (a measure of the proportion of grass that can be used by animal). Grass quality is directly linked to the energy content of grass as well as energy needed for body functions (Mutanga et al. 2004). Grasses with higher digestibility are rapidly processed by wildlife resulting in increased production levels (Duru 2000).
Grass growth stages significantly influence digestibility, leafy, greener and actively growing grasses are associated with higher digestibility than aging grasses (Duru 2000). Wildlife require either micro or macro nutrients for physiological well-being (Zhu et al. 2011). Phosphorus (P) and sodium (Na) are important limiting nutrients for grazers, however these nutrients have been reported to be varied between seasons (Knox et al. 2011; Skidmore et al. 2010; McNaughton 1988) and different stages of plant growth (Duru 2000). Sodium (Na) has been found to be an important macro nutrient to mammals as it regulates chemical processes and physiological mechanisms (Mutanga & Skidmore 2004). However, few terrestrial plants require sodium and due to this as a result, herbivores can experience shortage in sodium concentrations.
Current techniques which are used to monitor rangeland management do not adequately take into consideration information on grass quality and are therefore limited in explaining wildlife and livestock distribution and feeding patterns (Mutanga et al. 2016; Adjorlolo et al. 2015). The development of techniques to map the grass diversity and quality such as foliar phosphorus and sodium concentrations helps to describe wildlife distribution and feeding behaviour (Mutanga & Skidmore 2004). Therefore, information on grass quality is essential to gain knowledge on the wildlife distribution and feeding behaviour (Ramoelo et al. 2013a).
Spatial patterns of grass quality and quantity are influenced by various interacting factors ( biotic and abiotic) which also vary with spatial scale (Mutanga et al. 2005). To date,
many of these methods are limited in explain foraging patterns and behaviours (Mutanga et al. 2005). However, remote sensing application has a significant potential in predicting biochemical foliar concentration (Ramoelo et al. 2013a).
There are two approaches that have been widely used for vegetation estimation, namely: field-based traditional methods and remotely sensed methods (Dube et al. 2014). In order to distinguish the in situ reflectance vegetation measurement, field spectroscopy has been used over the years (Mutanga et al. 2015). This approach has helped researchers to understand the electromagnetic wavelength regions that are important for identifying the vegetation spectral features before the development of imaging spectroscopy (Mutanga et al. 2015). Imaging spectroscopy are field based vegetation mapping techniques which are time-consuming, costly, and sometimes difficult to execute if an area is inaccessible or if land coverage is extensive (Ramoelo 2013; Adam 2010). In addition, imaging spectrometers take measurements in visible and near –infrared regions (400-1000 nm) (Adam 2010). On the other hand, the freely available remotely sensed data presents an opportunity for researchers to effectively and economically generate timely and accurate data for vegetation mapping (Dube & Mutanga 2015; Adam 2010).
In the past, many researchers relied on the use of very high spectral resolution spectrometers to map vegetation species and foliar nutrients such as nitrogen, phosphorus and sodium ( Mutanga & Skidmore 2004), biomass estimation (Dube et al. 2014) using remote sensing.
Mapping vegetation species occurs because vegetation such as grass species with different nutrient levels reflects differently at specific wavelengths (Mutanga et al. 2003). Effective monitoring and mapping techniques for grass species are significant for a better understanding of distribution of grass communities within a conservation area (Mutanga & Kumar 2007). However, in SA, the limitations associated with remote sensing applications are that most multispectral images are not freely available, they are expensive to acquire as well as to analyse them (Mutanga et al. 2016). Various vegetation monitoring studies have been limited by compartment levels due to their high acquisition and high spatial and spectral resolution (Dube & Mutanga 2015; Dube & Mutanga 2015). However, cheap and low resolution images are known to greatly compromise accuracies (Knox et al. 2012).
Traditional field techniques for mapping plant species are time consuming, require extensive field work as well as laboratory analysis to predict biochemical and biophysical properties of vegetation (Adam et al. 2012; Mutanga et al. 2003). Therefore, developments in new remote
sensing data sets that can satisfy the scope of work of botanist, ecologists and conservation managers for vegetation monitoring (Mutanga et al. 2016). This is extremely dependent on: development of sensors having decent spatial and spectral resolutions (Mutanga et al. 2016; Adjorlolo et al. 2015). However, the newly launched Sentinel-2 MSI satellite is likely to succeed in various applications. Sentinel-2 MSI has bands that are strategically positioned and is freely available (Mutanga et al. 2016). The spectral band of Sentinel-2 and its 290 km wide swath provides a detailed view of area under investigation which enables the assessment of foliar biochemicals over large protected and communal lands, as well as mapping of the distribution of vegetation.
1.2
Problem Statement
Modelling of vegetation quality is important to improve understanding of wildlife distribution and foraging patterns (Mutanga 2004). Both phosphorus and sodium are limiting nutrients for herbivores in Savana rangeland. Ruminants are known to be selective foragers which prefer plants with high sodium concentrations (Skidmore et al. 2005). The remote sensing of foliar phosphorus and sodium is important for describing wildlife distribution and foraging behaviour but has been poorly investigated as compared to nitrogen (Mutanga & Kumar 2010). Effective game reserve management needs up to date spatial data on the distribution of vegetation communities as well as vegetation quality and quantity (Adam et al. 2010).
In Telperion game reserve, traditional field techniques are solely relied on to gather information about grass quality and quantity. However, these methods are labour intensive; require long hours in field work and laboratory analysis and do not allow for generation of detailed vegetation maps (Mutanga & Skidmore 2004).
Remote sensing technique offer detailed and most recent information on vegetation quality and quantity. Hyperspectral and multispectral remotely sensed data has been successful in discriminating vegetation to species level due to the high spectral resolution (Schmidt & Skidmore 2003). The narrow bands in hyperspectral data allow for detailed discrimination of vegetation species which can be masked if multispectral data is used (Mutanga et al. 2003). The much complicated procedures of processing and analysis of hyperspectral data can result in poor classification or performance of the classifiers (Adam et al. 2012).
Zengeya et al. 2012). These sensors offer good spectral resolutions but, the high cost associated with these commercial data has limited the accessibility specially in the developing countries such as South Africa (Cho et al. 2015).
Sentinel-2 Multispectral Imager (MSI) has great potential in effective protected area management due to its unique spatial and spectral resolutions as well as higher signal to noise ratio (Sibanda et al. 2015). The use of Sentinel-2 MSI is driven by the fact that it is freely available and has high temporal resolution with wide swath width making it more appropriate for regional applications (Mutanga et al. 2016; Sibanda et al. 2015). Freely available remote sensing data offer private game reserves such as Telperion to utilise remote sensing technology to map grass quality and quantity with no added costs to the reserve financial budget.
Based on the best available data, no study has tested the use of Sentinel-2 data in mapping grass communities and predicting vegetation quality such as P and Na. The results of the study will enable interpretation of the fundamental interactions of grass status with energy of the electromagnetic waves detected by the multispectral sensors. The resulting map of the study together with ground survey data will provide significant information upon which wildlife management decisions in Telperion game reserve can be based on.
1.3
Aims and objectives
The main aims of this study are to explore the utility of Sentinel 2 MSI data in mapping grass community quality and quantity at Telperion game reserve.
The specific objectives are:
To map the most common grass communities at the game reserve using Sentinel-2 MSI and Artificial Neural Network classifier.
Test the use of Sentinel-2 MSI in estimating foliar phosphorus and sodium concentration across different grass communities.
CHAPTER 2
2 LITERATURE REVIEW
2.1Mapping grass communities quality and quantity
Grassland ecosystems are estimated to cover up to 40.5% of the total land area on earth (White et al. 2000). However, biodiversity in grasslands is impacted upon by various factors such as type of land use practices, landscape structure and topography (Hubbell 2001). The existence of grass species that are significant for grazing in rangelands have been affected by overgrazing and unsustainable agricultural activities (Skidmore et al. 2010). For sustainable and effective national resource management, spatial data on grass species and communities distribution is essential to understand land productivity and the ecosystem functions and services ( Ramoelo et al. 2015; Svoray et al. 2013; Cho et al. 2012; Adjorlolo et al. 2012) and livestock feeding patterns (Knox et al. 2012).
The estimation of vegetation traits (biophysical and biochemical) of vegetation is important in many ecological application (Asner 1998). In grasslands, accurate estimates of quality and quantity are significant as there is variation in space and time. Detailed maps of grass biophysical variables are helpful in managing and conserving conservation areas and endangered habitats.
In natural ecosystem, understanding of plant growth processes is guided by characterization of plant nutrients such as sodium and phosphorus (Ramoelo et al. 2013). Mineral nutrients such as phosphorus, sodium, calcium and potassium have been found to be limiting minerals for herbivores in savanna rangelands (McNaughton 1983).
Various studies have demonstrated that wildlife feeding behaviour and distribution is largely determined by the pasture quality and quantity (Mutanga & Kumar 2007; Adjorlolo et al. 2015). Estimation of grass P and Na are important in understanding wildlife feeding and migration patterns (Wang et al. 2015). Information on grass quality and quantity is essential
resource use within conservation areas (Mutanga & Skidmore 2007), monitoring of grazing patterns (Skidmore et al. 2005) and productivity of rangeland ecosystems (Mutanga 2004). East and Southern African studies have revealed nitrogen as the most restricting nutrient for herbivores and it was also found that migration patterns of wildebeest in the Tarangire ecosystem is determined by phosphorus (Mutanga & Kumar 2007; Mutanga 2004). Mapping of grass communities has been dependant on traditional techniques such as literature review, use of aerial photographs, field surveys and image spectroscopy (Adam et al. 2012; Youngentob et al. 2012). For example , Ramoelo et al (2013) determined the foliar nitrogen: phosphorus ratio using field spectroscopy, while Mutanga et al (2004) discriminated sodium concentration in mixed grass species using field spectroscopy. However, these techniques require intensive labour, complicated analysis and often data captured does not fully represent the landscape (Adam et al. 2014).
Remote sensing provides multiple advantages over traditional field mapping methods such as time efficient maps, accessibility to complex terrains and repeat mapping of same area over different periods (Mutanga et al. 2016).
2.2Mapping grass quality and quantity using multispectral data
Over the years, different vegetation types and ecosystems have been successfully mapped using multispectral data. Using integrated LIDAR data in combination with multispectral images to classify vegetation in Canada, Bork and Su (2007) reported an overall accuracy of 91%.
In Finland, Toivonen and Luoto (2003) used Landsat imagery in mapping grasslands and achieved high accuracy results of 89% ; South American grasslands were differentiated by Baldi et al (2006) with accuracies between 90% and 95%; (Masocha & Skidmore 2011) achieved an overall accuracy of 80% in their study when they discriminated warm and cold season grasslands in the USA. In Mangolia, Yokota et al (2005) assessed vegetation indices of MODIS with those of AVHRR while monitoring the forage quality and quantity.
The assessment of grassland use and monitoring of changes over time has been done in certain studies. In Peru, object based classification of Landsat image between 1987 and 2007 was used to investigate changes in grassland ecosystem, an annual decrease in the spatial extent of the grassland ecosystem was observed and an overall accuracy of 80.3% was achieved. Price et al (2002) investigated in USA the potential of Landsat and ERS-2
three commonly used grass in areas with high cool and warm season grasses. An accuracy value of 91% was achieved using Landsat data and 73.2% using the SAR data. Masocha and Skidmore (2011) implemented a hybrid classification method in southern Zimbabwe to map invasive species.
2.3 Mapping grass quality and quantity using hyperspectral data
Vegetation quality and quantity has been successfully mapped through the use of hyperspectral data.
Cushnahan et al (2011) in New Zealand successfully identified grass species with a high accuracy using hyperspectral data. Boschetti et al (2007) used Landsat 7 to assess pasture production in the Italian Alps and produced a biomass mapping. Adam et al (2014) also followed the same methodology to estimate biomass using hyperspectral data. They successfully mapped and identified wetland vegetation species using hyperspectral data. They achieved high individual species class accuracies which ranged from 93.73% to 100% and kappa value of 0.87.
Mutanga and Kumar (2007) found a correlation between phosphorus and nitrogen in their study to estimate phosphorus and nitrogen in South African Savannas using hyperspectral data. However, limited studies to predict foliar phosphorus and sodium have been done in rangelands. Since there is a correlation between phosphorus and nitrogen, an assumption that through the prediction and mapping of foliar nitrogen, phosphorus has been indirectly predicted and mapped. Ramoelo et al (2013) determined a high phosphorus and nitrogen ratio in their study using hyperspectral data. Zhang et al (2011) also confirmed that there is a synergistic relationship between foliar nitrogen and phosphorus in grassland species in a study done in China.
Mutanga (2004) found variations of foliar sodium in different species ranging from 0.02 % to 0.2 %. However, Axelsson et al (2012) were unsuccessful in using hyperspectral data to map foliar phosphorus and sodium in mangrove species, as they only mapped and predicted nitrogen. Ferwerda and Skidmore (2007) successfully studied the foliar concentrations of phosphorus, sodium, calcium and magnesium in three tree species and one shrub. They obtained R2 = 0.51 for phosphorus and sodium was best predicted using continuum-removed spectra (R2 =0.02).
Different remote sensing techniques offer significant and reliable information about the distribution of forage quality which can be integrated in decision making in the management and conservation of rangelands (Svoray et al. 2013). There are challenges associated with the use of hyperspectral data such as high dimensionality caused by narrow bands, therefore, in order to discriminate vegetation species accurately, large training points must be created (C Adjorlolo et al. 2012).
Additional detailed investigations using hyperspectral remotely sensed data to assess grassland quality are needed. Such investigations will exploit the many bands of the vegetation indices at different wavelengths making it possible for researches to extract more vegetation parameters.
2.4 Mapping grass quality and quantity using new generation multispectral
The launch of the new generation sensors which have high spectral and spatial resolutions is seen as advancement to the hyperspectral and multispectral sensors. These new sensor offer un- matched spectral and spatial spectral resolution which offers researchers opportunity for much detailed monitoring and assessment of vegetation.The ability of multispectral data to estimate and map grass biochemical content such as nitrogen in Africa has been investigated by Adjorlolo and Botha (2015). Furthermore, successful mapping of estuarine vegetation in St Lucia was achieved by Luck –Vogel et al (2016). However, there is a shortage of studies to map foliar phosphorus and sodium using new generation multispectral data.
Odindi et al (2014) was successful in evaluating the utility of the new generation WorldView-2 and SPOT -5 images in mapping the bracken fern in South Africa. The overall accuracy of 84.72% and 72.22% were achieved for the WorldView -2 and SPOT-5 images. A similar study in Australia by Rasel et al (2016) compared capability of WorldView-2 and Landsat 8 in saltmarsh mapping and accuracy assessment,WorldView-2 data produced a higher accuracy of 92.12% and Landsat data yielded overall accuracy of 82.04%. The high performance of the new generation sensors was illustrated in these studies.
In SA, Mansour and Mutanga (2012) successfully used Worldview data in mapping grass species in order to assess the grassland degradation. They successfully discriminated decreaser and increaser grass species and reported an overall accuracy of 90% and kappa of
0.87. However, they reported that the cost of image acquisition is too high and this can limit research in resource constrained countries.
Various remote sensing methods have been used to obtain information on grasslands biophysical parameters which include biomass, quality, and land degradation, grazing and stock.
Mapping of vegetation species using remote sensing data requires image classification techniques. However, in addition to the choice of the suitable remotely sensed data in terms of the cost and the resolutions (spectral and spatial), the choice of appropriate classification techniques is significant in order to produce reliable accurate vegetation mapping (Adam et al. 2014).
2.5 Classification of vegetation
Image classification is considered as one of the significant steps in remote sensing studies as it because it retrieves and converts vegetation information from satellites image into thematic layers that can be easily interpreted (Cingolani et al. 2004; Schmidt & Skidmore 2003). There are different classification algorithms that have been successfully applied to gather vegetation information from multispectral and hyperspectral remotely sensed data (Omer et al. 2015; Dube & Mutanga 2015a; Adelabu et al. 2014; Mutanga & Rugege 2006). However, much recognition has been given to the advanced methods of image classification such as support vector machines (SVM), Random Forest (RF) and artificial neural networks (ANN) due to their greater effectiveness in image processing. However, each of these methods has its own advantages and limitations and they are briefly described below.
2.5.1 Support Vector Machine
The SVM has been defined as a supervised classifier trained to find the most effective classification hyperlane through reducing the upper bound of the classification error (Cortes and Vapkin 1995; Dlamini et al. 2016). In SVM, the hyperlane leaves the maximum margin between two classes, where the margin has been defined as the sum of the distances of the hyperlane from the nearest point of the two classes, if there is inseparability between the classes the SVM searches for the hyperlane that maximizes the margin while minimizing a quantity proportional to the number of misclassification errors (Vapkin 1995; Dlamini et al. 2016).
According to Seetha et al (2017) the benefits of SVM are that: overfitting problem is unlikely to occur; it models nonlinear class boundaries; reduces computational complexity, easy to control complexity of decision rule and frequency of error.
Seetha et al (2017) further explained that the limitations associated with the use of SVM are: slow training; difficulty in determining optimal parameters when training data is not linearly separable and the structure of the algorithm is complex and users find it difficult to understand. However, SVM is believed to be competitive in the classification of high dimensionality data sets.
2.5.2 Random Forest
RF classifier is a combination of tree classifiers produced through the use of a random vector sampled independently from the input vector, each tree votes for the most popular class to classify an input vector (Breiman 1999). The major advantage of RF classifier is that it requires that two parameters be set; can handle categorical data, and can detect outliers through the use of proximity analysis.
2.5.3 Artificial Neural Network
In this study ANN was chosen because the textural features used in ANN assist in solving misclassification associated Seetha et al (2017). Furthermore, ANN has the ability to tolerate noisy inputs.
In their study, Seetha et al (2017) concluded that neural network approach of classification improves the accuracy and finer information from the individual class is obtained through the use of texture.
ANN performance has been reported to be higher that other traditional classifiers such as maximum likelihood, minimum distance to mean and decision trees (Atkinson & Tatnall 1997). Such classification methods are restricted due to the use of large datasets and use of limited training samples to generate a map (Omer et al. 2015).
2.5 Conclusion
Traditional methods for mapping vegetation quality and quantity have been successful used. However, these techniques only allow for assessments at a local scale. The advancement of remote sensing provided researchers with an opportunity to map vegetation quality at national and regional scale. However, this opportunity is costly as most of the remote sensing data are
commercialised and not freely available. The newly launched Sentinel-2 has red edge bands which allows for grass mapping and estimation of foliar parameters at a regional scale. The potential of Sentinel-2 mapping grass species has never been done but its application in forestry yielded satisfactory results on grass quality and biomass estimation.
Great outstanding progress in the field of remote sensing from the use of aerial photographs to the use of multispectral scanners (Mutanga et al. 2016) has been made. The importance of aerial photographs cannot be ignored but much attention has been focussed towards the use of multispectral scanners due to higher spatial and spectral resolution and low costs (Mutanga et al. 2016). Multispectral sensor technology has advanced from new generation multispectral scanner, second generation Landsat Thematic Mapper (TM) and Satellite Pour I’Observation de la Terre (SPOT) with higher accuracy (Mutanga et al. 2016).
Strategic bands within multispectral sensors allow for detection of foliar biochemicals and discrimination of vegetation at species level. The use of multispectral sensors such as Worldview-2 and RapidEye have produced similar results to those achieved using hyperspectral data (Mutanga et al. 2016; Adjorlolo et al. 2015).
Chapter 3
3 Mapping grass communities using Sentinel -2 image
3.1Introduction
Grassland biome is classified as being the second largest biome after Savanna biome in South Africa (Carbutt & Martindale 2014). The main threats within the Grassland Biome are agriculture, coal mining and alien invasive species (Carbutt et al. 2011).
The existence of grass species that are significant for grazing in rangelands have been affected by overgrazing and unsustainable agricultural activities (Skidmore et al. 2010). For sustainable and effective national resource management, spatial data about the distribution of the grass species and communities is essential to gain knowledge on land productivity and the ecosystem functions and services (Ramoelo et al. 2015; Svoray et al. 2013; Cho et al. 2012; Mansour et al. 2012; Adjorlolo et al. 2012) and livestock feeding patterns (Knox et al. 2012).
Traditional survey methods such as field observation, indigenous knowledge and photographs can yield better results of mapping grass communities at local scale (Adjorlolo et al. 2012). However, such traditional techniques involve intensive field work which is time consuming and costly (Adam et al. 2012).
Over the last three decades, remote sensing has increasingly been used in mapping vegetation species (Skidmore et al. 2010b; Adelabu et al. 2014; Thenkabail et al. 2016; Vaglio Laurin et al. 2016a; Curran 1989). Remote sensing has been reported to be timely, cost effective techniques in providing accurate spatial information on grass species quality and quality (Ramoelo et al. 2015).
Both multispectral and hyperspectral remote sensing data have been successfully used in mapping grass species and communities. Vegetation mapping studies have successfully been done using multispectral data (Odindi et al. 2014; Adam, et al. 2014; Mansour et al. 2012; Ingram et al. 2005).
Multispectral data are affordable and easy to acquire and to process (Mansour et al. 2016). There are limitations that have been identified to be associated with multispectral images such as Landsat and SPOT when mapping vegetation and plant species.
The effectiveness of multispectral data when mapping vegetation species is limited by their spectral and spatial resolutions, which are sometimes not useful for vegetation mapping and identification (Adam et al. 2017).
Spatial and temporal resolution limitations associated with Landsat imagery makes it difficult to map and distinguish species at species level in heterogeneous environments. Furthermore, Landsat image quality decreases when the interest of period is within a rainy season.
Hyperspectral remotely sensed data has been most commonly and successfully used in vegetation mapping as they possess advantageous narrow bands (Thenkabail et al. 2011; Zhang et al. 2011; Skidmore et al. 2005; Marshall & Thenkabail 2015). The high spectral resolution allows for identification of spectral features that are vital for discriminating different grass species and classifying them at species level which is otherwise be masked by multispectral data (Mansour et al. 2016; Cho et al. 2012; Vaglio Laurin et al. 2016b). However, whereas high spectral resolution of the hyperspectral data allows accurate detection and identification of vegetation species, many challenges such as data cost, poor accessibility to the data, image processing and analysis have limited the use of hyperspectral data particularly in developing countries (Ramoelo et al. 2013).
Over the last 10 years, there has been development of new-generation satellites such as RapidEye, SumbandilaSAT and WorldView2 (Adam et al. 2014) which are considered to be much more improved than first generation multispectral sensors (Ramoelo et al. 2015). These new sensors allow for more detailed classification of complex vegetation communities (Stratoulias et al. 2015). This is due to the fine spatial resolution coupled with a sensible number of spectral bands arranged in different regions of the electromagnetic spectrum (red edge) (Ramoelo et al. 2015).
Researchers have successfully investigated the use of these new multispectral data in different vegetation studies such as vegetation species mapping (Vaglio Laurin et al. 2016; Mansour et al. 2016; Odindi et al. 2014; Dalponte et al. 2012). However, since these are commercial sensors, they come with their own limitations in terms of cost and availability (Adam et al. 2014).
On the 23rd of June 2015, the European Space Agency (ESA) launched Sentinel-2A satellite which is one of the very first two of the Sentinel-2 mission (Navarro et al. 2017). Sentinel-2 has a high resolution multispectral Instrument (MSI) with a wide swath (Sibanda et al. 2015).
infrared region (NIR) to short wave infrared (SWIR) at different spatial resolution allows for measurement of earth’s reflected radiance (Navarro et al. 2017). The integration of the four narrow bands in red edge region of Sentinel allows for enriched vegetation assessment (Stratoulias et al. 2015). The wide swath and frequent revisit time of Sentinel is advantageous in that it allows the sensor to provide continuous monitoring of vegetation (Sibanda et al. 2015). Sentinel was designed to outperform the Landsat mission (Stratoulias et al. 2015).
Classification methods are important for mapping of vegetation species using remotely sensed. Hence, in addition to the choice of the suitable remotely sensed data in terms of the cost and the resolutions, the selection of appropriate classification method is vital for reliable accurate vegetation mapping (Adam et al. 2014).
Numerous advanced classification algorithms such as classification trees, random forest (RF), artificial neural networks (ANN), support vector machines (SVM), partial least squares regression have been applied to derive vegetation data from multispectral and hyperspectral images (Omer et al. 2015; Dube & Mutanga 2015a; Adelabu et al. 2014; Mutanga & Rugege 2006). However, much attention has been given to RF, SVM and ANN due to their greater image processing effeciveness. The application of ANN algorithm has been widely used in classifying forest species using multispectral imagery (Atkinson & Tatnall 1997). ANN is a machine learning system which encompasses interrelated linkages of indeterminate processing elements (Atkinson & Tatnall 1997; Liu et al. 2013; Omer et al. 2015). These linkages are categorized by a robust pattern recognition ability allowing representation of complex multivariate data forms (Atkinson & Tatnall 1997). Advantages of ANN have been attributed to its statistical methods which include generalization for technique with multiple images (Wang et al. 2009), easy adaptation to different types of data and input and its ability to use limited training data to categorize data as compared with other traditional classifiers (Omer et al. 2015).
The ANN performance has been demonstrated in previous studies to be higher than that of traditional classifiers such as maximum likelihood, minimum distance to mean and decision trees (Atkinson & Tatnall 1997). These traditional classification methods are dependent on the assumptions which restrict their potential to use large datasets and map areas with restricted training samples (Omer et al. 2015)
On the basis of the best available knowledge, Sentinel-2 data has never been used in mapping of grass species. Therefore, the objective of this study was to examine the utility of the
Sentinel-2 satellite data for mapping grass species in Telperion nature reserve using ANN classification algorithm.
3.2 Methodology
3.2.1Study Area
The study area is Telperion Nature Reserve which forms part of the eZemvelo nature reserve. The reserve is approximately 13000 hectares in size and situated at the border between Gauteng and Mpumalanga Provinces, Telperion falls within the far north of the Grassland Biome located in Mpumalanga Province of South Africa (25° 41′ S, 28° 56′ E) (Fig 1). Mucina and Rutherford (2006) classified the vegetation type as the Mixed Bushveld and Bankenveld Grassland vegetation type.
These vegetation types is considered to be endangered and small patches are protected in statutory conservation reserves and private reserves (Mucina and Rutherford, 2005) and the domininat grass species identified by (Coetzee 2012) are: Themeda trianda, Eragrostis curvula, Sporobolus africanas ; Setaria sphacelata ,Hyparrhenia hirta and Cynodon dactylon.
The study area is characterised by a mean annual temperature of and receives summer rainfall. The Wilge River which is a tributary of the Oliphant’s River, flows northwards through the reserve, the river is fed by various wetlands and smaller streams.
Figure 1: Study area map showing Loskop Mountain Bushveld and Rand Highveld vegetation
3.2.2Image acquisition and pre-processing
An image from Sentinel 2 sensor was used in this study. Sentinel-2 image was downloaded from the Sentinel’s Scientific Data Hub (https:scihub.copernicus.eu/) on the 20th
of May 2016. The data was radiometrically and geometrically corrected using the Top-Of Atmosphere (TOA) products. Additional corrections which were done include orthorectification as well as spatial registration on a global reference system. Sentinel 2 Toolbox was used to process the image to Level 2 data.
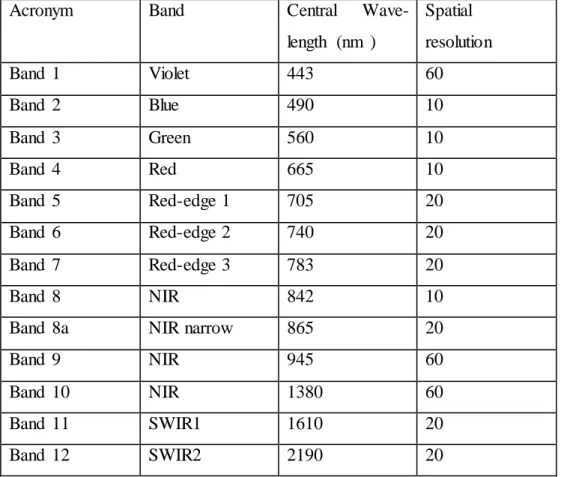
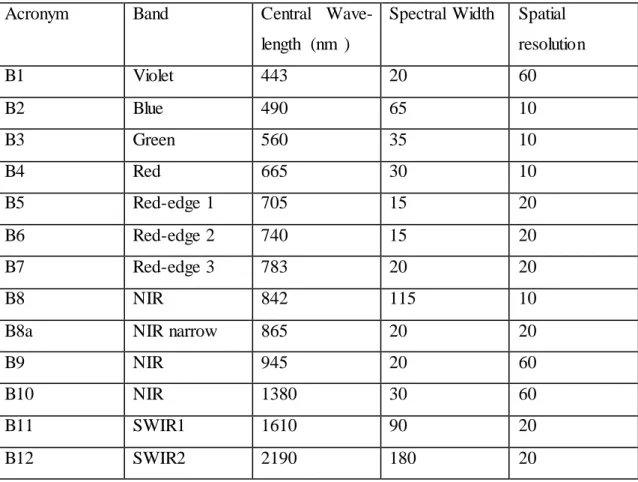
The image was atmospherically corrected using Sen2Cor plugin which is a prototype processor of Sentinel-2. Sen2Cor processor has been designed to execute functions such as atmospheric, terrain and cirrus correction as well as a scene classification. The image was re-sampled based on the sampling distance (10m,20m,60m ) as per the spectral bands resolution as shown in Table 1 below.
Re-sampling of the image was done using a constant Ground Sampling Distance (GSD) of 10m, 20m and 60m based on the resolution of different spectral bands as shown in Table 1 below.
Table 1Sentinel 2 MSI spatial and spectral resolutions
Acronym Band Central
Wave-length (nm ) Spatial resolution Band 1 Violet 443 60 Band 2 Blue 490 10 Band 3 Green 560 10 Band 4 Red 665 10 Band 5 Red-edge 1 705 20 Band 6 Red-edge 2 740 20 Band 7 Red-edge 3 783 20 Band 8 NIR 842 10
Band 8a NIR narrow 865 20
Band 9 NIR 945 60
Band 10 NIR 1380 60
Band 11 SWIR1 1610 20
Band 12 SWIR2 2190 20
( ESA, 2016)
3.2.3 Ground reference data collection
Sampling was done between the 21st and the 25th of May 2016 soon after remotely sensed data acquisition. This period is usually characterised by moderate to high rainfall and high biomass productivity, but in the year 2016, the country was experiencing severe drought which was declared as a natural disaster. As a result, the grass was drier than expected during the time of sampling.
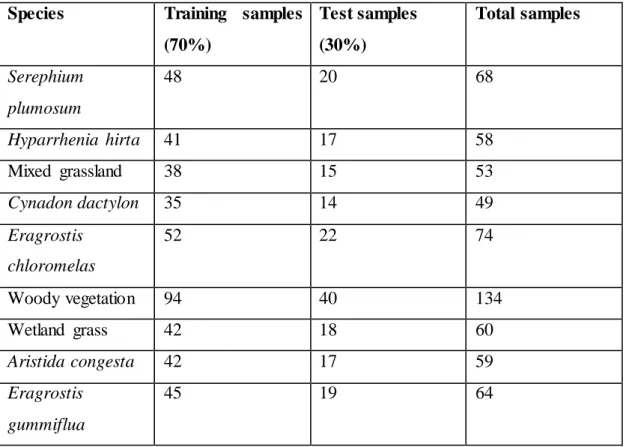
In each identified sample point, vegetation plot (20m by 20m ) was constructed comprising of a homogenous area of the grass communities. The ground reference data was then randomly partitioned for classification into training sites (70%) and test sites (30%) as shown in Table 2 below.
Using field sample points a point map was created. The map was then overlaid on the Sentinel-2 image to Region of Interests (ROIs) for training and test which were then used to gather image spectra from grass species.
Table 2.Training and test data set for grass species
Species Training samples
(70%) Test samples (30%) Total samples Serephium plumosum 48 20 68 Hyparrhenia hirta 41 17 58 Mixed grassland 38 15 53 Cynadon dactylon 35 14 49 Eragrostis chloromelas 52 22 74 Woody vegetation 94 40 134 Wetland grass 42 18 60 Aristida congesta 42 17 59 Eragrostis gummiflua 45 19 64
3.3 Image classification
Artificial Neural Network algorithm was used to classify the Sentinel-2 image. A resultant map showed the spatial distribution of different vegetation communities in Telperion game reserve.
3.3.1 Artificial Neural Network (ANN) Classifier
Neural Networks are described as knowledge based artificial intelligence technique (Atkinson & Tatnall 1997). ANN is non-parametric mathematical model independent of assumptions of data normality (Omer et al. 2016). ANN attempts to imitate mimic neural linkages (Omer et
which are connected in order to process the information (Omer et al. 2016; Atkinson & Tatnall 1997; Omer et al. 2015). ANN is better compared to other classification methods (Omer et al. 2015). The advantage is attributed to its nonparametric nature, as such; no previous information on the distribution of the input data is required (Omer et al. 2015). ANN has gain popularity and is used much more often than other statistical classifier (Omer et al. 2015). This is due to advantages such as high accuracy as compared other statistical classifiers (Omer et al. 2015) as well as and once they are trained; integrate unique data types including different sensor information into analysis, thus enabling collaboration in different field of studies (Atkinson & Tatnall 1997). ANN has various models that have been used in remote sensing (Omer et al. 2015), these have been identified as back propagation (BP), RBF and Multilayer perceptron (MLP) (Omer et al. 2015). The ANN commonly uses the MPL structure which is comprised of input layer and nonlinear activating nodes (Omer et al. 2015). When data has been processed, perceptron learning is achieved through modifications in linkages. An MPL has been described as a ANN model that maps input data based on suitable output (Omer et al. 2016). Various land cover classification studies have used ANN to classify different land cover as well as vegetation spectral discrimination. The most popular ANN structure of algorithm is MPL model that uses the BP algorithm. In this study, ANN classification algorithm was used for mapping different grass communities using Sentinel 2 data.
3.3.2 Accuracy assessment
In classification, accuracy assessments are important. In this study, a 70% subset of the reference data was used for training the model. The model validation was done using the 30% of the remaining data. In order to make a comparison of the true class and the predicted class, a confusion matrix was created (Omer et al. 2016). From the confusion matrix the overall accuracy (OA) which is the overall probability that test data has been accurately classified (Congalton & Green) and producer’s accuracy (PA) defined as the possibility of a certain class being accurately classified and user’s accuracy which is the reliability of the classes that are in the classified image (Congalton & Green 2008) were calculated. The kappa coefficient lies between 0 and 1 values and it represents the variation between the actual and expected agreement (Adam et al. 2014). When kappa coefficient is 1, it shows the best agreement between classification and ground pixels, non-agreement is represented by a value
3.4. Results
3.4.1 Classification
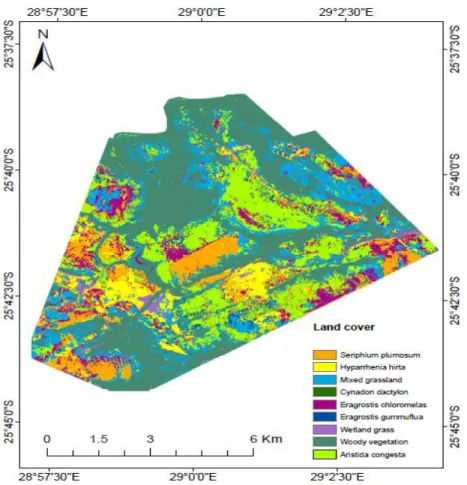
The below map shows distinct species that were classified using ANN classifier and their distribution across the study area. Woody vegetation was classified as the most dominant vegetation type within the study area.
Figure 2: Classified vegetation of the study area using ANN classifier
3.4.2 Accuracy Assessment
The classification results showed the performance of ANN algorithm in distinguishing different species as shown in Table 3 below. The classification model achieved overall accuracy of 81% and Kappa Coefficient of 0.78% as shown in Table 4 below. Variations of User and producer accuracies of single species are depicted in Table 4.
Table 2 Confusion matrix showing the overall classification and Kappa distinguishing among vegetation species. AC CD EC EG HH MG SP WG WV Row Total AC 11 2 0 0 0 0 0 0 1 14 CD 0 12 0 2 0 1 0 0 0 15 EC 0 0 19 1 0 1 1 0 1 23 EG 0 0 0 16 0 0 1 0 0 17 HH 1 0 0 1 16 1 0 0 0 19 MG 1 0 2 0 0 11 1 1 0 16 SP 2 0 1 1 0 1 13 0 3 21 WG 0 2 0 0 0 0 1 15 0 18 WV 0 0 0 1 1 0 2 0 35 39 Column Total 15 16 22 22 17 15 19 16 40 182
The above confusion matrix shows the performance of the ANN model in classification. Different vegetation species were classified; Serephium plumosum (SP);Hyparrhania hirta
(HH); Mixed grassland (MG) ;Cynadon dactylon (CD); Eragrostis chloromelas
(EC);Eragrostis gummiflua (EG)Wetland grass (WG) , Woody vegetation (WV) and Aristida Congesta (AC) The error was determined based on the OOB method and test dataset (Mansour & Mutanga, 2012).
Table 3 Producer's accuracy (%) and user's accuracy (%) of nine classes (SP, HH, MG, CD, EC, EG, WG and AC) using all Sentinel-2 bands
AC C D EC EG HH MG SP WG WV Produc er accura cy 73.333 33 75 86.363 64 72.727 27 94.117 65 73.333 33 68.421 05 93.75 87.5 User accura cy 78.571 43 80 82.608 7 94.117 65 84.210 53 68.75 61.904 76 83.333 33 89.743 59
The accuracy achieved for all species (MG, HH, CD, EC, EG, WG, WV, AC, MG) was high. HH class had the highest 94% (HH) and the lowest accuracy was achieved was 64 (SP). The SP class was underestimated in the classified image.
The reliability of pixels that were correctly classified was higher in MG, HH, CD, EC, EG, WG, WV and AC. However, MG only achieved the lowest user’s accuracy of 62% meaning that there were some pixels that were misclassified.
The achieved Kappa was 0.78 and the error rate of 0.18 was achieved in this study as shown in Table 5 below. The low error rate achieved by the classifier demonstrates the high performance of the classifier in correctly classifying the different grass species.
Table 4 Kappa, overall accuracy and Error rate
Kappa 0.786503
Overall accuracy 0.813187
3.5 Discussion and conclusion
The ability to accurately locate and map different grass species within rangeland provides valuable information (Ramoelo et al. 2013) which can help to guide effective management of natural resources in rangeland and give understanding on wildlife and livestock grazing and distribution patterns.
In this study the performance of ANN algorithm and the ability of the Sentinel-2 data to map the different grass species and their distributions in Telperion Nature Reserve was assessed. Woody vegetation was found to be the most widely distributed vegetation within the study area as shown in Fig. 1 with dominant grass species mapped as Aristida congesta.
Multispectral satellites with medium spatial resolution (30-100m) have produced grass species maps with lower accuracy for operational application. Imagery from sensors with very high spatial resolution (<5m) have been reported to have limitations such as cost, availability, high dimensionality and processing (Adam et al. 2014). Application of remotely sensed data combined with field data is restricted by the limitations that are associated with the fine and medium scale remote sensing data.
The high overall accuracy 81% (Table 4) achieved demonstrates the ability to map different vegetation types and species through the use of multispectral data. Such information provides more details on grass species distribution within conservation area. A kappa coefficient of 0.7 was achieved which shows that there was a perfect agreement between the classification and ground pixels (Table 5). A study by Omer et al (2015) yielded relatively lower accuracy (65%) when ANN algorithm was used.
The overall accuracy produced in this study is higher compared to overall accuracy achieved by Mansour et al (2015) (75%) using multispectral SPOT 5 imagery. Using WorldView-2 data, Mansour and Mutanga (2012) successfully mapped grass species and obtain overall accuracy of 90%.
Higher vegetation classification accuracies have been reported in studies using hyperspectral data (Vaglio Laurin et al. 2016a). However, the limitations associated with the use of hyperspectral data is the high cost, small spatial coverage, and the difficulties of image
processing (Thenkabail et al. 2016). Hyperspectral data can only be used for small scale surveys but can produce maps of exceptional thematic detail (Mutanga & Kumar 2007).
To increase accuracy, similar study using Sentinel-2 can be replicated but across different seasons. This study was done during a period of severe drought in South Africa. As a result, the grass was dry and at low productivity stage when image was acquired. As grasses senesce, they exhibit red/brown colour which create spectral confusion with the bare soil. Additionally, a much more advanced classification algorithm may be used to achieve higher accuracy results.
Classification information obtained from this study is useful for effective resource management and will help rangeland managers to identify the distribution most dominant grass species. Such information will give guidance to rangeland managers as to which species to introduce and as well as grazing/ feeding patterns of wildlife and livestock.
Chapter 4
4 Mapping grass phosphorus and sodium concentration using Sentinel-2
imagery
4.1Introduction
South African grassland biome is considered to be the most agriculturally productive land and has numerous mineral deposits most of which are extracted for economic gains (SANBI 2012). One of the most challenges experienced in grassland ecosystem is the high levels of transformations as a result of overgrazing and overstocking (Ali et al. 2016). Understanding the grassland ecosystem quality and quantity is crucial for explaining the functions and dynamics of grassland.
Grass quality refers to the characteristics that influence grass intake by wildlife such as crude and digestibility which is a measure of the proportion of grass that can be used by animal (Mutanga 2004). The quantity and quality of vegetation determines the amount of material that can be digested by herbivores (Knox et al. 2011).
Grass nutrients such as phosphorus, sodium, magnesium and calcium have been identified as essential nutrients which determine foraging preference in herbivores (Knox et al. 2011; Prins 1996). Spatial information about grass nutrients is essential to advice rangeland managers to manage their grazing lands effectively. Studies done in savanna rangelands revealed that phosphorus is one of the limiting minerals in herbivores (MacNaughton & Banyikiwa, 1995) whereas sodium was found to influence the distribution of wildlife as herbivores prefer sodium enriched forage (Mutanga & Skidmore 2004).
Mapping of grass (phosphorus) (P) and sodium (Na) provides useful data for sustainable resource use, planning and management of wildlife and livestock by nature reserve managers, conservation planners and livestock farmers (Ramoelo et al. 2012b). Leaf phosphorus concentration determines the migration behaviour of wildebeest in the East African savanna (Voeten 1999).
Studies to estimate vegetation quality have mainly been focussed on mapping foliar concentration of nitrogen (Kaszta et al. 2016; Vaglio Laurin et al. 2016; Zhang et al. 2011; Marshall et al. 2016; Skidmore et al. 2005; Ling et al. 2014) and useful results have been
studies have been done to map foliar phosphorus concentration even though it is considered to be of equivalent importance as nitrogen in establishing herbivore feeding patterns (Mutanga & Kumar 2007; Mahajan et al. 2014; Ramoelo et al. 2013).
Wildlife prefer specific feeding sites and plant species to maximise essential nutrient uptake and avoid the risk of malnutrition (Mutanga et al. 2004). The advancement of various pasture quality predicting techniques is important for explaining wildlife feeding and distribution patterns (Mutanga et al. 2004).
Traditional methods for detecting and mapping pasture quality are associated with high laboratory analysis costs and require comprehensive sampling. These methods have been found to be limited to small and local scale mapping (Adam et al. 2014).
The advancement of spatial, spectral and temporal resolution in remote sensors has awarded researchers with an opportunity to evaluate and monitor vegetation quality and quantity conditions (Curran et al. 2001). Satellite remote sensing offers cost effective methods for surmounting the challenge of field-based survey (Mutanga et al. 2003; Mutanga et al. 2005; Skidmore et al. 2010; Mutanga & Skidmore 2007; Mutanga & Skidmore 2004) Multispectral and hyperspectral remote sensing methods have been developed steadily (Adam & Mutanga, 2009) and successfully over time to predict vegetation quality and quantity (Liu et al. 2015; Atzberger et al. 2015; Zlinszky et al. 2015 Knox et al. 2011; Ausseil et al. 2011; Ferwerda et al. 2007).
The lack of the spectral resolution has been considered to be one of the limitations with the use of the vegetation indices calculated from broad multispectral bands (Blackburn 1998; Thenkabail 2000). However, Multispectral data has been found to be cost effective and easy to process (Mansour et al. 2016).
Various studies have successfully assessed vegetation quality through the use of hyperspectral remote sensing data (Thenkabail et al. 2016; Kaszta et al. 2016b; Zhang et al. 2011; Skidmore et al. 2005; Knox et al. 2011b; Wang et al. 2015; Mutanga & Skidmore 2004). The contiguous of hyperspectral narrow bands make it possible to understand and estimate the fluctuations in biochemical and biophysical features of plants as which has been difficult with the use of multispectral remote sensing (Zhang et al. 2011).
In the use of hyperspectral, studies have found that the shape and position of the “red edge” (the transition from visible to near-infrared portions of the spectrum - 690 to 800 nm) was
most sensitive to vegetation quality variations). The term ” red edge” refers to the region of sudden change in leaf reflectance between 690 and 800 nm (Mutanga & Skidmore 2007) because of high chlorophyll absorption in red wavelengths and high reflectance in the NIR wavelengths due to internal leaf scattering (Horler et al. 1983). Multispectral sensors such as Landsat, SPOT, ASTER, and MODIS have coarse spatial resolution and do not possess the red edge region (Sahoo et al. 2015)
In the last 10 years, a number of space borne sensors such as RapidEye, SumbandilaSAT and WorldView2 have been developed for a wide range of applications including vegetation mapping (Adam et al. 2014). These remote sensing sensor are considered to significant improvement on multispectral satellites technology (Abel Ramoelo et al. 2015). The new generation multispectral sensors such as WorldView-2 and RapidEye offer more wavebands (up to 13 bands) and higher spatial resolution (1.5 m) than the traditional broadband satellite images such as SPOT and Landsat TM while reducing unnecessary loss of essential information as in hyperspectral image such as Hyperion (Stratoulias et al. 2015). The new generation sensors have been widely used over the last decade to estimate vegetation quality and quantity these include: nitrogen (Ramoelo et al. 2012b; Dube & Mutanga 2015a) biomass (Adam et al. 2014; Greaves et al. 2016; Jin et al. 2014; Lu 2005), leaf area index (Delegido et al. 2013; Haboudane 2004) and good results have been obtained.
In June 2015, Sentinel-2A satellite which is one of the very first two of the Sentinel-2 mission, was launched by the European Space Agency (ESA) (Navarro et al. 2017). Sentinel -2 has a wide swath and comprises of 13 spectral bands stretching from the VIS and NIR to SWIR at unique spatial resolutions allowing measurements of earth’s reflected radiance (Navarro et al. 2017). One of the advantages of Sentinel-2 is that it offers a good temporal resolution with frequent revisit time of 5 days which allows continuous monitoring of vegetation condition (Sibanda et al. 2015).
Random forest (Breiman, 2001) has been increasingly used to improve accuracy in prediction accuracy in remote sensing applications (Grimm et al. 2008). Many researchers have used random forest as a classification algorithm (Mureriwa et al. 2016; Vincenzi et al. 2011; van Deventer et al. 2015; Mureriwa et al. 2016; Rodriguez-Galiano et al. 2015). However, less studies have used RF as a regression algorithm (Mureriwa et al. 2016; Vincenzi et al. 2011; Adam et al. 2014; Mutanga et al. 2012). Random forest has been found to be able in
handling complicated relationships between predictors caused by noise and large data volume (Vincenzi et al. 2011; Ismail et al. 2010).
The objective of this study was to evaluate the performance of Sentinel 2 imagery and random forest model to predict and map foliar P concentration in Telperion game reserve.
4.2 Materials and Methods
4.2.1 Study area
The study area is Telperion game reserve which forms part of the eZemvelo game reserve. The reserve is approximately 13000 hectares in size and situated at the border between Gauteng and Mpumalanga Provinces, Telperion falls within the far north of the Grassland Biome located in Mpumalanga Province of South Africa (25° 41′ S, 28° 56′ E) (Fig 4). Mucina and Rutherford (2006) classified the vegetation type as the Mixed Bushveld and Bankenveld Grassland vegetation type.
These vegetation types is considered to be endangered and small patches are protected in statutory conservation reserves and private reserves (Mucina and Rutherford, 2005) and the domininat grass species identified by (Coetzee 2012) are: Themeda trianda, Eragrostis curvula, Sporobolus africanas ; Setaria sphacelata ,Hyparrhenia hirta and Cynodon dactylon.
The study area experiences mean annual temperature 22 ˚ C and receives summer rainfall. The Wilge River which is a tributary of the Oliphant’s River, flows northwards through the reserve, the river is fed by various wetlands and smaller streams.
Figure 3: Study area map Study area map showing Loskop Mountain Bushveld and Rand Highveld vegetation
4.2.2 Remote sensing data acquisition and processing
Sentinel-2 innovative feature of having three red edge bands having the ability to distinguish differences in chlorophyll pigments (Vaglio Laurin et al. 2016). Higher chlorophyll content shows higher nitrogen and phosphorus content in plant tissue (Curran, 1989). Eventhough, sentinel has promising potential, there is insufficient use in monitoring vegetation mostly in grasslands.
Sentinel-2 image was downloaded from the Sentinel’s Scientific Data Hub (https:scihub.copernicus.eu/) on the 20th of May 2016. The data was radiometrically and geometrically corrected using the Top-Of Atmosphere (TOA) products. Additional corrections were done included orthorectification as well as spatial registration on a global reference system. Sentinel 2 Toolbox was used to process the image to Level 2 data.
The image was atmospherically corrected using Sen2Cor plugin which is a prototype processor of Sentinel 2. Sen2Cor processor has been designed to execute functions such as atmospheric, terrain and cirrus correction as well as a scene classification (Anon 2017.). The