2018 International Conference on Modeling, Simulation and Analysis (ICMSA 2018) ISBN: 978-1-60595-544-5
An In-depth Study on Drag Reduction of Turbulent Channel Flow
Induced by Spatially Oscillating Lorentz Force
Wen-tang WU
1, *, Kun-peng WANG
1, Dong-ya WANG
1and Bao-chun FAN
21Beijing Institute of Tracking and Telecommunications Technology, Beijing, China
2State Key Laboratory of Transient Physics, Nanjing University of Science and Technology,
Nanjing, China
*Corresponding author
Keywords:Turbulent channel flow, Pseudo-spectral method, Drag reduction, Lorentz force.
Abstract. To investigate the in-depth mechanism of turbulence control and drag reduction in a channel flow by using a spatially oscillating Lorentz force, the pseudo-spectral method based on standard Fourier–Chebyshev spectral method is used to solve N-S equations. The characteristics of controlled flow fields and vortex structures are described as well as the mechanism of the flow field control. The result shows that the near-wall flow structure is altered substantially and the turbulence drag decreases sharply under the action of the distributed Lorentz force with proper control parameters, the boundary-layer fluid are reciprocating periodic moving, and the vortex generation is impacted, and that only periodically well-organized streamwise vortexes are observed in the near-wall region of the turbulent channel flow.
Introduction
Controlling turbulent flow artificially was believed to be extremely difficult several decades ago, until the discovery of turbulent coherent structures and improved understanding of the underlying physics of turbulent flow make us possible to realize efficient turbulence control, especially with an objective of skin-friction drag reduction [1, 2]. Most of such attempts have focused on suppressing the near-wall coherent structures, only if the turbulence production cycle could be favorably altered by modifying or disturbing any part of the near-wall activities [3]. Various control strategies have been proposed. Some control techniques are simplicity and more likely to be used in practice, such as longitudinal grooves or riblets, compliant coatings and large-eddy breakup devices etc. [4]. If the considered fluid has a non-zero electrical conductivity, the application of suitable magnetic fields and/or external electric currents organize a body force, called Lorentz force, distribution inside the fluid [4]. For low-conducting fluids, like seawater or electrolytes, a separate external electric field has to be applied to produce a sufficient electrical current density in the field, necessary for the desired flow control [5]. Electrical currents fed via electrodes will only slightly penetrate in to the fluid, so that the Lorentz force is noticeable in some vicinity of the electrodes and decays dramatically away from the surface [6]. Electro-magnetic (EM) actuators made of electrodes and magnets are used usually to produce the desired Lorentz force distribution. The near-wall force distribution is dependent on the EM actuator arrangement. Therefore, in order to achieve a specific goal, one has to choose the appropriate configuration of magnets and electrodes [7]. In this paper, turbulence control and drag reduction in a channel flow by using a spatially oscillating Lorentz force are investigated numerically via the pseudo-spectral method. The characteristics of controlled flow fields and vortex structures are described.
Governing Equations
2
1
Rec
p t
u
u u u f
(1)
0
u (2) Here, all variables are nondimensionalized with respect to the channel half width h and the center line velocity Uc. f is the Lorentz force per unit mass and given by
(0, 0, fz)
f (3) At the wall, the usual no-slip and no-penetration conditions are applied, and the periodic conditions are imposed for the homogeneous directions.
The numerical method adopted here to solve Eqs. (1) and (2) is based on standard Fourier–Chebyshev spectral method.At the wall, the usual no-slip and no-penetration conditions are applied, and the periodic conditionsare imposed for the homogeneous directions. The time advancement is carried out by using a semi-implicit back-differentiation formula method with third-order accuracy [8].
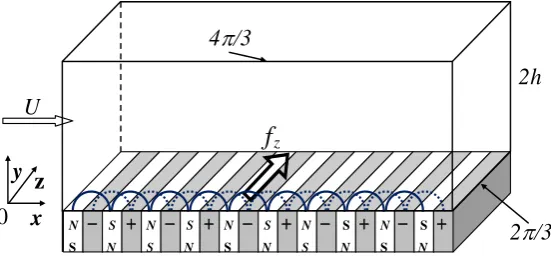
Figure 1 shows a schematic diagram of the computational domain,the computational domain size
is 4 / 3 2 2 / 3
(approximately 754 × 360 × 377 wall units) adopted in the streamwise,normal and spanwise directions, The bulk mean velocity averaged over the channel cross-section is fixed at Uc=2/3, and the corresponding bulk Reynolds number is Rec=3000 respectively. The grid
spacing is uniform in the homogeneous directions. More details are referred to the author’s previous work [9, 10].
N U
N N N N
S S S S S
S N S N S N S N S N
fz
+ - + - + - + - + -
x
z
y
0
2h
2/3
[image:2.595.160.436.374.504.2]4/3
Figure 1. Schematic diagram of electric/magnetic field distribution and computational domain.
The spanwise Lorentz force can be generated by EM actuators made of a series of long magnets and electrodes side by side in an interleaved way. The temporally oscillating Lorentz force and the spatially oscillating Lorentz force are obtained by alternating the polarity of the electrodes in time and altering the arrangement of the electrodes respectively, and approximately expressed individually as
( ) 2
e sin( )
y
z
x
x
f A
(4)
where kx, defined as kx Lx/x, is the streamwise wave number, Lx is the streamwise length of
the computational domain. A is the amplitude.
The spatially oscillating Lorentz force, fz , defined by Eq.(4), is independent of time. The
0
x
x/2 3x/2
fz
x
0 x/2 x 3x/2
0.4
y Shaded contours of induced
spanwise velocity Lorentz force distribution
(a)
[image:3.595.134.462.74.182.2](b) 0.2
Figure 2. Distributions of Lorentz force and induced spanwise velocity.
Results and Discussions
Vortex structures distribution in turbulent flow field are shown in Figure 3(a), the red vortex structure for the vorticity is positive, blue for negative vorticity vortex structure. In turbulent flow, the vortex structures are disordered. From the side of the X-Y, the uplift of the vortex structure is high, some even outside the y+=150. Vortex structures distribution in controlled flow field are shown in Figure 3(b), the red vortex structure for the vorticity is positive, the blue vortex structure for the vorticity is negative. The vortex structure of the flow field is regular distribution. From the side of X-Y, the uplift height of vortex structure is small, and almost all vortex structures are within y+=30.
z+
y+
x+
x+ y+ 10050
150
0 100200300 400
0
(a)
Turbulent flow field
Flow Flow
Z+
y+
x+
x+
y+ 100 50 150
0 100200300 400 0
Controlled flow field
[image:3.595.83.500.347.489.2](b)
Figure 3. Vortex structures distribution in turbulent and controlled flow field.
The mean streamwise velocity profiles are shown in Figure 4(a) in a log-law plot, where the blue solid line with circle represents the no-control and the red solid line with star represents the controlled flow. It is seen that the profiles of mean streamwise velocity when flow has reached a statistically periodic steady state, show a significant deviation from the regular law of the wall represented by a curve, which leads to the drag reduction.
The profiles of RMS velocity fluctuations are shown in Figure 4(b), where the solid line denotes streamwise velocity fluctuation, u'rms; the dashed line for v'rms and the dotted line for w'rms. A significant decrease in all three velocity components is observed, which implies that a Lorentz force to act upon the near-wall structures can profoundly reduce the kinetic energy of the turbulence.
Umean y+ No-control Controlled (a) y+ . .
'r m s
u -no control
r. m .s o f v el o ci ty p ro fi le s
0 20 40 60 0 0.1 0.15 0.2 0.25 80 . .
'r m s
v -no control
. .
'r m s
w -no control
. .
'r m s
u -control
. .
'r m s
v -control
. .
'r m s
w -control
(b)
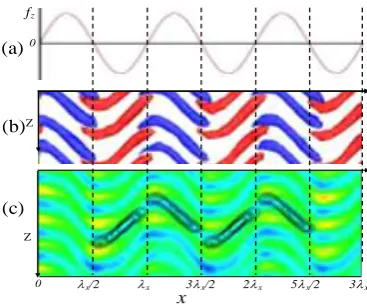
[image:3.595.100.498.641.771.2]This drag reduction is stained with periodical fluctuation, while the flow is finally maintained upon a statistically steady state via the oscillating Lorentz force. The drag reduction achieves maximum value when vortex shape is most similar each to each and all vortices are organized well. The typical controlled near-wall structures are shown in Figure 5, where (a) shows the distribution of fz on the wall in the x direction, (b) the distribution of streamwise vortex, where the red and blue areas represent, respectively, positive and negative values of vorticities. In Figure 5(c), the blue and green shading areas represent low-speed and high-speed streakes respectively, and solid contours represent the streamwise vortex.
As mentioned previously, the spanwise Lorentz forces leads to the inclination of the near-wall structures.The negative fz generates positive streamwise vortexes tilted to the negative spanwise
direction, while the positive fz generates negative vortexes tilted to the negative spanwise direction. Hence, it is clearly seen that the controlled boundary layer is dominated by stabilized, well-organized be found. The s quasi-streamwise vortices with similar shapes, whereas few of hairpins vortices can streamwise vortices with the same signs are arrayed, along the spanwise direction, to be a column, and the columns are arranged in an interleaved way with alternating sign. In addition, the positive vortices cross the low-speed streakes form its right-hand side when facing the downstream, whereas the negative one from its left-hand side. Each vortex has an averaged streamwise length of 0.5x, and the intervals of 0.5x and 0.3x in streamwise and spanwise
directions respectively, and overlays with the other with opposite sign at the shear layers located at / 2
x
or x ,etc.
x
0 x/2 x 3x/2 2x 5x/2 3x
fz
Z
0
Z (a)
(b)
[image:4.595.205.389.369.523.2](c)
Figure 5. Typical near-wall structures controlled by spatially oscillating Lorentz force.
The averaged streamwise vortex structures are shown in Figure 6, where (a) is top view and (b) side view. The dot represents the location of the vortex axis, defined as a line connecting local maxima of the imaginary part of complex eigenvalues of the velocity gradient tensor. The red and blue areas represent, respectively, positive and negative values of vorticities.To describe the orientation of vortices, inclination and tilting angles are introduced, defined by the angle between the x axis and the projection of the vortex axis on the x-y plane and the -z plane respectively. It is observed that the positive vortex is tilted upwards into the negative spanwise direction with the tilting angle 132.5°, while the negative vortex is tilted downwards with 2-32.5°. In addition the
vortex is lifted with the inclination angle 35.2°.
-z
x x
y
(a) Top view (b) Side view
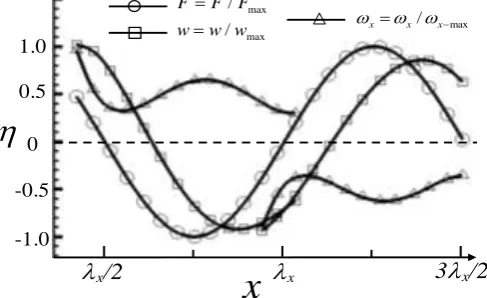
[image:4.595.132.464.677.768.2]The distributions of spanwise velocity and streamwise vorticity along the vortex axes projected on x-axis, in the induced flow field are shown in Figure 7 by the line with square and triangle respectively, where the line with circle denotes the distribution of Lorentz force on the wall. It is clear that the pattern of well-organized near-wall structures in controlled flow field is dominated mainly by the induced flow.
x
-1.0 -0.5 0 1.0
0.5
max
max / /
F F F
w w w
x
x/2 3x/2
max /
x x x
[image:5.595.175.419.143.292.2]
Figure 7. Distributions of spanwise velocity and streamwise vorticity along the vortex axes projected on x-axis, in the induced flow field.
Summary
The Lorentz force generated when an electrically conducting fluid flows through an electromagnetic field is capable to modifying the near-wall flow. Under the control of spatially oscillating force, no vortex structure can be found in the induced flow field, but the spanwise velocities induced distribute sinuously in the streamwise direction. The control mechanism can be viewed as modulation of the near-wall turbulence (intrinsic flow) by the induced flow created by imposing the force into a corresponding laminar flow. The turbulence can be suppressed effectively, then resulting in a considerable drag reduction, when these forces applied with the specific waveform parameters can induce the perfect waves (induced flow) in the Stokes layer. After modulation, the controlled flow field is dominated by stabilized, well-organized quasi-streamwise vortices, whereas few of hairpins vortices can be found. The vortices are inclined in the vertical plane and tilted in the horizontal plane, overlap with alternating sign in the streamwise direction as staggered arrays, meanwhile, the same-signed vortices are arrayed, along the spanwise direction as columns.
Acknowledgments
This work was supported by the National Natural Science Foundation of China (Grant No 11372356 and 11172140).
References
[1] Lee C, Kim J, Control of the viscous sublayer for drag reduction, Physics of Fluids. 7 (2002) 2523-2529.
[2] Kim J, Physics and control of wall turbulence for drag reduction, Philosophical Transactions of the Royal Society A: Mathematical, Physical and Engineering Sciences. 369 (2011) 1396-1411.
[3] Shen L, Zhang X, Yue K P, Triantafyllou M S, Turbulent flow over a flexible wall undergoing a streamwise traveling wave motion, Journal of Fluid Mechanics. 484 (2003) 197-221.
[4] Zhang H, Fan B C, Li H Z, Suppression of vortex-induced vibration of a circular cylinder by Lorentz force, Science China Physica, Mechanica and Astronomica. 54(2011) 2248-2259.
[6] Quadrio M, Ricco P, Viotti C, Streamwise-travelling waves of spanwise wall velocity for turbulent drag reduction, Journal of Fluid Mechanics. 627 (2009) 161-178.
[7] Huang L P, Choi K S, Fan B C, Chen Y H, Drag reduction in turbulent channel flow using bidirectional wavy Lorentz force, Science China Physica, Mechanica and Astronomica. 57 (2014) 2133-2140.
[8] Wu W T, Hong Y J, Fan B C, Vortex structures in turbulent channel flow modulated by spanwise Lorentz force with steady distributions, Acta Physica Sinica. 63 (2014) 054702.
[9] Wu W T, Hong Y J, Fan B C, Control mechanism of turbulent channel flow by spatially spanwise oscillating Lorentz force, Science China Physica, Mechanica and Astronomica. 45 (2015) 094702.