R E S E A R C H A R T I C L E
Open Access
Predictors of early post ischemic stroke apathy
and depression: a cross-sectional study
Song-ran Yang
1*†, Ping Hua
2†, Xin-yuan Shang
1, Rong Hu
1, Xiao-en Mo
1and Xiao-ping Pan
1Abstract
Background:Apathy and depression are important neuropsychiatric disorders that can occur after a stroke but the etiology and risk factors are not well understood. The purpose of this study was to identify risk factors for apathy and depression following a stroke.
Methods:Patients with an acute stroke who met the inclusion criteria were recruited from our hospital, and general information was recorded from patient charts. The Apathy Evaluation Scale, Clinician Version (AES-C) was used to evaluate these patients within 2 weeks after the stroke. The Montreal Cognitive Assessment (MoCA), mini-mental state examination (MMSE), Hamilton Depression Scale (HAMD), Mattis Dementia Rating Scale Initiation/Perseveration subset (MDRS I/P), Frontal Assessment Battery (FAB) and Stroop Color-Word Association Test were employed to evaluate emotion, cognitive function and executive function. The patients were divided into two groups: the apathy group and the non-apathy group. We also divided the patients into two groups based on whether or not they had post-stroke depression. The clinical characteristics and scores on the MoCA, MMSE, HAMD and MDRS I/P were compared between the apathy and non-apathy groups as well as between patients with and without depression. Logistic regression analysis was performed to identify risk factors for apathy and depression following a stroke.
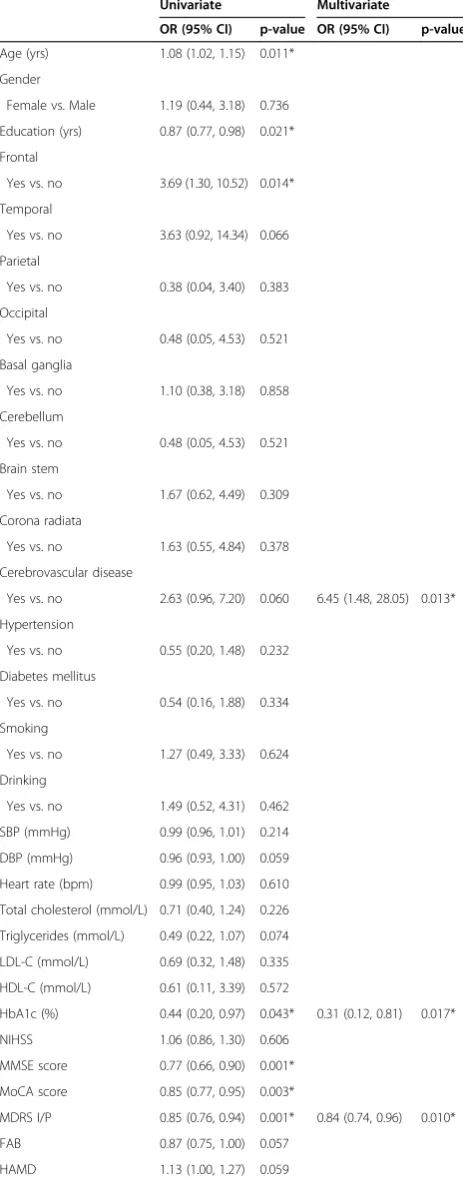
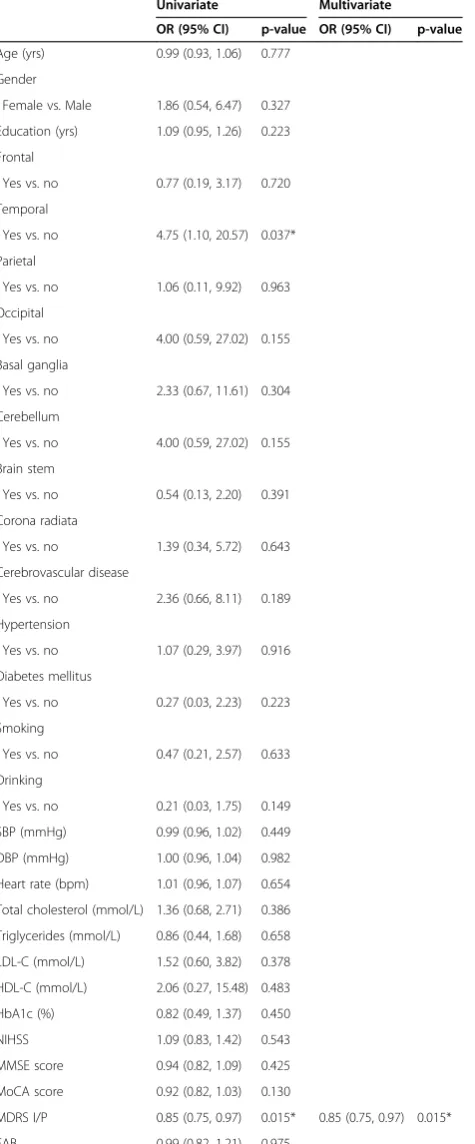
Results:A total of 75 patients with acute stroke were recruited. Of these, 25 (33.3%) developed apathy and 12 (16%) developed depression. Multivariate logistic regression analysis indicated that a history of cerebrovascular disease (OR: 6.45, 95% CI: 1.48-28.05, P = 0.013), low HbA1c (OR: 0.31, 95% CI: 0.12-0.81, P = 0.017) and a low MDRS I/P score (OR: 0.84, 95% CI: 0.74, 0.96, P = 0.010) were risk factors for post-stroke apathy. Additionally, multivariate logistic regression indicated that a low MDRS I/P (OR: 0.85, 95% CI: 0.75, 0.97, P = 0.015) was associated with post-stroke depression. Conclusions:Three risk factors for post-stroke apathy were identified as a history of cerebrovascular disease, low HbA1c and lower MDRS I/P scores. A low MDRS I/P score was also identified as a risk factor for post-stroke depression. These results may be useful to clinicians in recognizing and treating apathy and depression in patients after a stroke.
Keywords:Stroke, Apathy, Depression, Executive dysfunction
Background
Apathy and depression are important neuropsychiatric symptoms that can occur after a stroke and may be the core symptoms in some stroke patients [1,2]. It has been reported that in the acute phase of a stroke, 15.2-71% of patients demonstrate apathy [3]. Three to six months after a stroke the incidence of apathy has been reported to be 26.7% versus 5.4% in controls [4].
Cognitive dysfunction has been found to be related to apathy [5,6]; however, some patients with moderate to
severe dementia do not show apathy so cognitive dys-function per se does not produce apathy [7]. Some pa-tients with post-stroke depression develop apathy [5]; however, apathy should probably be regarded as different from depression and it requires distinct prognostic and therapeutic strategies. For example, it has been found that in patients with a stroke, crying and sadness were associated with a subjective feeling of depression whereas apathy was not [8]. The situation may be more complex, however, as a relationship between depression and apathy could develop over time. A recent study found that 3 months after a stroke there was no signifi-cant overlap between apathy and depression, but one year later there was a significant overlap [9]. One group * Correspondence:[email protected]
†Equal contributors 1
Department of Neurology, Guangzhou First People’s Hospital, Guangzhou Medical University, No. 1 Panfu Road, Guangzhou 510180, China Full list of author information is available at the end of the article
of authors who reviewed the literature on post-stroke
depression and apathy proposed that “post-stroke
de-pression”is really comprised of two syndromes, affective or depressive stroke depression and apathetic post-stroke depression, and that they have different neuroana-tomical mechanisms [10].
It is important to identify stroke patients who are apathetic and to make the distinction between apathy and depression for several reasons: apathy increases the burden on caregivers, apathetic patients have been found to require longer hospitalizations and patients with ap-athy tend to participate less in rehabilitation [4]. Apap-athy and depression are also treated differently.
Knowledge about the risk factors for post-stroke ap-athy and depression would make it less likely that a clin-ician would fail to recognize and treat them. The aim of this study was to explore the risk factors for post-stroke apathy and depression in the subacute stage of a stroke.
Methods
This study was approved by the Institutional Review Board of Guangzhou First Municipal People’s Hospital (No. 024, 2010). Informed consent was obtained from all patients before the study. The scale assessments were done by a qualified psychiatric specialist and the testing was confirmed by a psychiatrist and a neurologist.
Patients
We reviewed the charts of 270 patients hospitalized for an acute stroke between December 2010 and December 2011. After detail evaluation with inclusion and exclu-sion criteria, 75 patients were used for this study. Inclu-sion criteria were: patients with a diagnosis of ischemic stroke (IS) according to valid ICD-10 codes [11], the stroke had occurred within the previous 7 days, comput-erized tomography (CT) was performed to exclude cere-bral hemorrhage, patients were conscious and their Glasgow Coma Scale (GCS) scores were 15, patients were able to cooperate with the testing, and their
admis-sion NIH Stroke Scale (NIHSS) score was ≤8. All
pa-tients had acute lacunar infarctions.
Exclusion criteria were: patients with a diagnosis or history of atrial fibrillation, those with a history of schizophrenia, depression, anxiety or other mental ill-ness, including dementia, Parkinson’s disease and other neurodegenerative diseases, the development of symp-toms of severe aphasia so that patients were unable to complete the evaluation, severe heart, liver or kidney dysfunction, malignancies or thyroid diseases, contrain-dications to magnetic resonance imaging (MRI) such as pacemaker implantation and claustrophobia, drug abuse or drug dependence, and refusal to participate in the study. Smoking was defined as: Non-smoker, Ex-smoker who used to smoke but had quit, Current smoker was
defined as those who continued to smoke 1–19
ciga-rettes per day during the study period [12]. Drinking was defined as: (1) Non-drinker who did not have a his-tory of drinking in the past or was an occasional drinker (< 1 drink, where 1 unit equals to 8 gram of alcohol per week), (2) Light drinker of 1–15 units per week, (3)
Moderate drinker of 16–42 units per week, (4) Heavy
drinker of > 42 units per week, (5) Ex-drinker who used to drink but had quit [13].
Collection of general information and grouping
Patients who met the inclusion criteria were recruited and their clinical information was recorded in detail. Data were recorded on hypertension, diabetes, a history of cerebral vascular disease and other chronic diseases. The NIHSS score had been recorded on admission. The evaluation of apathy was carried out using the Apathy Evaluation Scale, clinician version (AES-C) within 2 weeks after onset of the stroke. The AES was devel-oped by Marin et al. and its reliability has been shown to be satisfactory [14]. The diagnostic criteria for apathy in this study were based on the Marin scale [14] and Robert et al. [15]. These criteria were (1) a lack of motiv-ation relative to the patient’s previous level of function-ing or the standards of his/her age and culture, (2) the presence of at least one symptom from the following three domains: (i) diminished goal-directed behavior (lack of effort, dependency on others to structure activ-ity); (ii) diminished goal-directed cognition (lack of interest or concern about one’s personal problems), or (iii) diminished concomitant to goal-directed behavior (unchanging affect, lack of emotional responsiveness), (3) the symptoms cause clinically significant distress or impairment in social and occupational functioning, and (4) the absence of a diminished level of consciousness or administration of substances such as narcotics or medi-cations [15].
Detection of emotion, cognitive function and executive function
executive function of the frontal lobe. In the Stroop Color Word Test, two cards were used for testing. Card A was the Stroop color card and Card B the color word card. The time to complete the evaluation with each card was recorded and the difference between them was calculated (B-Atime). The number of correct answers was recorded
for each card and the difference was calculated
(B-Anumber). On the HAMD, >35 points was considered to
be an indication of serious depression and >20 points as mild or moderate depression. A MoCA score of <25 but≥14 was defined as mild cognitive impairment (MCI). The scale assessments for the FAB were performed by a qualified psychiatric specialist and the testing was con-firmed by a psychologist and a neurologist.
According to the Diagnostic and Statistical Manual of Mental Disorders (DSM IV), the criteria for major depres-sion area depressed state of mind for most of the day, and at least four of the following: (1) loss of interest in or no pleasant feelings about activities, (2) the loss of energy or fatigue, (3) psychomotor retardation or agitation, (4) feel-ings of worthlessness, (5) diminished ability to think or concentrate, (6) recurrent thoughts of death, (7) sleep dis-orders such as insomnia or sleeping too much, and (8) sig-nificant weight loss or weight gain. The criteria for severity include impaired social functioning and pain or adverse consequences for the depressed individual. The symptom criteria and the severity criteria must have lasted for at least 2 weeks. The symptoms cannot be due to sub-stances or a general medical condition.
According to the findings on T2-weighted images, the infarct lesions were located in the bilateral frontal lobes, temporal lobes, parietal lobe, occipital lobe, basal gan-glia, corona radiata or brain stem.
The AES-C consists of 18 items which provide an index of overt goal-directed behavior, goal-related cognitions, and goal-related emotional responses. Factor analysis using principal component analysis was performed. The Kaiser-Meyer-Olkin (KMO) score for the AES-C was 0.84, indicating sampling adequacy (≥.50). Bartlett’s test of
sphericity was statistically significant. The overall
Cronbach’s alpha for internal consistency of the 18-item instrument was 0.87. HbA1c shows the average level of blood glucose over the previous three months and < 5.6% is considered normal.
Statistical analysis
Comparison between the patients with and without post-stroke apathy and between those with and without post-stroke depression was conducted using the inde-pendent two-samplettest for continuous variables. The chi-square/Fisher’s exact test was used for categorical variables; the data are presented as numbers (percent-ages). Because multiple measurements were employed to evaluate emotion, cognitive function and executive
function, Bonferroni corrections were used to reduce the chance of obtaining false-positive results. Univariate lo-gistic regression analysis was performed to analyze the odds ratios of significant factors associated with patients with post-stroke apathy and post-stroke depression. Var-iables having a p value <0.2 in the univariate analysis were selected and evaluated by multivariate logistic re-gression models with the conditional forward selection method. All statistical assessments were two-tailed and p < 0.05 was considered statistically significant. Statistical analyses were performed using SPSS 15.0 statistical soft-ware (SPSS Inc, Chicago, IL).
Results
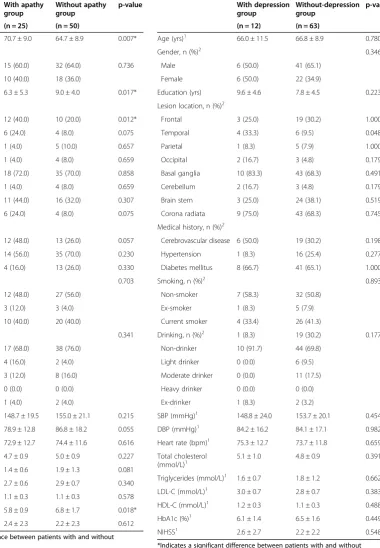
Twenty-five (33.3%) of the 75 enrolled patients (28 women and 47 men) were diagnosed as having post-stroke apathy. The mean age of these patients was 66.7 ± 9.3 years (range, 48 to 84 years). Table 1 summarizes the demographic and clinical characteristics of the 25 patients with post-stroke apathy and the 50 patients without post-stroke apathy. There were significant differences between the two groups in age, education, frontal lesion location and HbA1c levels (p < 0.05). Twelve of the 75 patients (16%) had post-stroke depression. Table 2 summarizes the demographic and clin-ical characteristics of the patients with and without post-stroke depression. There was a significant difference be-tween the two groups if the lesion was located in the tem-poral lobe (p = 0.048).
Table 3 shows the assessments of cognition and depres-sion for the patients with and without post-stroke apathy. There were significant differences in MMSE, MoCA, and MDRS I/P scores between the two groups (p < 0.01). Pa-tients without post-stroke apathy had significantly higher scores on the MMSE, MoCA, and MDRS I/P than did pa-tients with post-stroke apathy. Assessments of cognition for patients with and without post-stroke depression are shown in Table 4. There was a significant difference in MDRS I/P scores between the two groups (p = 0.009). Patients without post-stroke depression had a signifi-cantly higher score on the MDRS I/P than did patients with post-stroke depression.
Table 1 Comparison of demographics, anthropometric characteristics, and hormonal and metabolic features between patients with and without post-stroke apathy
With apathy group
Without apathy group
p-value
(n = 25) (n = 50)
Age (yrs)1 70.7 ± 9.0 64.7 ± 8.9 0.007*
Gender, n (%)2
Male 15 (60.0) 32 (64.0) 0.736
Female 10 (40.0) 18 (36.0)
Education (yrs) 6.3 ± 5.3 9.0 ± 4.0 0.017* Lesion location, n (%)2
Frontal 12 (40.0) 10 (20.0) 0.012*
Temporal 6 (24.0) 4 (8.0) 0.075
Parietal 1 (4.0) 5 (10.0) 0.657
Occipital 1 (4.0) 4 (8.0) 0.659
Basal ganglia 18 (72.0) 35 (70.0) 0.858
Cerebellum 1 (4.0) 4 (8.0) 0.659
Brain stem 11 (44.0) 16 (32.0) 0.307
Corona radiata 6 (24.0) 4 (8.0) 0.075
Medical history, n (%)2
Cerebrovascular disease 12 (48.0) 13 (26.0) 0.057
Hypertension 14 (56.0) 35 (70.0) 0.230
Diabetes mellitus 4 (16.0) 13 (26.0) 0.330
Smoking, n (%)2 0.703
Non-smoker 12 (48.0) 27 (56.0)
Ex-smoker 3 (12.0) 3 (4.0)
Current smoker 10 (40.0) 20 (40.0)
Drinking, n (%)2 0.341
Non-drinker 17 (68.0) 38 (76.0) Light drinker 4 (16.0) 2 (4.0) Moderate drinker 3 (12.0) 8 (16.0)
Heavy drinker 0 (0.0) 0 (0.0)
Ex-drinker 1 (4.0) 2 (4.0)
SBP (mmHg)1 148.7 ± 19.5 155.0 ± 21.1 0.215 DBP (mmHg)1 78.9 ± 12.8 86.8 ± 18.2 0.055 Heart rate (bpm)1 72.9 ± 12.7 74.4 ± 11.6 0.616 Total cholesterol (mmol/L)1 4.7 ± 0.9 5.0 ± 0.9 0.227 Triglycerides (mmol/L)1 1.4 ± 0.6 1.9 ± 1.3 0.081 LDL-C (mmol/L)1 2.7 ± 0.6 2.9 ± 0.7 0.340 HDL-C (mmol/L)1 1.1 ± 0.3 1.1 ± 0.3 0.578
HbA1c (%)1 5.8 ± 0.9 6.8 ± 1.7 0.018*
NIHSS1 2.4 ± 2.3 2.2 ± 2.3 0.612
*Indicates a significant difference between patients with and without post-stroke apathy, p < 0.05.
p values are from1
independent two sample tests and2
chi-square/Fisher’s exact tests.
Data are displayed as mean ± standard deviation and number (percentage). Abbreviations:SBPSystolic blood pressure,DBPDiastolic blood pressure,LDL-C
Low-density lipoprotein cholesterol,HDL-CHigh-density lipoprotein cholesterol,HbA1cHemoglobin A1c,NIHSSNational institutes of health stroke scale.
Table 2 Comparison of demographics, anthropometric characteristics, and hormonal and metabolic features between patients with and without post-stroke depression
With depression group
Without-depression group
p-value
(n = 12) (n = 63)
Age (yrs)1 66.0 ± 11.5 66.8 ± 8.9 0.780
Gender, n (%)2 0.346
Male 6 (50.0) 41 (65.1)
Female 6 (50.0) 22 (34.9)
Education (yrs) 9.6 ± 4.6 7.8 ± 4.5 0.223 Lesion location, n (%)2
Frontal 3 (25.0) 19 (30.2) 1.000
Temporal 4 (33.3) 6 (9.5) 0.048*
Parietal 1 (8.3) 5 (7.9) 1.000
Occipital 2 (16.7) 3 (4.8) 0.179
Basal ganglia 10 (83.3) 43 (68.3) 0.491
Cerebellum 2 (16.7) 3 (4.8) 0.179
Brain stem 3 (25.0) 24 (38.1) 0.519
Corona radiata 9 (75.0) 43 (68.3) 0.745
Medical history, n (%)2
Cerebrovascular disease 6 (50.0) 19 (30.2) 0.198
Hypertension 1 (8.3) 16 (25.4) 0.277
Diabetes mellitus 8 (66.7) 41 (65.1) 1.000
Smoking, n (%)2 0.893
Non-smoker 7 (58.3) 32 (50.8)
Ex-smoker 1 (8.3) 5 (7.9)
Current smoker 4 (33.4) 26 (41.3)
Drinking, n (%)2 1 (8.3) 19 (30.2) 0.177 Non-drinker 10 (91.7) 44 (69.8)
Light drinker 0 (0.0) 6 (9.5) Moderate drinker 0 (0.0) 11 (17.5) Heavy drinker 0 (0.0) 0 (0.0)
Ex-drinker 1 (8.3) 2 (3.2)
SBP (mmHg)1 148.8 ± 24.0 153.7 ± 20.1 0.454 DBP (mmHg)1 84.2 ± 16.2 84.1 ± 17.1 0.982 Heart rate (bpm)1 75.3 ± 12.7 73.7 ± 11.8 0.659 Total cholesterol
(mmol/L)1
5.1 ± 1.0 4.8 ± 0.9 0.391
Triglycerides (mmol/L)1 1.6 ± 0.7 1.8 ± 1.2 0.662 LDL-C (mmol/L)1 3.0 ± 0.7 2.8 ± 0.7 0.383 HDL-C (mmol/L)1 1.2 ± 0.3 1.1 ± 0.3 0.488
HbA1c (%)1 6.1 ± 1.4 6.5 ± 1.6 0.449
NIHSS1 2.6 ± 2.7 2.2 ± 2.2 0.548
*Indicates a significant difference between patients with and without post-stroke depression, p < 0.05.
p values are from1
independent two sample tests and2
chi-square/Fisher’s exact tests.
Data are displayed as mean ± standard deviation and number (percentage). Abbreviations:SBPSystolic blood pressure,DBPDiastolic blood pressure,LDL-C
Low-density lipoprotein cholesterol,HDL-CHigh-density lipoprotein cholesterol,
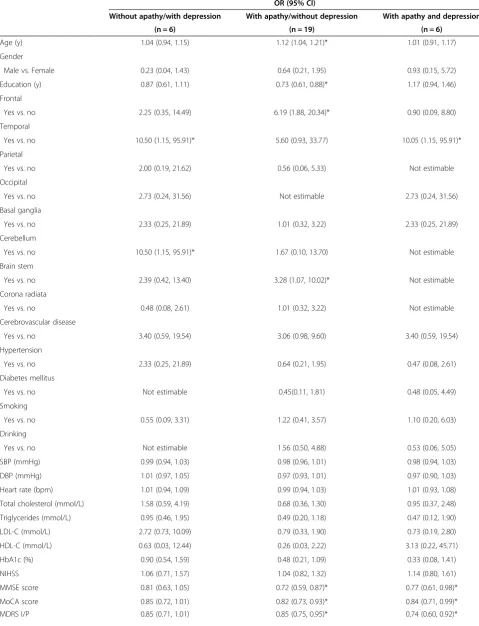
[image:4.595.147.528.124.673.2]95% CI: 0.75, 0.97, P = 0.015) was also associated with post-stroke depression (Table 6). Table 7 presents the re-sult of univariate multinomial logistic regression using pa-tients without apathy and depression (n = 44) as the reference category. Table 7 had shown an increased risk of patients without apathy and with depression for temporal (OR = 10.50, 95% CI: 1.15–95.91), cerebellum (OR = 10.50,
95% CI: 1.15–95.91) and higher HAMD (OR = 8.01, 95%
[image:5.595.305.537.115.712.2]CI: 1.27–50.73). Risk of patients with apathy and without
Table 3 Comparison of assessments of cognition and depression between patients with and without post-stroke apathy
With apathy group
Without apathy group
p-value
(n = 25) (n = 50)
MMSE score 23.0 ± 4.9 26.7 ± 2.8 <0.001*
MoCA score 17.3 ± 5.4 21.6 ± 4.9 0.001*
MDRS I/P 27.2 ± 5.1 31.7 ± 5.0 0.001*
FAB 12.3 ± 3.8 13.9 ± 2.9 0.050
HAMD 6.2 ± 5.3 4.2 ± 3.2 0.046*
Stroop color-naming
B-Atime 73.3 ± 47.9 59.3 ± 43.3 0.208
B-Anumber −6.6 ± 8.2 −3.3 ± 6.9 0.070 * Indicates a significant difference between patients with and without post-stroke apathy, p < 0.01.
p values are from independent two sample tests and data are displayed as mean ± standard deviation.
Bonferroni corrections were used to reduce the chance of obtaining false-positive results.
[image:5.595.57.291.123.265.2]Abbreviations:MMSEMini-mental state examination,MoCAMontreal cognitive assessment,MDRS I/PMattis dementia rating scale initiation/preservation subset,FABFrontal assessment battery,HAMDHamilton depression scale.
Table 4 Comparison of assessments of cognition between patients with and without post-stroke depression
With depression group
Without-depression group
p-value
(n = 12) (n = 63)
MMSE score 24.6 ± 4.3 25.6 ± 4.0 0.426
MoCA score 18.0 ± 5.2 20.6 ± 5.4 0.125
MDRS I/P 26.5 ± 5.7 30.9 ± 5.1 0.009*
FAB 13.3 ± 3.3 13.4 ± 3.3 0.976
Stroop color-naming
B-Atime 73.8 ± 59.6 62.1 ± 42.0 0.412
B-Anumber −5.8 ± 9.9 −4.1 ± 6.9 0.458 * Indicates a significant difference between patients with and without post-stroke apathy, p < 0.01.
p values are from independent two sample tests and data are displayed as mean ± standard deviation.
Bonferroni corrections were used to reduce the chance of obtaining false-positive results.
Abbreviations:MMSEMini-mental state examination,MoCAMontreal cognitive assessment,MDRS I/PMattis dementia rating scale initiation/preservation subset,FABFrontal assessment battery.
Table 5 Determinants of significant risk factors associated with post-stroke apathy (n = 75)
Univariate Multivariate
OR (95% CI) p-value OR (95% CI) p-value
Age (yrs) 1.08 (1.02, 1.15) 0.011*
Gender
Female vs. Male 1.19 (0.44, 3.18) 0.736
Education (yrs) 0.87 (0.77, 0.98) 0.021*
Frontal
Yes vs. no 3.69 (1.30, 10.52) 0.014*
Temporal
Yes vs. no 3.63 (0.92, 14.34) 0.066
Parietal
Yes vs. no 0.38 (0.04, 3.40) 0.383
Occipital
Yes vs. no 0.48 (0.05, 4.53) 0.521
Basal ganglia
Yes vs. no 1.10 (0.38, 3.18) 0.858
Cerebellum
Yes vs. no 0.48 (0.05, 4.53) 0.521
Brain stem
Yes vs. no 1.67 (0.62, 4.49) 0.309
Corona radiata
Yes vs. no 1.63 (0.55, 4.84) 0.378
Cerebrovascular disease
Yes vs. no 2.63 (0.96, 7.20) 0.060 6.45 (1.48, 28.05) 0.013*
Hypertension
Yes vs. no 0.55 (0.20, 1.48) 0.232
Diabetes mellitus
Yes vs. no 0.54 (0.16, 1.88) 0.334
Smoking
Yes vs. no 1.27 (0.49, 3.33) 0.624
Drinking
Yes vs. no 1.49 (0.52, 4.31) 0.462
SBP (mmHg) 0.99 (0.96, 1.01) 0.214
DBP (mmHg) 0.96 (0.93, 1.00) 0.059
Heart rate (bpm) 0.99 (0.95, 1.03) 0.610
Total cholesterol (mmol/L) 0.71 (0.40, 1.24) 0.226
Triglycerides (mmol/L) 0.49 (0.22, 1.07) 0.074
LDL-C (mmol/L) 0.69 (0.32, 1.48) 0.335
HDL-C (mmol/L) 0.61 (0.11, 3.39) 0.572
HbA1c (%) 0.44 (0.20, 0.97) 0.043* 0.31 (0.12, 0.81) 0.017*
NIHSS 1.06 (0.86, 1.30) 0.606
MMSE score 0.77 (0.66, 0.90) 0.001*
MoCA score 0.85 (0.77, 0.95) 0.003*
MDRS I/P 0.85 (0.76, 0.94) 0.001* 0.84 (0.74, 0.96) 0.010*
FAB 0.87 (0.75, 1.00) 0.057
[image:5.595.56.291.519.646.2]depression was also higher for older (OR = 1.12, 95% CI: 1.04–121), less education (OR = 0.73, 95% CI: 0.61–0.88), frontal (OR = 6.19, 95%CI: 1.88–20.34), brain stem (OR = 3.28, 95% CI: 1.07–10.02), lower MMSE score (OR = 0.72, 95%CI: 0.59–0.87), lower MoCA score (OR = 0.82, 95%CI: 0.73–0.0.93), lower MDRS I/P (OR = 0.85, 95%CI: 0.75– 0.95), lower MDRS I/P (OR = 0.85, 95%CI: 0.75–0.95), and lower FAB (OR = 0.81, 95%CI: 0.69–0.96). The results of multivariate multinomial logistic regression were not es-timable because of small sample size.
Discussion
Risk factors for post-stroke apathy and depression
In this study, we compared 25 stroke patients who had apathy with 50 stroke patients who did not. The two groups were similar except that the apathy group was significantly older, had significantly fewer years of educa-tion, had a significantly higher proportion of frontal lobe lesions, and had a significantly lower level of HbA1c. The patients were assessed within 2 weeks of their stroke. Multivariate logistic regression analysis revealed three risk factors for apathy: a history of cerebrovascular disease, a low HbA1c level and a low MDRS I/P score. We also compared 12 patients who had post-stroke de-pression with 63 who did not. The groups were similar except that a significantly higher proportion of patients with depression had temporal lobe lesions.
Our results differed from those of previous studies that had attempted to identify risk factors for post-stroke apathy. Sagen et al. [17] assessed patients within the first 2 weeks and at 4 months after the stroke, and, using multivariate logistic regression analysis, found that at 4 months after the stroke, somatic comorbidity was significantly associated with apathy and there was a
bor-derline association with an HADS-D score ≥8 at
[image:6.595.57.291.114.153.2]admis-sion. Caeiro et al. [3] assessed patients during the acute phase of a stroke (≤4 days) and stepwise regression ana-lysis showed that cerebral hemorrhage, a low level of education and a right hemispheric lesion were predic-tors. Brodaty et al. [4] assessed patients at 3–6 months after a stroke and performed univariate analysis which showed that older age, more functional dependency and Table 5 Determinants of significant risk factors
associated with post-stroke apathy (n = 75)(Continued)
Stroop color-naming
B-Atime 1.01 (1.00, 1.02) 0.211
B-Anumber 0.94 (0.88, 1.01) 0.087
*Significance factor, p < 0.05.
Abbreviations:SBPSystolic blood pressure,DBPDiastolic blood pressure,LDL-C
[image:6.595.307.545.115.688.2]Low-density lipoprotein cholesterol,HDL-CHigh-density lipoprotein cholesterol,HbA1cHemoglobin A1c,NIHSSNational Institutes of health stroke scale,MMSEMini-mental state examination,MoCAMontreal cognitive assessment,MDRS I/PMattis dementia rating scale initiation/preservation subset,FABFrontal assessment battery,HAMDHamilton depression scale.
Table 6 Determinants of significant risk factors associated with post-stroke depression (n = 75)
Univariate Multivariate
OR (95% CI) p-value OR (95% CI) p-value
Age (yrs) 0.99 (0.93, 1.06) 0.777
Gender
Female vs. Male 1.86 (0.54, 6.47) 0.327
Education (yrs) 1.09 (0.95, 1.26) 0.223
Frontal
Yes vs. no 0.77 (0.19, 3.17) 0.720
Temporal
Yes vs. no 4.75 (1.10, 20.57) 0.037*
Parietal
Yes vs. no 1.06 (0.11, 9.92) 0.963
Occipital
Yes vs. no 4.00 (0.59, 27.02) 0.155
Basal ganglia
Yes vs. no 2.33 (0.67, 11.61) 0.304
Cerebellum
Yes vs. no 4.00 (0.59, 27.02) 0.155
Brain stem
Yes vs. no 0.54 (0.13, 2.20) 0.391
Corona radiata
Yes vs. no 1.39 (0.34, 5.72) 0.643
Cerebrovascular disease
Yes vs. no 2.36 (0.66, 8.11) 0.189
Hypertension
Yes vs. no 1.07 (0.29, 3.97) 0.916
Diabetes mellitus
Yes vs. no 0.27 (0.03, 2.23) 0.223
Smoking
Yes vs. no 0.47 (0.21, 2.57) 0.633
Drinking
Yes vs. no 0.21 (0.03, 1.75) 0.149
SBP (mmHg) 0.99 (0.96, 1.02) 0.449
DBP (mmHg) 1.00 (0.96, 1.04) 0.982
Heart rate (bpm) 1.01 (0.96, 1.07) 0.654
Total cholesterol (mmol/L) 1.36 (0.68, 2.71) 0.386
Triglycerides (mmol/L) 0.86 (0.44, 1.68) 0.658
LDL-C (mmol/L) 1.52 (0.60, 3.82) 0.378
HDL-C (mmol/L) 2.06 (0.27, 15.48) 0.483
HbA1c (%) 0.82 (0.49, 1.37) 0.450
NIHSS 1.09 (0.83, 1.42) 0.543
MMSE score 0.94 (0.82, 1.09) 0.425
MoCA score 0.92 (0.82, 1.03) 0.130
MDRS I/P 0.85 (0.75, 0.97) 0.015* 0.85 (0.75, 0.97) 0.015*
a lower score on the MMSE were associated with apathy. Mayo et al. [18] assessed apathy in 408 stroke patients by telephone interviews with caregivers at 1, 3, 6 and 12 months after the stroke and analyzed the data using the group-based trajectory method; they found that greater apathy was predicted by older age, poor cognitive status and low functional status. One possible reason for the conflicting findings is that assessments were carried out at different periods after the stroke. In our study, pa-tients were assessed within 2 weeks of the stroke during the subacute phase. Different variables were assessed and different assessment instruments were used.
MDRS I/P
We found that a decrease in the MDRS I/P score was a risk factor for both post-stroke apathy and post-stroke depression. Patients with one or both of these scoured lower than did the control group. Patients with post-stroke apathy without depression also had lower scores on the MMSE and the MoCA than did controls; how-ever, they had lower HAMD scores than those without apathy but with depression, suggesting that these groups are really different.
In our study, abnormalities were not found in B-Atime
and B-Anumber. The Stroop Color Word Test can be
used to evaluate the degree of impairment of the lateral and inner-upper frontal lobe [19], but fails to specifically assess the impairment of the whole frontal lobe.
The frontal-subcortical circuit has been found to con-nect the frontal cortex and the striatum, globus pallidus, substantia nigra and thalamus, and functions as an im-portant effector mechanism and interacts adaptively [20,21]. Dysfunction of the frontal-subcortical circuit is characterized by a reduction in executive function, ap-athy and impulsive behavior. Studies have revealed that most stroke patients with depression and executive dys-function had infarct lesions in the frontal lobe [22,23]. A study of participants in the Age Gene/Environment Susceptibility-Reykjavik Study found that infarct lesions involving both cortex and subcortex were related to compromised processing and executive function
[24]. Another study found that among patients with frontotemporal dementia, the severity of apathy was as-sociated with atrophy in the right dorsolateral prefrontal cortex [25]. Brodaty et al. found that among stroke pa-tients who underwent MRI there was a trend for apathy to be associated with the extent of MR signal abnor-malities (hypertintensities) in the deep white matter and in the right hemisphere and right frontal-subcortical circuit [4].
History of cerebrovascular disease
We also found that a history of cerebrovascular disease was a risk factor for post-stroke apathy. Angelelli et al. found that apathy was more frequently found at 6 months after a stroke than during the subacute phase [26]. Following cerebral infarction, the nerve fibers dis-tant from the lesion may experience secondary damage. Animal studies have shown that connectivity remodeling was present in the cortex, hypothalamus, striatum, hippocampus and tissues surrounding the lesions follow-ing a stroke [27-30]. We therefore speculate that one possible explanation for a history of cerebrovascular dis-ease as a risk factor for post-stroke apathy is that infarcts and secondary damage to nerve fibers following a stroke may impair the frontal-subcortical circuit and connectiv-ity remodeling. Alexopoulos et al. [31] postulated two broad hypotheses for the mechanism of vascular depres-sion. The first hypothesis was that small lesions disrupting critical neural pathways might precipitate vas-cular depression. The second was that an accumulation of lesions exceeding a threshold predisposes to depres-sion. The second hypothesis, which is a “threshold
hy-pothesis,” is most applicable to patients who have
[image:7.595.57.289.124.164.2]neurologically silent lesions or an old stroke. Hama et al. [32] investigated the correlation between damage to the basal ganglia or frontal lobe and depression (both affective and apathetic dimensions) in a study of 243 stroke patients examined with CT, and suggested that affective depression was associated with left frontal lobe damage whereas apathetic depression was associated with damage to the basal ganglia in both hemispheres. Our finding that there was a tendency for a larger pro-portion of patients in the apathy group to have a history of cerebrovascular disease compared with the non-apathy group suggests that there was a larger proportion of recurrent stroke cases in the apathy group compared with the non-apathy group, and that our finding sup-ports the threshold hypothesis. Cognitive function was lower in the apathy group compared with the non-apathy group. These findings related to a history of cerebrovascular disease and cognitive function suggest that repeated ischemic strokes damage brain function bit by bit, leading to both apathy and cognitive dysfunction.
Table 6 Determinants of significant risk factors associated with post-stroke depression (n = 75) (Continued)
Stroop color-naming
B-Atime 1.01 (0.99, 1.02) 0.409
B-Anumber 0.97 (0.90, 1.05) 0.457
*Significant factor, P < 0.05.
Abbreviations:SBPSystolic blood pressure,DBPDiastolic blood pressure,LDL-C
Table 7 The results of univariate multinomial logistic regression for determining the risk factors of post-stroke apathy or depression alone
OR (95% CI)
Without apathy/with depression With apathy/without depression With apathy and depression
(n = 6) (n = 19) (n = 6)
Age (y) 1.04 (0.94, 1.15) 1.12 (1.04, 1.21)* 1.01 (0.91, 1.17)
Gender
Male vs. Female 0.23 (0.04, 1.43) 0.64 (0.21, 1.95) 0.93 (0.15, 5.72)
Education (y) 0.87 (0.61, 1.11) 0.73 (0.61, 0.88)* 1.17 (0.94, 1.46)
Frontal
Yes vs. no 2.25 (0.35, 14.49) 6.19 (1.88, 20.34)* 0.90 (0.09, 8.80)
Temporal
Yes vs. no 10.50 (1.15, 95.91)* 5.60 (0.93, 33.77) 10.05 (1.15, 95.91)*
Parietal
Yes vs. no 2.00 (0.19, 21.62) 0.56 (0.06, 5.33) Not estimable
Occipital
Yes vs. no 2.73 (0.24, 31.56) Not estimable 2.73 (0.24, 31.56)
Basal ganglia
Yes vs. no 2.33 (0.25, 21.89) 1.01 (0.32, 3.22) 2.33 (0.25, 21.89)
Cerebellum
Yes vs. no 10.50 (1.15, 95.91)* 1.67 (0.10, 13.70) Not estimable
Brain stem
Yes vs. no 2.39 (0.42, 13.40) 3.28 (1.07, 10.02)* Not estimable
Corona radiata
Yes vs. no 0.48 (0.08, 2.61) 1.01 (0.32, 3.22) Not estimable
Cerebrovascular disease
Yes vs. no 3.40 (0.59, 19.54) 3.06 (0.98, 9.60) 3.40 (0.59, 19.54)
Hypertension
Yes vs. no 2.33 (0.25, 21.89) 0.64 (0.21, 1.95) 0.47 (0.08, 2.61)
Diabetes mellitus
Yes vs. no Not estimable 0.45(0.11, 1.81) 0.48 (0.05, 4.49)
Smoking
Yes vs. no 0.55 (0.09, 3.31) 1.22 (0.41, 3.57) 1.10 (0.20, 6.03)
Drinking
Yes vs. no Not estimable 1.56 (0.50, 4.88) 0.53 (0.06, 5.05)
SBP (mmHg) 0.99 (0.94, 1.03) 0.98 (0.96, 1.01) 0.98 (0.94, 1.03)
DBP (mmHg) 1.01 (0.97, 1.05) 0.97 (0.93, 1.01) 0.97 (0.90, 1.03)
Heart rate (bpm) 1.01 (0.94, 1.09) 0.99 (0.94, 1.03) 1.01 (0.93, 1.08)
Total cholesterol (mmol/L) 1.58 (0.59, 4.19) 0.68 (0.36, 1.30) 0.95 (0.37, 2.48)
Triglycerides (mmol/L) 0.95 (0.46, 1.95) 0.49 (0.20, 1.18) 0.47 (0.12, 1.90)
LDL-C (mmol/L) 2.72 (0.73, 10.09) 0.79 (0.33, 1.90) 0.73 (0.19, 2.80)
HDL-C (mmol/L) 0.63 (0.03, 12.44) 0.26 (0.03, 2.22) 3.13 (0.22, 45.71)
HbA1c (%) 0.90 (0.54, 1.59) 0.48 (0.21, 1.09) 0.33 (0.08, 1.41)
NIHSS 1.06 (0.71, 1.57) 1.04 (0.82, 1.32) 1.14 (0.80, 1.61)
MMSE score 0.81 (0.63, 1.05) 0.72 (0.59, 0.87)* 0.77 (0.61, 0.98)*
MoCA score 0.85 (0.72, 1.01) 0.82 (0.73, 0.93)* 0.84 (0.71, 0.99)*
HbA1c
We found that the level of HbA1c was also a risk factor for post-stroke apathy. Padala et al. [33] found that ap-athy was prevalent in patients with diabetes without de-pression. The mean HbA1c level was 0.66% lower for apathetic patients as compared to non-apathetic ones. Apathy may have a negative impact on self-care behav-iors and diabetes control [33]. To the best of our know-ledge, this is the first time that this variable has been associated with post-stroke apathy. Because of small sample size, however, it is very likely that the statistically significant relationship between HbA1c and post-stroke apathy that we found was due to chance. Therefore, this possible relationship needs to be explored further in lar-ger studies before conclusions can be drawn.
Notably, results from our additional logistic regression analysis on patients separated into four categories, using patients without apathy and depression as the reference category, showed that most findings are largely similar; however, this additional analysis is limited by the lack of multivariate analysis due to small sample size. In this limited analysis, HbA1c is not a risk factor for post-stroke apathy, and new brain areas had also shown sig-nificant difference such as brain stem for post-stroke ap-athy and cerebellum for post-stroke depression. Thus, this highlights the importance of having more studies with larger sample size in order to confirm our findings.
Limitations
Our study had several limitations. The sample size of 75 stroke patients was small and the study was carried out at only one medical center with the testing instruments used being selected based on the availability of department and hospital team support. Also, there was no further investi-gation of the influence of damage in the cerebral regions on apathy or on the influence of impaired connectivity in each cerebral region on apathy. In addition, we excluded patients with severe aphasia because they could not complete the evaluation, and this might limit the generalization of our findings. Moreover, as pointed out by Mayo et al. [18], based on modern psychometric
standards, there is no available measurement of apathy that would be considered optimal. Lastly, we attempted to identify“risk factors”for apathy or depression alone; how-ever, results of multivariate multinomial logistic regression were not estimable due to small sample size.
Conclusions
A history of cerebrovascular disease and a low MDRS I/ P score appeared to be predictors of post-stroke apathy in the subacute phase. A low MDRS I/P score was also identified as a predictor of post-stroke depression. Our results suggested that a low HbA1c level might also be a predictor of post-stroke apathy but, because of small sample size, we believe that this finding may be explained by chance. We speculate that many risk fac-tors may lead to repeated ischemic stroke events, so that eventually the accumulation of lesions exceeds a thresh-old which then results in apathy as well as depression and cognitive disorders. These findings may help clini-cians recognize and treat apathy and depression in pa-tients after a stroke; however, before our findings become useful in a clinical setting, they would need to be confirmed in larger studies.
Competing interests
The authors declare that they have no competing interests.
Authors’contributions
SY guarantor of integrity of the entire study, study concepts, study design, definition of intellectual content, literature research, clinical studies, data analysis, statistical analysis, manuscript preparation, manuscript editing and review. PH guarantor of integrity of the entire study, study concepts, study design, definition of intellectual content, literature research, clinical studies, data analysis, statistical analysis, manuscript preparation, manuscript editing and review. XS definition of intellectual content, literature research, clinical studies, data acquisition, statistical analysis, manuscript preparation, manuscript editing. RH definition of intellectual content, literature research, clinical studies, data acquisition. XM definition of intellectual content, literature research, clinical studies, data acquisition. XP guarantor of integrity of the entire study, study concepts, study design, definition of intellectual content, literature research, clinical studies, statistical analysis, manuscript editing. All authors read and approved the final manuscript.
Acknowledgements
[image:9.595.57.540.115.186.2]This work was funded by the National Natural Science Foundation of China (81000508) and the Pearl River Science and Technology Star Fund (2012 J2200090).
Table 7 The results of univariate multinomial logistic regression for determining the risk factors of post-stroke apathy or depression alone(Continued)
FAB 0.87 (0.67, 1.12) 0.81 (0.69, 0.96)* 0.99 (0.73, 1.36)
HAMD 8.01 (1.27, 50.73)* 1.07 (0.82, 1.38) 11.16 (1.68, 74.05)*
Stroop color-naming
B-Atime 1.01 (0.99, 1.03) 1.01 (0.99, 1.02) 1.01 (0.99, 1.03)
B-Anumber 0.95 (0.85, 1.07) 0.93 (0.86, 1.01) 0.94 (0.84, 1.04)
*Significant factor, P < 0.05.
Reference group: Without apathy and depression (n = 44).
Abbreviations:SBPSystolic blood pressure,DBPDiastolic blood pressure,LDL-CLow-density lipoprotein cholesterol,HDL-CHigh-density lipoprotein cholesterol,
HbA1cHemoglobin A1c,NIHSSNational Institutes of health stroke scale,MMSEMini-mental state examination,MoCAMontreal cognitive assessment,MDRS I/P
Author details
1
Department of Neurology, Guangzhou First People’s Hospital, Guangzhou Medical University, No. 1 Panfu Road, Guangzhou 510180, China.2Sun Yat-sen Memorial Hospital, Sun Yat-sen University, Guangzhou 510120, China. Received: 27 December 2012 Accepted: 3 June 2013
Published: 5 June 2013
References
1. Starkstein SE, Manes F:Apathy and depression following stroke.CNS Spectr2000,5:43–50.
2. Jorge RE, Starkstein SE, Robinson RG:Apathy following stroke.Can J
Psychiatry2010,55:350–354.
3. Caeiro L, Ferro JM, Figueira ML:Apathy in acute stroke patients.Eur J
Neurol2012,19:291–297.
4. Brodaty H, Sachdev PS, Withall A, Altendorf A, Valenzuela MJ, Lorentz L: Frequency and clinical, neuropsychological and neuroimaging correlates of apathy following stroke–the Sydney Stroke Study.Psychol Med2005, 35:1707–1716.
5. Starkstein SE, Fedoroff JP, Price TR, Leiguarda R, Robinson RG:Apathy following cerebrovascular lesions.Stroke1993,24:1625–1630.
6. van Reekum R, Stuss DT, Ostrander L:Apathy: Why care?J Neuropsychiatry Clin Neurosci2005,17:7–19.
7. Starkstein SE, Petracca G, Chemerinski E, Kremer J:Syndromic validity of apathy in alzheimer’s disease.Am J Psychiatry2001,158:872–877. 8. Carota A, Berney A, Aybek S, Iaria G, Staub F, Ghika-Schmid F, Annable L,
Guex P, Bogousslavsky J:A prospective study of predictors of poststroke depression.Neurology2005,64:428–433.
9. Withall A, Brodaty H, Altendorf A, Sachdev PS:A longitudinal study examining the independence of apathy and depression after stroke: the Sydney Stroke Study.Int Psychogeriatr2011,23:264–273.
10. Hama S, Yamashita H, Yamawaki S, Kurosi K:Post-stroke depression and apathy: Interactions between functional recover, lesion detection, and emotional response.Psychogeriatrics2011,11:68–76.
11. Mezzich JE:International surveys on the use of ICD-10 and related diagnostic systems.Psychopathology2002,35(2–3):72–75.
12. Shaper AG, Wannamethee SG:Alcohol intake and mortality in middle aged men with diagnosed coronary heart disease.Heart2000,83:394–399. 13. Wannamethee SG, Shaper AG:Lifelong teetotallers, ex-drinkers and
drinkers: mortality and the incidence of major coronary heart disease events in middle-aged British men.Int J Epidemiol1997,26(3):523–531. 14. Marin RS, Biedrzycki RC, Firinciogullari S:Reliability and validity of the
apathy evaluation scale.Psychiatry Res1991,38:143–162.
15. Robert PH, Berr C, Volteau M, Bertogliati C, Benoit M, Sarazin M, Legrain S, Dubois B:PréAL study apathy in patients with mild cognitive impairment and the risk of developing dementia of Alzheimer’s disease: a one-year follow-up study.Clin Neurol Neurosurg2006,108(8):733–736.
16. Chan AS, Choi A, Chiu H, Lam L:Clinical validity of the Chinese version of mattis dementia rating scale in differentiating dementia of alzheimer’s type in Hong Kong.J Int Neuropsychol Soc2003,9:45–55.
17. Sagen U, Finset A, Moum T, Mørland T, Vik TG, Nagy T, Dammen T:Early detection of patients at risk for anxiety, depression and apathy after stroke.Gen Hosp Psychiatry2010,32:80–85.
18. Mayo NE, Fellows LK, Scott SC, Cameron J, Wood-Dauphinee S:A longitudinal view of apathy and its impact after stroke.Stroke2009,40:3299–3307. 19. Schroeter ML, Ettrich B, Schwier C, Scheid R, Guthke T, von Cramon DY:
Diffuse axonal injury due to traumatic brain injury alters inhibition of imitative response tendencies.Neuropsychologia2007,45:3149–3156. 20. Alexander GE:Basal ganglia-thalamocortical circuits: their role in control
of movements.J Clin Neurophysiol1994,11:420–431.
21. Bonelli RM, Cummings JL:Frontal-subcortical circuitry and behavior.
Dialogues Clin Neurosci2007,9:141–151.
22. Bhogal SK, Teasell R, Foley N, Speechley M:Lesion location and poststroke depression: systematic review of the methodological limitations in the literature.Stroke2004,35:794–802.
23. Vataja R, Pohjasvaara T, Mantyla R, Ylikoski R, Leskela M, Kalska H, Hietanen M, Juhani Aronen H, Salonen O, Kaste M, Leppavuori A, Erkinjuntti T: Depression-executive dysfunction syndrome in stroke patients.Am J
Geriatr Psychiatry2005,13:99–107.
24. Saczynski JS, Sigurdsson S, Jonsdottir MK, Eiriksdottir G, Jonsson PV, Garcia ME, Kjartansson O, Lopez O, van Buchem MA, Gudnason V, Launer LJ:
Cerebral infarcts and cognitive performance: importance of location and number of infarcts.Stroke2009,40:677–682.
25. Zamboni G, Huey ED, Krueger F, Nichelli PF, Grafman J:Apathy and disinhibition in frontotemporal dementia: insights into their neural correlates.Neurology2008,71:736–742.
26. Angelelli P, Paolucci S, Bivona U, Piccardi L, Ciurli P, Cantagallo A, Antonucci G, Fasotti L, Di Santantonio A, Grasso MG, Pizzamiglio L:Development of neuropsychiatric symptoms in poststroke patients: a cross-sectional study.Acta Psychiatr Scand2004,110:55–63.
27. Lee SR, Kim HY, Rogowska J, Zhao BQ, Bhide P, Parent JM, Lo EH: Involvement of matrix metalloproteinase in neuroblast cell migration from the subventricular zone after stroke.J Neurosci2006,26:3491–3495. 28. Matsumori Y, Hong SM, Fan Y, Kayama T, Hsu CY, Weinstein PR, Liu J:
Enriched environment and spatial learning enhance hippocampal neurogenesis and salvages ischemic penumbra after focal cerebral ischemia.Neurobiol Dis2006,22:187–198.
29. Ding Y, Li J, Clark J, Diaz FG, Rafols JA:Synaptic plasticity in thalamic nuclei enhanced by motor skill training in rat with transient middle cerebral artery occlusion.Neurol Res2003,25:189–194.
30. Granziera C, D’Arceuil H, Zai L, Magistretti PJ, Sorensen AG, de Crespigny AJ: Long-term monitoring of post-stroke plasticity after transient cerebral ischemia in mice using in vivo and ex vivo diffusion tensor MRI.Open
Neuroimag J2007,1:10–17.
31. Alexopoulos GS, Meyers BS, Young RC, Campbell S, Silbersweig D, Charlson M:‘Vascular depression’hypothesis.Arch Gen Psychiatry1997,54:915–922. 32. Hama S, Yamashita H, Shigenobu M, Watanabe A, Hiramoto K, Kurisu K,
Yamawaki S, Kitaoka T:Depression or apathy and functional recovery after stroke.Int J Geriatr Psychiatry2007,22:1046–1051.
33. Padala PR, Desouza CV, Almeida S, Shivaswamy V, Ariyarathna K, Rouse L, Burke WJ, Petty F:The impact of apathy on glycemic control in diabetes: a cross-sectional study.Diabetes Res Clin Pract2008,79:37–41.
doi:10.1186/1471-244X-13-164
Cite this article as:Yanget al.:Predictors of early post ischemic stroke
apathy and depression: a cross-sectional study.BMC Psychiatry201313:164.
Submit your next manuscript to BioMed Central and take full advantage of:
• Convenient online submission
• Thorough peer review
• No space constraints or color figure charges
• Immediate publication on acceptance
• Inclusion in PubMed, CAS, Scopus and Google Scholar
• Research which is freely available for redistribution