2017 2nd International Conference on Artificial Intelligence: Techniques and Applications (AITA 2017) ISBN: 978-1-60595-491-2
A New Method of Constructing a Weighted PPI Network
Xiao-wu SUN, Li-zhen LIU
*, Wei SONG and Chao DU
Information and Engineering Department, Capital Normal University, China *Corresponding author
Keywords: PPI network, Protein complex, Weight, Topology, Biology information.
Abstract. In order to filter out the PPI (protein-protein interaction) data noise and improve the accuracy of protein complexes prediction, this paper proposed a method to integrate biological information and topology information as the weight of the PPI network. There are also some traditional methods to deal with the data noise by topology information of biological information, but fewer of them integrate those two aspect. In this paper, we introduced a method to extract the feature vectors for protein couples or the interactions instead of single proteins based on both topology and biology information, then the cosine theory is used to measure the weight of PPI network. At last, it used four classical predicting protein complexes algorithms to detect protein complexes from different weighted PPI network. The result shows that our method performs better both on filtering out data noise and predicting protein complexes.
Introduction
In post-genome era, more and more biodata is available for the public, but how to mine further biological information by existing biodata has been another key problem[1]. Recently, detecting protein complexes from protein-protein interaction (PPI) networks becomes a popular research in biodata mining. Protein plays an essential role in the cell, however, it is reported that when proteins work in a cell, instead of working alone, different proteins interact with other proteins to form an interaction or a group to complete a function together. Those proteins interacting with each other and reacting together in the cell activity are called protein complex. Predicting protein complex is significant to reveal the cell organization or understand unknown protein structure and function.
Benefiting from the development of high-throughput techniques[2], a large number of PPI data is provided, nevertheless, there is serious false positive and false negative data. And the data will be applied to construct PPI networks where the vertexes represent different proteins and the edges stand for the interaction between two proteins, so how to filter out the false data will have an impact on the prediction. Apart from that, different from traditional method, computational method for detecting protein complexes from PPI network become a mainstream research point. In the past years, great efforts have been made in dealing with data noise or detecting protein complexes.
Related Work
Constructing weighted PPI networks is one of the most common methods to eliminate false data noise. Liu proposed that the topology information[3], such as the local density, degree of vertex or the number of same adjacent points ,can be regarded as the weight of the network, but this method leads to miss much potential biological information. In order to introduce the biological information, Wang computed the semantic similarity by gene ontology(GO) annotations as the weight[4]. GO is represented as a directed acyclic graph to show the relationship among different gene or the gene product, and can be divided into three parts including biological process, molecular functions and cellular components. The higher similarity score is, the closer the relationship between two proteins is, which indicates the more likely there is an interaction between the couple of proteins.
density method and hierarchical clustering method. Based on classical graph clustering, RNSC (Restricted Neighborhood Search Clustering) is proposed[5], but this method is affected by the parameters, to a great extend. In order to simulate random walking, Markov Clustering, another typical graph cluster algorithm is provided. It points that the high density module in the PPI network frequently hides protein complex, so Bader and Hogue[6] presented MCODE (Molecular Complex Detection) to improve the accuracy. The clustering result is not all the same because that each clustering algorithm runs from a different point of clustering view.
In order to better filter out the data noise and predict protein complex, this paper mainly focuses on the following aspects:
(1) not only introduce the topology information for the weight of the network but also integrate biology information
(2) Instead of constructing features of proteins, this paper extracts the features of all protein couples.
(3) We also compare the method with other traditional method to confirm that our method have a positive effect on predicting protein complexes.
Method
PPI network can be expressed as G=( , , )v e w wherevstands for a protein node, estands for an interaction between a couple of proteins, andwindicates the weight of network. As one of the most popular methods to filter out data noise, weighted network can improve the accuracy of predicting protein complexes. In this paper, we firstly extract topology information from PPI network, then combine biological information including the GO semantic similarity and protein gene expression value to construct the feature vector of all kinds of protein couples, lastly, compute the cosine value of feature vector and unit vector as the weights. Compared with traditional method, our method not only introduces topology information but also adopts biological message. In addition, traditional methods paid attention to the extract feature vector of each protein, then computing the cosine value among protein feature vectors as the weight, but feature vectors of each protein reflect the single protein’s feature instead of the interactions between protein couple. Our method proposes to build a vector to reflect the relationship between two protein directly.
Topology Information of PPI Network
The number of common neighbor nodes of two proteins is considered in this part as shown in formula (1). If two protein have more common nodes in a network, it illustrates that the probability that the two protein co-exist in the same protein complex will be greater.
2 ( , )
1 1
i j
i j
i j
N N
st p p
N N
∩ =
− − (1)
whereNistands for the number of proteinpi’s neighbor nodes, andNjrepresents the number of
proteinpj’s neighbor nodes andNi−1means the number of proteinpi’s neighbor nodes except
proteinpj. It can be concluded from formula (1) that if the neighbors of proteinpiare the same as
proteinpj’s, the valuest is equal to 1; on the other hand, if the neighbors of proteinpiare
completely different from proteinpj’s, the valuestis equal to 0.
Biological Information
GO is composed of three separate ontologies, this paper computes the semantic similarity with all of the interactions in these three ontologies, including molecular function (MF), biological process (BP) and cellular component (CC). The greater the semantic similarity is, the closer the relationship of the two proteins is, which means that the interaction in the PPI network is more likely true. There are many methods to measure the similarity such as Jiang, SimIC, Resnik and Lin[8], those methods are from a completely different point of view to evaluate the similarity, but in this paper Lin’s method is introduce to build the vector, because Lin’s method is more accuracy than other methods. Hence, the semantic similarity in MF, BP and CC is written as sMf , sBpandsCc.
Complex Information. There are a large number of standard protein complexes databases, in which MIPS and CYC2008 are the two most common databases. The protein complexes in MIPS are mined from published excellent paper by manual way, and the protein complexes provided by CYC2008 are gotten from small scale experiments with manual correction, which means that the complexes in CYC2008 are more accuracy than the high-through experiments, and the number of proteins in CYC2008 is larger than MIPS, so CYC2008 database is introduced in this paper. The complexes contains a wealth of information.
If two proteins appear in a common complexes frequently, it means that the relationship of those two proteins is pretty close, so their corresponding weight will be higher than others. The score of this part is measured by formula (2), whereciandcjmeans the complexes containing protein ior j.
From formula (2), we can see that if two proteins always appear in the same complex, the score
ofsCom p p( i, j)is equal 1; in contrast, if there in none complexes that contain both of the two
proteins, the score ofsCom p p( i, j)is 0.
2 ( i, j) i j
i j
c c
sCom p p
c c
∩
= (2)
Protein Co-expression Correlation. As far as we known, the proteins can’t be active all the time, if both of the two protein are active, it is possible to interact with each other to form a complex. So in order to describe the possibility, the protein co-expression correlation is often introduced to measure the connection of any two proteins, Zhang[9] et al. introduced Pearson correlation coefficientpccto compute the protein co-expression correlation which is written assCoe. The range of Pearson correlation coefficient is from -1 to 1, if the value is less than 0, it means that those two proteins are negative correlation, so that those two proteins can’t be active at the same time to form a complex. In contrast, if the value is more than 0, it is possible to interact with each other which is in active. Draw lessons from the analysis, the value of sCoe depends on the formula (3) as following:
0
0 0
pcc if pcc
sCoe
if pcc
>
=
≤
(3)
Feature Vector of the Interaction
According to the topology and biological information, the feature vector of protein-protein interaction can be represented as:
( , , , , , )
ppf st sMf sBp sCc sCom sCoe
→
=
w= ptp e
ptp e
i
(4)
where (1,1,1,1,1,1)T =
e .
Compared with traditional method, firstly our method integrates both topology and biological information, secondly, we build the feature vector for the protein couples instead of the single protein, lastly, we proposed to compute the similarity by cosine with unit vector.
Result and Evaluation Metrics
In this section, three frequently used evaluation metrics is introduced firstly, and we also compared our method with traditional method to prove that out method is an effective approach.
Evaluation Metrics
In order to evaluate our method and compare it with the benchmark, three evaluation metrics including precision, recall, F-measure are described in this part. The value of those three metrics depends on the neighborhood affinity score defined as formula (5) which aims at measuring the match degree between two complex sets.
2 ( , ) P B
P B
V V
NA P B
V V
∩ =
× (5)
wherePcomplex is predicted by our algorithm,Bis the benchmark complex set, and Vi is the vertex
set of i. WhenNA p b( , )≥0.2, it is believed that those two complex sets match with each other. The predicted complex will be regarded as the result, only the predicted complex matches with at least one complex in the benchmark, as described in formula (6).
{ | , , ( , ) 0.2}
cp
N = p p∈P ∃ ∈b B NA p b ≥ (6)
We can apply the same principle to explain about Ncb which is defined as following formula:
{ | , , ( , ) 0.2}
cb
N = b b∈B ∃ ∈p P NA p b ≥ (7) Based on the description of neighborhood affinity score mentioned above, the metrics precision, recall and F-measure can be expressed as following:
cp
N precision
P
= , Ncb
recall b
= ,F 2 precision recall precision recall
× ×
=
+ (8)
The precision value describes how many protein complexes predicted by a method are correct. In contrast, what the recall expresses is that how many benchmark complexes or known complexes have been indexed by the method. Sometimes the precision and the recall interact with each other to solve the problem, F-measure is introduced to balance precision and recall.
Experiment Database
The STRING data is chosen as the protein-protein interaction network data, GSE3431 is introduced as the gene expression data. GO annotation file is downloaded from Saccharomyces Genome Database. CYC2008 is chosen as the benchmark.
Experiment Result Analysis
0 0.1 0.2 0.3 0.4 0.5 0.6 0.7 0.8 0.9 1
P R F
Ipca_traditional weight Ipca_our weight
0 0.1 0.2 0.3 0.4 0.5 0.6 0.7
P R F
[image:5.612.96.517.65.217.2]Clique_traditional weight Clique_ our weight
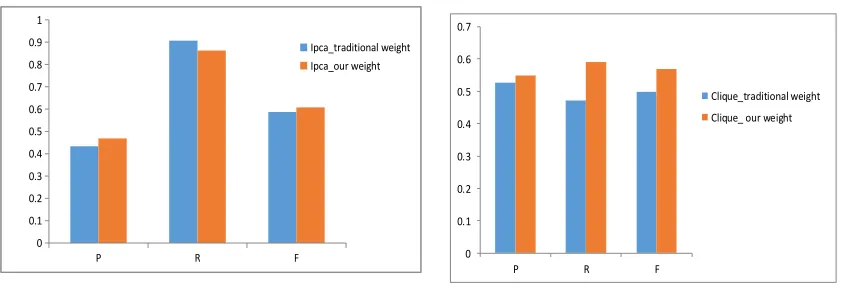
Figure 1. Results on Ipca algorithm. Figure 2. Results on Clique algorithm.
Figure 1 shows that the results of Ipca with different weights which are computed by traditional method and our method. From Figure 1, we can see that our method performs better on precision value and f-measure value. Figure 2 describes the results on Clique with two kinds of weight, it easily to say that Clique with our weight shows better effect on all of those three evaluation metrics. And Figure 3 illustrates the results on graph_entropy algorithm, although graph_entropy with our weight works not well on recall value and F-measure value, it performs much better on precision. We also test our method with Coach algorithm as shown in Figure 4, which explains that our weight shows also some advantages on precision and F-measure value, and basically equal to traditional weight on recall value. From Figure 1 to Figure 4, it can be concluded that the method of computing PPI weight proposed in this paper performs better on filtering out data noise and predicting protein complexes.
0 0.1 0.2 0.3 0.4 0.5 0.6 0.7 0.8 0.9
P R F
graph_entropy_traditional weight
graph_entropy_ our weight
0 0.1 0.2 0.3 0.4 0.5 0.6 0.7 0.8
P R F
coach
[image:5.612.95.523.381.533.2]coach_weight
Figure 3. Results on Graph_entropy. Figure 4. Results on Coach algorithm.
Conclusion
In this paper, we proposed a method to filter out PPI data noise to better predict protein complexes. We integrate the topology information with biology information for the weight of the network. Traditional method focused on constructing features of proteins, this paper extracts the features of all protein couples. In the experiment part, we also compared our method with traditional method to confirm that our method have a positive effect on predicting protein complexes.
Acknowledge
KM201610028015, Science and technology innovation platform, Teaching teacher, and Connotation Development of Colleges and Universities.
References
[1] Gavin A C, Aloy P, Grandi P, et al. Proteome survey reveals modularity of the yeast cell machinery[J]. Nature, 2006, 440(7084):631-636.
[2] Spirin, Alexander S. High-throughput cell-free systems for synthesis of functionally active proteins[J]. Trends in Biotechnology, 2004, 22(10):538-545.
[3] Liu G, Wong L, Chua H N. Complex discovery from weighted PPI networks.[J]. Bioinformatics, 2009, 25(15):1891.
[4] Wang J, Xie D, Lin H, et al. Identifying Protein Complexes from PPI Networks Using GO Semantic Similarity[C]// IEEE International Conference on Bioinformatics and Biomedicine. IEEE Computer Society, 2011:582-585.
[5] King A D, Pržulj N, Jurisica I. Protein Complex Prediction with RNSC[J]. 2012.
[6] Bader G D, Hogue C W. An automated method for finding molecular complexes in large protein interaction networks[J]. BMC Bioinformatics, 2003, 4(1):2.
[7] Ozawa Y, Saito R, Fujimori S, et al. Protein complex prediction via verifying and reconstructing the topology of domain-domain interactions.[J]. BMC Bioinformatics, 2010, 11(1):350.
[8] Price T, Peña F I, Cho Y R. Survey: Enhancing protein complex prediction in PPI networks with GO similarity weighting[J]. Interdisciplinary Sciences: Computational Life Sciences, 2013, 5(3):196-210.