M E T H O D
Open Access
OCEAN-C: mapping hubs of open
chromatin interactions across the genome
reveals gene regulatory networks
Tingting Li
1,2†, Lumeng Jia
1†, Yong Cao
1, Qing Chen
1and Cheng Li
1,3*Abstract
We develop a method called open chromatin enrichment and network Hi-C (OCEAN-C) for antibody-independent mapping of global open chromatin interactions. By integrating FAIRE-seq and Hi-C, OCEAN-C detects open chromatin interactions enriched by activecis-regulatory elements. We identify more than 10,000 hubs of open chromatin interactions (HOCIs) in human cells, which are mainly active promoters and enhancers bound by many DNA-binding proteins and form interaction networks crucial for gene transcription. In addition to identifying large-scale topological structures, including topologically associated domains and A/B compartments, OCEAN-C can detect HOCI-mediated chromatin interactions that are strongly associated with gene expression, super-enhancers, and broad H3K4me3 domains.
Background
The local chromatin conformation regulates gene tran-scriptional activity through facilitating interactions be-tween promoters and distant active regulatory elements such as enhancers, repressors, and silencers [1,2]. These
cis-regulatory elements are loosely packed and relatively free of nucleosomes, which are necessary for transcrip-tion factors and other regulatory proteins to gain access to DNA [3–5]. Traditionally, active regulatory elements (open chromatin) can be assayed genome-wide by DNase-hypersensitive sites identified by sequencing (DNase-seq) or formaldehyde-assisted isolation of regu-latory elements by sequencing (FAIRE-seq) [6,7].
Recently, several elaborate methods to identify chroma-tin interaction maps have been developed, including chro-matin interaction analysis by paired-end tag sequencing (ChIA-PET) [8] and chromosome conformation capture (3C)-based methods [9], such as 4C [10,11], 5C [12], Hi-C [13], in situ Hi-Hi-C [14], Hi-Capture-Hi-C [15], DNase-Hi-C [16], Micro-C [17], single-cell Hi-C [18, 19], HiChIP [20], and
PLAC-seq [21]. In particular, DNase-C identifies high-confidence DNA contacts at kilobase resolution by using DNase I to digest the genome DNA instead of restriction enzymes [16,22]. These techniques have greatly advanced our understanding of detailed features of the genome 3D structure and regulation of the genome [6,23–26]. How-ever, ChIA-PET, HiChIP, and PLAC-seq only determine the subset of interactions mediated by specific DNA-binding proteins, whereas Hi-C captures all genomic in-teractions indiscriminately, which may flood important contacts between open chromatin and distal regulatory elements.
In order to overcome these limitations, we integrated the FAIRE-seq and in situ Hi-C assays and developed the open chromatin enrichment and network Hi-C (OCEAN-C) method for mapping global open chromatin interactions. By aggregating open chromatin associated with interacting partners through direct phenol-chloroform extraction, OCEAN-C enriched interactions among active cis-regulatory elements, which mainly occurred among promoters and enhancers and thus reg-ulated gene transcription. OCEAN-C is a novel tool for studying open chromatin interactions and their relation-ship with gene regulation.
* Correspondence:cheng_li@pku.edu.cn †Equal contributors
1Peking-Tsinghua Center for Life Sciences, Academy for Advanced
Interdisciplinary Studies; School of Life Sciences, Peking University, Beijing 100871, China
3Center for Statistical Science; Center for Bioinformatics, Peking University,
Beijing 100871, China
Full list of author information is available at the end of the article
Results
Genome-wide open chromatin interaction assay using OCEAN-C
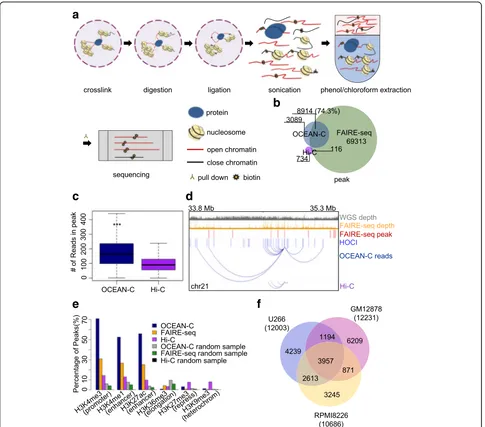
We first performed in situ Hi-C and FAIRE-seq experi-ments using U266 multiple myeloma cells to identify genome-wide chromatin interactions and open chromatin regions [14,27]. As expected, our data exhibited high re-producibility and typical features of Hi-C and FAIRE-seq results (Additional file1: Figure S1, Additional file2: Table S1). Next, we developed the OCEAN-C assay by integrat-ing the in situ Hi-C and FAIRE-seq protocols. A step for the phenol-chloroform extraction of nucleosome-depleted chromatin (open chromatin) was added after the biotinyl-ated residue addition and sonication steps of Hi-C, enab-ling the specific enrichment of nucleosome-free DNAs and DNA fragments that re-ligated with the open chroma-tin (Fig.1a, “Methods”). The ratio of isolated OCEAN-C DNA with respect to total genomic DNA is 1–3%, which is similar to FAIRE-seq [27]. The biotin-labeled DNA frag-ments were then enriched from the extracted OCEAN-C DNA and followed by library construction and high-throughput sequencing. Open chromatin regions that form peaks due to multiple chromatin interactions were then called by the ZINBA algorithm [28] used for FAIRE-seq peak identification.
We identified 12,003 OCEAN-C peaks (median of broad size was 1.4 kb and of narrow size 232 bp) with 43.4 million valid read pairs standing for intra-chromsomal interactions in the U266 cell line. Of these, 74.3% overlapped with FAIRE-seq peaks; in contrast, only 850 peaks were determined from the same number of Hi-C reads, which barely had any intersection with OCEAN-C or FAIRE-seq peaks (Fig. 1b). The high ratio of overlap with FAIRE-seq peaks confirmed that the peak regions determined by OCEAN-C are open chro-matin regions. Moreover, the OCEAN-C peaks only comprise a small portion (approximately 13%) of the total number of open chromatin regions identified by FAIRE-seq, indicating that most open chromatin regions do not show a significantly higher interaction frequency than other regions. We observed 174 interactions per OCEAN-C peak on average (Fig. 1c), which is signifi-cantly higher than the number for Hi-C data (pvalue < 2.2e-16). Therefore, OCEAN-C peaks represent chro-matin interaction hubs that form multiple interactions with a set of loci along the chromosome (Fig. 1d and Additional file 1: Figure S2A), and we name these re-gions hubs of open chromatin interactions (HOCIs). Correlation analysis using epigenetic markers revealed that HOCIs are mainly occupied by active histone modifi-cations (H3K4me3, approximately 70%; H3K4me1, ap-proximately 50%; and H3K27ac, apap-proximately 50%) at percentages that remarkably exceed those of open chro-matin identified by FAIRE-seq and Hi-C peaks (Fig. 1e),
demonstrating that HOCIs are mainly activecis-acting el-ements, especially promoters (H3K4me3) and enhancers (H3K4me1 and H3K27ac).
To further test the reproducibility and feasibility of OCEAN-C, we examined the method in RPMI-8226 mul-tiple myeloma cells and GM12878 lymphoblastoid cells. The three cell lines exhibited similar numbers of HOCIs and similar histone modification properties, demonstrat-ing that HOCIs represent a common phenomenon in dif-ferent cell lines (Fig.1fand Additional file1: Figure S2B). The large difference in the locations of HOCIs between different cell lines is suggestive of specific open chromatin interactions that are associated with gene regulation. Next, we compared the results of OCEAN-C and in situ Hi-C in identifying large-scale chromatin architectures such as topologically associated domains (TADs) and compart-ments and found that interaction heat maps, TADs, and A/B compartments exhibited high concordance between OCEAN-C and Hi-C (Additional file 1: Figure S2C–F), demonstrating the ability of OCEAN-C to identify the same TADs and A/B compartments as in situ Hi-C. Fur-thermore, we evaluated the effect of sequencing depth and software packages used on peak calling. The number of HOCIs identified was affected by low sequencing depth and gradually became saturated with increasing read num-ber (Additional file1: Figure S3A). By using the MACS2 software to call peaks from the OCEAN-C data of U266 cells, we obtained 9926 peaks, 4718 of which overlapped ZINBA-identified peaks, suggesting that the peak signals of open chromatin in OCEAN-C data can be detected by different algorithms and combining dif-ferent peak-calling methods may be helpful to identify reliable HOCIs (Additional file1: Figure S3B–E).
We also compared OCEAN-C with the DNase-C technique in identifying open chromatin interactions (Additional file 1: Figure S4). The results showed that while DNase-C method captures open-chromatin in-teractions at fine-scale, OCEAN-C performs better than DNase-C in peak calling and identifying accurate open chromatin interaction peaks.
by CTCF ChIA-PET, and 47% HOCIs overlapped with an-chors determined by Pol II ChIA-PET; in contrast, only 21% of the HOCIs were loop regions determined by Hi-C (Additional file 3: Table S2A). The overlap proportions demonstrate the ability of OCEAN-C in identifying kilobase-scale loop anchors. More importantly, the non-overlapping proportion demonstrates the specificity of the OCEAN-C method. While a pair of anchors from ChIA-PET mainly interact with each other, a HOCI interacts with a set of loci, including loop interactions (Figs. 1d and 2a). To further confirm the interactions between
HOCIs, we selected two clusters of HOCIs and performed 3C validation experiment. The results showed that over half of pairwise interactions among HOCIs of both clusters are detected by the 3C method (Additional file 1: Figure S5), demonstrating the reliability of HOCI interactions discov-ered by OCEAN-C.
As OCEAN-C is designed to capture interactions be-tween open chromatin regions without relying on specific antibodies, we speculated that HOCIs are chromatin regions bound by multiple DNA-binding proteins. To confirm this hypothesis, we integrated ChIP-seq data from
a
c
e
f
d
b
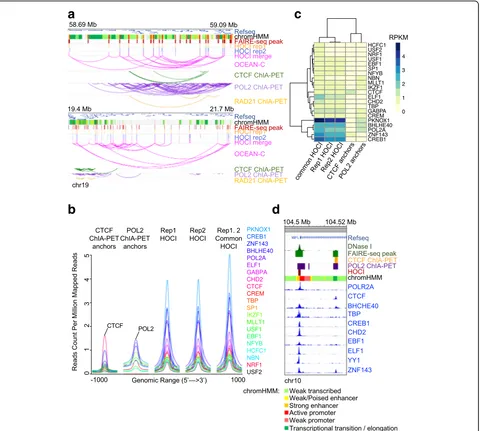
[image:3.595.57.542.87.514.2]ENCODE, ChIA-PET, and OCEAN-C data of GM12878 cells. As expected, chromatin anchors identified by CTCF ChIA-PET displayed much stronger CTCF ChIP-seq sig-nals than any other DNA-binding proteins, and Pol II also exhibited the strongest binding signal at anchors of Pol II ChIA-PET (Fig.2b), demonstrating the enrichment of spe-cific protein-binding regions in ChIA-PET experiments. In contrast, HOCIs displayed enriched binding signals for a larger set of DNA-binding proteins, including active transcription factors (PKNOX1, Pol II), transcription re-pressors (BHLHE40, SP1, YY1), transcription regulators
(ZNF143, CREB1, GABPA), and CTCF (Fig. 2b).
Moreover, several lymphoid cell-specific transcription factors showed strong binding signals, including E74-like factor 1 (ELF1) and Early B-cell factor 1 (EBF1), demon-strating the ability of OCEAN-C to identify key lineage-specific DNA-binding proteins (Fig. 2b). Specifically, the B-cell-specific transcription factor ELF1 showed higher binding signal at HOCIs than other factors except Pol II-related proteins (POL2A, PKNOX1, BHLHE40, ZNF143, and CREB1; Fig.2c).
On average, a HOCI is occupied by 9.1 different DNA-binding proteins, compared to an average of 6.7, 5.3, and 6.5 different DNA-binding proteins occupying a Pol II
a
b
c
d
[image:4.595.60.544.88.519.2]ChIA-PET anchor, CTCF ChIA-PET anchor, and Hi-C loop anchor, respectively (Additional file 1: Figure S6). Moreover, the ChIA-PET and Hi-C loop anchors over-lapping HOCIs were bound by significantly more DNA-binding proteins than the other anchors (t-test,p value < 2.2e-16; Additional file 1: Figure S6B), demonstrating that ChIA-PET can only capture a portion of HOCIs, which were DNA loop anchors occupied by both ChIA-PET anchor proteins and other DNA-binding proteins. In addition, contour plots showed that HOCIs had shorter width and more binding proteins overall, while most POL2/CTCF ChIA-PET anchors were longer and occupied by less than five different DNA-binding pro-teins (Additional file1: Figure S6C). We also analyzed the DNA sequence motifs of HOCIs and ChIA-PET anchors. CTCF ChIA-PET anchors showed extremely enriched CTCF/CTCFL DNA binding motifs, while HOCIs showed less difference in the significance level of the top five enriched motifs, including CTCF/CTCFL (Additional file1: Figure S6D). Specifically, at the locus of the geneWBP1L, two regions were identified as open chromatin regions by FAIRE-seq, one near the promoter and the other in close proximity to the promoter within the gene body (Fig.2d). The promoter of WBP1L was identified as a HOCI by OCEAN-C and confirmed by strong binding signals for many DNA-binding proteins, including Pol II but not CTCF, while the second open chromatin region was not identified as a HOCI due to the binding signals of mainly CTCF and Pol II but not other proteins (Fig.2d). Therefore, the occupancy of multiple proteins and frequent interac-tions with other chromatin regions distinguishes HOCIs from other open chromatin regions.
To further explore the genomic properties of HOCIs, we analyzed the chromatin states of HOCIs as well as anchors of CTCF or Pol II ChIA-PET in GM12878 cells (Additional file 1: Figure S7A). CTCF anchors were mainly marked as insulators, and Pol II anchors were mainly marked as promoters and enhancers, consistent with the biological function of these two proteins. HOCIs were most commonly identified as promoters (approximately 50%), followed by enhancers (approxi-mately 15%), and insulators (approxi(approxi-mately 15%). We clustered HOCIs according to their binding signals of multiple DNA-binding proteins. The results showed that promoter and enhancer HOCIs are occupied by many proteins, whereas insulator HOCIs are occupied by a few proteins, including CTCF, ZNF143, EBF1, and BHLHE40 (Additional file 1: Figure S7B). Meanwhile, HOCIs located within inactive chromatin regions had few interactions with DNA-binding proteins (Additional file 1: Figure S7B). Taken together, these results indicate that HOCIs identified by OCEAN-C are mainly func-tionalcis-regulatory elements that are bound by a cluster of regulatory proteins.
HOCIs form promoter- and enhancer-based topological architectures that associate with gene expression
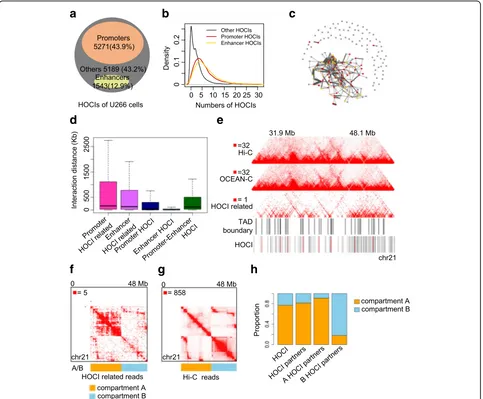
To further investigate the biological functions of HOCIs, we explored the chromatin interactions involved with HOCIs and their relationship with gene transcription. Similar to GM12878 cells (Additional file1: Figure S7A), the majority of HOCIs in U266 cells were promoters (44%) and enhancers (13%), as classified according to histone modifications (Fig. 3a). Most HOCIs also inter-acted with other HOCIs (six on average; Fig. 3b) and therefore formed an interaction network including pro-moters, enhancers, and other cis-regulatory elements across the entire chromosome (Fig. 3c and Additional file 1: Figure S8). We calculated the chromosomal dis-tances spanned by these interactions, and most interac-tions related to promoter HOCIs and enhancer HOCIs occurred within 500 kb, with a few interactions spanning several megabases (Fig.3d), consistent with the findings of a previous study using Capture-C [15]. Interac-tions within promoter HOCIs or enhancer HOCIs cov-ered significantly shorter chromosomal distances, with median distances of 44 and 13 kb, respectively, whereas interactions between promoter HOCIs and enhancer HOCIs had a longer median span of 117 kb (Fig.3d).
We next explored the location of HOCIs relative to the hierarchical spatial structures of the genome, includ-ing topological associated domains (TADs) and A/B compartments. HOCIs preferentially occurred at TAD boundaries (Fig. 3e, Additional file 3: Table S2B), and HOCI-mediated interactions were mainly within active A compartments (Fig. 3f, h); in contrast, Hi-C interac-tions occurred abundantly within both A and B com-partments (Fig. 3g). These results suggest that HOCI-mediated interactions preferentially involve active chro-matin regions, especially TAD boundaries.
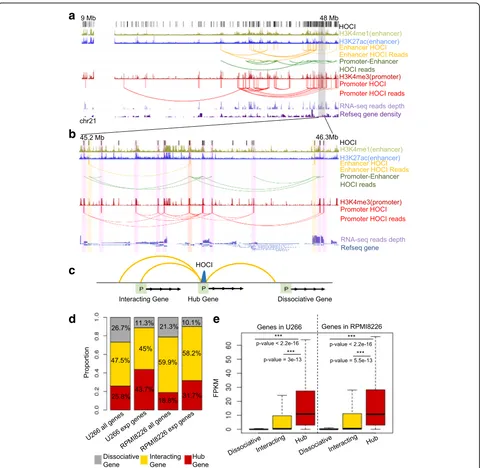
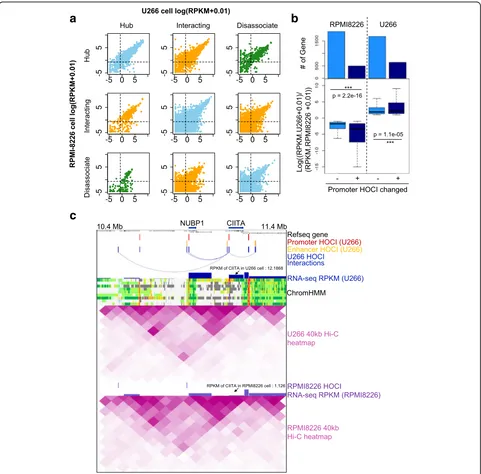
genes or interacting genes. The hub genes were expressed at a significantly higher expression level than genes of the two other groups, and dissociative genes showed the lowest expression level (Fig.4e). Furthermore, housekeeping genes comprised a higher proportion of hub genes than the expressed genes (Additional file 3: Table S2D). These re-sults demonstrate the key roles of HOCIs in forming pro-moter and enhancer chromatin interactions that are crucial for gene transcription.
HOCI-mediated interactions explain differential gene expression
We further investigated whether changes in HOCIs can explain differential gene transcription between different cell lines. We compared the gene transcription levels of two multiple myeloma cell lines (U266 and RPMI-8226) according to the three gene types defined above. Genes that have different types between the two cell lines showed significantly different gene expression, while
a
d
f
g
h
e
b
c
Fig. 3Characteristics of HOCIs.aThe proportion of three types of HOCIs (U266): promoters, enhancers, and others.bDensity distribution of the number of HOCIs interacting with different types of HOCIs.cInteraction network formed by HOCIs in chromosome 21 (U266).Red node, promoter HOCI;yellow, enhancer HOCI;gray, other HOCI. The thickness ofedgesindicates the interaction intensity between two HOCIs.dInteraction distance between HOCIs and their interacting regions.‘Promoter HOCI related’means that at least one end of a valid read pair is mapped to promoter HOCIs;
‘enhancer HOCI related’means that at least one end of a read pair is mapped to enhancer HOCIs; when both ends of a read pair belong to promoter HOCIs or enhancer HOCIs, the read pair is classified as‘Promoter HOCI’and‘enhancer HOCI’, respectively; when two ends of a read pair separately map to a promoter HOCI and an enhancer HOCI, the read pair is classified as‘Promoter-Enhancer HOCI’.eHeat maps showing Hi-C, OCEAN-C, and HOCI-related reads in chromosome 21 at 40 kb resolution.fHeat map of HOCI-related reads in chromosome 21 (U266) at 40-kb resolution with bins reordered by A/B compartments. Only valid pairs with at least one end mapped to HOCIs are defined as HOCI-related reads and used to generate the interaction heat map.gHeat map of Hi-C reads in chromosome 21 (U266) at 40-kb resolution with bins reordered by A/B compartments.
[image:6.595.58.541.88.487.2]genes that have the same types between the two cell lines showed similar transcription levels (Fig. 5a). Large decreases in transcription occurred with the disruption of HOCIs, whereas significant increases in transcription occurred with the formation of HOCIs (Additional file1: Figure S9). In particular, a gene tended to lose transcrip-tion completely when it transformed from a hub type to a dissociative type. This was further confirmed via com-parisons between differentially expressed genes that can
or cannot be explained by the change of HOCI-mediated interactions at promoters (Fig.5b). Genes with differential HOCI-mediated interactions showed signifi-cantly greater differential expression than those with no interaction changes.
To specifically illustrate the relationship between open chromatin interactions and gene expression, we selected one differentially expressed gene, Class II major histocompatibility complex transactivator (CIITA),
a
b
c
d
e
Fig. 4The association between HOCIs and gene expression.aThe browser view of a 40-Mb region showing the relationship between HOCI inter-actions and gene transcription levels.Loopsindicate read pairs (GM12878 cell).bMagnification of the region highlighted ingrayina.cThe model of three different types of genes.Hub gene, the promoter is a HOCI;interacting gene, the promoter interacts with a HOCI;dissociative gene, the promoter has no interaction with a HOCI.dThe proportion of the three gene types within all genes or transcribed genes (“exp genes”).
[image:7.595.59.539.86.554.2]an important gene that participates in B-cell differen-tiation, and examined the nearby open chromatin in-teractions, Hi-C heat maps, and RNA-expression levels (Fig. 5c). In U266 cells, the promoter of CIITA was identified as a HOCI that forms multiple interac-tions with nearby genes, associating with high expression of the gene, whereas such HOCIs and interactions were
not detected in RPMI8226 cells, associating with a weak transcription signal of the gene. In contrast, Hi-C heat maps cannot detect such differences at 40-kb resolution. Taken together, we demonstrated that OCEAN-C identified HOCI-mediated open chromatin interactions that are crucial for gene transcription and changes.
a
c
b
[image:8.595.58.539.87.561.2]Most super-enhancers and many broad H3K4me3 domains overlap with HOCIs
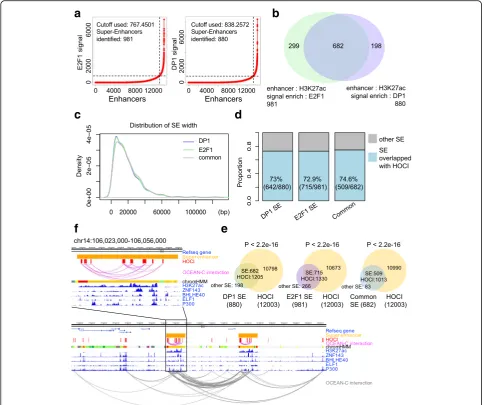
Super-enhancers are defined by exceptional enrichment of master transcription factor binding or active chroma-tin markers determined by ChIP-seq, and they confer high transcriptional activity to nearby genes [29, 30]. Since super-enhancers are relatively broad open chroma-tin regions that participate in gene regulation through chromatin interaction [29, 30] and OCEAN-C captures open-chromatin interactions, we speculated that HOCIs overlap with super-enhancers. The interaction distances among enhancer HOCIs are significantly shorter than other types of HOCI interactions, indicating that enhan-cer HOCIs may form super-enhanenhan-cers (Fig.3d). To con-firm this hypothesis, we defined super-enhancers in U266 cells through ChIP-seq data of H3K27Ac, E2F1, and DP1 following previous instructions (Fig.6a-c). Among the 880 super-enhancers defined by H3K27ac/DP1, 642 (73%) overlapped with HOCIs; among the 981 super-enhancers defined by H3K27ac/E2F1, 715 (72.9%) overlapped with HOCIs, demonstrating that most super-enhancers are composed of HOCIs (Fig. 6d, e). Interestingly, super-enhancers formed interactions with themselves and with dif-ferent super-enhancers through the interactions of HOCIs (Fig. 6f). These results demonstrate that most super-enhancers are composed of HOCIs and OCEAN-C is cap-able of identifying super-enhancers and their interactions.
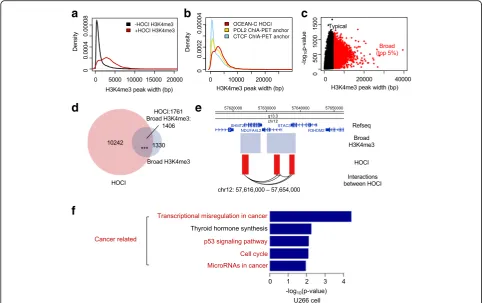
Broad H3K4me3 domains (wider than 4 kb) are as-sociated with increased transcription elongation and enhancer activities, especially at tumor suppressor genes, and form chromatin interactions with super-enhancers [31, 32]. In GM12878 cells, H3K4me3 re-gions overlapping with HOCIs showed broader signals compared with the rest of the H3K4me3 regions or the H3K4me3 regions overlapping with ChIA-PET an-chors (Fig. 7a, b), suggesting the enrichment of long H3K4me3 peaks in HOCIs. We next analyzed the re-lationship between HOCIs and broad H3K4me3 do-mains, which are potentially long open chromatin regions. We defined 2736 broad H3K4me3 regions in U266 cells and 51.4% (1406) of them overlapped with HOCIs (Fig. 7c, d). Most broad H3K4me3 re-gions contained one to five interacting HOCIs. Specif-ically, two nearby broad H3K4me3 regions at chr12: 57620000–57,640,000 interacted with each other through the three HOCIs within them (Fig. 7e). In addition, we performed pathway enrichment analysis of the genes whose promoters overlap with both HOCIs and broad H3K4me3 domains, and found that four out of the five top enriched pathways were re-lated to cancer (Fig. 7f). These results demonstrate that many broad H3K4me3 domains are composed of HOCIs and OCEAN-C is capable of identifying broad H3K4me3 domains and their interactions.
Discussion
Hi-C-based methods and ChIA-PET have greatly
advanced our understanding of the 3D architecture of the nucleus by uncovering TADs, compartments, and chromatin loops. Previous ChIA-PET studies illustrate that promoter–promoter interactions provide a topo-logical basis for transcriptional regulation, and CTCF and cohesin mediate the formation of 3D genome archi-tectures [26, 33]. Several algorithms have been devel-oped to discover chromatin interaction structures such as chromatin interaction hubs [34], long-range inter-action networks [35], inter-chromosomal chromatin clusters [36], and active promoter–enhancer associations [37] by integrating Hi-C data with epigenome and tran-scriptome data. However, Hi-C requires billions of reads to detect loops, while ChIA-PET and HiChIP are antibody-dependent and thus only capture DNA interac-tions mediated by specific proteins. Capture-C mainly captures interactions directly involving promoters. To overcome these limitations, we developed the OCEAN-C method, which enriches open chromatin interactions through phenol-chloroform extraction without using antibodies. OCEAN-C can identify sharp open chroma-tin regions interacchroma-ting with many other chromachroma-tin re-gions, which we define as HOCIs, and facilitates the study of open chromatin interactions. We show that OCEAN-C is reproducible, time saving (~ 3 days), and has low sequencing costs (~ 100 million read pairs are sufficient to identify 10,000 HOCIs along with TADs and compartments).
the activation or inactivation of developmental genes or cancer genes due to the changes in chromatin conformation.
Despite these advantages, the current version of OCEAN-C has several areas that could be improved. First, OCEAN-C is based on the Hi-C method, which only captures chromatin interactions near recognition sites of the specific restriction enzyme used. Although the four-base restriction enzymes we used have abun-dant cutting sites along the genome, they may miss capturing certain chromatin regions. Second, because 1–3% of the total DNA was extracted as chromatin
interactions related to open chromatin, OCEAN-C needs ~ 1 million cells in order to obtain sufficient DNA for library construction, which restricts its ap-plication for clinical samples. We will continue to de-velop and improve OCEAN-C to overcome these limitations.
Conclusions
We demonstrate that OCEAN-C is a powerful method for investigating open chromatin interactions and the dynamic of HOCIs in regulating gene transcription.
a
c
e
f
d
b
Fig. 6Overlaps between HOCIs and super-enhancers.aIdentification of super-enhancers in U266 cells based on E2F1 or DP1 signals.bVenn diagram showing the overlap between the two types of super-enhancers defined by E2F1 or DP1 signals (U266).cThe length distribution of the two types of super-enhancers defined by E2F1 or DP1 signals (U266).SEsuper-enhancer.dProportions of super-enhancers overlapping HOCIs.
[image:10.595.56.541.88.493.2]Methods
Cell culture and collection
U266 cells (ATCC TIB-196), RPMI8226 cells (ATCC CCL-155), and GM12878 cells were grown in RPMI-1640 medium containing 10% fetal bovine serum at 37°C and 5% CO2. The cells were cultured to 80–90% conflu-ence and then collected and washed once with PBS. For crosslinking cells, formaldehyde was added at a final concentration of 1% at room temperature (RT) for 10 min, and then quenched with glycine (0.2 M) for 5 min. The crosslinked cells were washed once with PBS, flash-frozen by liquid nitrogen, and stored at−80 ° C for further usage.
FAIRE-seq and in situ Hi-C experiments
These two experiments were performed strictly in line with previously reported protocols [14, 27]. For FAIRE-seq data, reads were mapped to the hg19 assembly by bwa-mem, filtering was performed by removing un-mapped and duplicated reads, and open chromatin peaks were determined by ZINBA [28] using the following
parameters: input = none, offset = 50, method =“mixture,” peak confidence = 0.95, numProc = 4, buildwin = 1, refine-peaks = 1, selected model = T, tol = 1 × 10⁻⁵, and others as default. The“–broad”parameter was set to TRUE when calling broad peaks by the“callpeak” function of ZINBA. For Hi-C data, reads were trimmed to 36 bp and aligned to the hg19 assembly by bowtie2. Only uniquely mapped read pairs (MAPQ > 1) were kept, filtering was performed following previous protocols, the interaction matrix was normalized by the ICE method, and TADs and A/B compartments were identified using the HiTC package.
RNA-seq experiment
U266 and RPMI8226 cells were cultured to 80–90% confluence and harvested. RNA purification and library construction were performed by Novogene (Beijing, China) with three independent replicates for each cell line, and the differential expression analysis was per-formed using the TopHat-cufflinks software with the recommended parameters.
a
b
d
f
e
c
Fig. 7Overlaps between HOCIs and broad H3K4me3 domains.aThe width distribution of H3K4me3 peaks.Red, H3K4me3 peaks overlapped with HOCIs;black, not overlapped with HOCIs (GM12878).bThe width distribution of H3K4me3 peaks.Red, overlapping HOCIs;gold, overlapping POL2 ChIA-PET anchors;blue, overlapping CTCF ChIA-PET anchors (GM12878).cThe -log10p-value of H3K4me3 peaks (y-axis) are plotted against peak
[image:11.595.56.539.88.391.2]OCEAN-C experiment
Cell fixation, digestion, and re-ligation
Digestion with the MboI enzyme, filling-in with biotin-labeled dATP, and re-ligation by the T4 ligase were per-formed using fixed cells (2–5 × 10⁶
cells) following the instructions of the in situ Hi-C method.
Cell sonication
Cells were resuspended in 2 ml lysis buffer (10 mM Tris-HCl [pH 8.0], 2% Triton X-100, 1% SDS, 100 mM NaCl, and 1 mM EDTA) and sonicated to an average DNA fragment size of 300–400 bp (Branson Sonifier 450D). The results for each 30 s of sonication were checked under a microscope until no intact cells were observed. The cells were kept on ice and foaming was avoided. The efficiency of sonication was further con-firmed by agarose gels of purified DNA from a portion (5%, 100μl) of the cell lysate.
Open chromatin purification
The supernatants were transfered to new 1.5 ml tubes after centrifugation (15,000-20,000×g for 5 min at 4°C). To purify the open chromatin, 1 volume phenol-chloroform-isoamyl alcohol was added to each aliquot of cell lysate. After vortexing for 10 s, each aliquot was cen-trifuged at 13,000×g for 5 min, and the top layer was transferred to a fresh 1.5 ml tube. The phenol–chloro-form–isoamyl alcohol extraction step was repeated once, after which 200 μl of chloroform–isoamyl alcohol were added to each tube to remove traces of phenol, and the aqueous layer was transferred to a new 1.5-ml tube. Next, a 1/10 volume of 3 M sodium acetate (pH 5.2), 2 volumes of 95% ethanol, and 1μl of 20 mg/ml glycogen were added to each tube and incubated at−80 °C for 30 min (or lon-ger) after fully mixing the sample. Each pellet was centri-fuged at 13,000×g for 15 min at 4 °C, and the DNA pellet was washed twice with 500 μl of ice-cold 70% ethanol. The DNA was dried by leaving tubes open for 5 min and re-suspended in 200μl of 10 mM Tris-HCl (pH 7.4).
Reverse cross-linking and DNA quantification
DNase-free RNase A (1 μl) was added following 30 min of incubation at 37 °C, and 1 μl of proteinase K was added and incubated at 55 °C for 1 h and then at 65 °C overnight to reverse cross-linking. The DNA was collected by adding 0.9 volume of AMPure XP beads (Beckman Coulter, A63881) and washed with 300 μl 10 mM Tris-HCl (pH 7.4). The concentration of DNA was measured by Qubit. The amount of purified DNA should not exceed 5% of total genomic DNA (1–3%). An optimized step can be performed to boost the yield be-fore the biotin pull-down operation by sonicating the purified DNA with Covaris to a median fragment size of 300–500 bp.
Biotin pull-down
Myone Streptavidin T1 beads (150μl; Life technologies) were washed once with 400 μl 1 × TWB (5 mM Tris-HCl (pH 7.5), 0.05 mM EDTA, 1 M NaCl, 0.05% Tween 20), separated on a magnet, and resuspended with 300 μl 2× binding buffer (10 mM Tris-HCl (pH 7.5), 1 mM EDTA, 2 M NaCl). Then DNA dissolved in 300μl 10 mM Tris-HCl (pH 7.4) was added into the bead solu-tion and incubated at RT for 15 min with rotasolu-tion. The beads were then separated on a magnet and biotinylated DNA was bound to the streptavidin beads.
Sequencing library construction
The library preparation processes were performed with streptavidin beads as described for the in situ Hi-C protocol. Briefly, the ends of sheared DNA were repaired and the biotin from un-ligated ends was removed, adapters were added to the A-tailed DNA fragments, and PCR was performed with eight to ten cycles using Illumina primers. Finally, DNA size selection was per-formed with 0.65–0.8× volume of AMPure XP beads to make sure the DNA length distributes between 300 and 500 bp. The library was quantified with Qubit and se-quenced using an Illumina sequencing platform.
OCEAN-C data processing
network of HOCIs was constructed using the ggnet R package.
Statistical analysis
The pvalues in Figs.4eand 5bwere generated using t -test with specified two-group data.
Identification of super-enhancers
We used the rose software to identify enhancers [29]. First, enhancers were defined by H3K27ac ChIP-seq enriched regions. Second, the total background-subtracted ChIP-seq binding signals of DP1 or E2F1 were used to rank all enhancers and plotted (in units of rpm/bp). Fi-nally, the x-axis points were identified where a line with slope of 1 was tangent to the curve, and the enhancers to the right of this point were defined as super-enhancers. Enhancers within 12.5 kb were stitched together, and re-gions within 2 kb of transcription start sites were consid-ered as promoters rather than enhancers. The ChIP-seq data (H3K27ac, DP1 and E2F1) of U266 were downloaded from BipProject of NCBI (PRJNA319620).
Identification of broad H3K4me3 peaks
Broad H3K4me3 peaks were called from ChIP-seq data downloaded from ENCODE using MACS2 [38]. The “gapped peaks”were ranked by their width. The top 5% of peaks in width were defined as broad H3K4me3 peaks.
Motif analysis
We use Homer [39] to find enrichment of sequence mo-tifs. HOCIs and ChIA-PET anchors in bed format were used as input. The “Known Results” were used as final results.
KEGG pathway enrichment analysis
We use DAVID [40] to find KEGG pathway enrichment. Genes whose promoters overlap with HOCIs were used as background, while genes whose promoters overlap with both HOCIs and broad H3K4me3 peaks were used as the input gene list.
Additional files
Additional file 1:Figures S1–S11.(PDF 5443 kb)
Additional file 2:Table S1.Summary of OCEAN-C, FAIRE-seq, Hi-C, and RNA-seq data. (PDF 19 kb)
Additional file 3:Table S2.Summary of HOCI and gene expression data analysis. (PDF 22 kb)
Additional file 4:Table S3.Information of public data used in this study. (PDF 20 kb)
Acknowledgements
We thank Zhihua Zhang for providing the GM12878 cell line, and Yujie Sun, Xiong Ji, Yong Zhang, Zhihua Zhang, Yixin Yao, and reviewers for critical comments on this study.
Funding
This work was supported by funding from Peking-Tsinghua Center for Life Sciences, School of Life Sciences and Center for Statistical Science of Peking University, National Natural Science Foundation China Key Research Grant 71532001, and Chinese National Key Projects of Research and Development (2016YFA0100103).
Availability of data and materials
All related sequencing data have been uploaded to the Genome Sequence Archive (GSE100832), and all related analysis scripts are stored at GitHub (https://github.com/ChengLiLab/OCEAN-C/) [41] and zenodo (DOI:https://doi.org/10.5281/zenodo.1210107) [42]. The public datasets used in this paper were downloaded from GEO and ENCODE databases (Additional file4: Table S3). The ChIP-seq datasets of the GM12878 cell line were downloaded from ENCODE [43]. The ChIA-PET and Hi-C data of GM12878 are publicly available: Tang et al. (GSE72816) [26], Rao et al. (GSE63525) [14]. The ChIP-seq datasets of the U266 cell line were down-loaded from BioProject of NCBI (PRJNA319620 and PRJEB1912). The ChiA-PET, FAIRE-seq, DNase-C and DNase-seq datasets of the K562 cell line are publicly available: Li et al. (GSE39495) [43], Furey et al. (GSE35239) [43], Ma et al. (GSE56869) [16], and Encode Project Consortium (GSE90438) [43].
Authors’contributions
LTT designed this project and supervised the study with LC. LTT, JLM, and CY performed the experiments, JLM performed data analysis, and CQ participated in the project. LTT, JLM, and LC wrote the manuscript. All authors read and approved the final manuscript.
Competing interests
The authors declare that they have no competing interests.
Publisher’s Note
Springer Nature remains neutral with regard to jurisdictional claims in published maps and institutional affiliations.
Author details
1Peking-Tsinghua Center for Life Sciences, Academy for Advanced
Interdisciplinary Studies; School of Life Sciences, Peking University, Beijing 100871, China.2State Key Laboratory of Proteomics, National Center of
Biomedical Analysis, Institute of Basic Medical Sciences, Beijing 100850, China.3Center for Statistical Science; Center for Bioinformatics, Peking
University, Beijing 100871, China.
Received: 3 February 2018 Accepted: 30 March 2018
References
1. Thurman RE, Rynes E, Humbert R, Vierstra J, Maurano MT, Haugen E, Sheffield NC, Stergachis AB, Wang H, Vernot B, et al. The accessible chromatin landscape of the human genome. Nature. 2012;489:75–82. 2. Rivera CM, Ren B. Mapping human epigenomes. Cell. 2013;155:39–55. 3. Gaffney DJ, McVicker G, Pai AA, Fondufe-Mittendorf YN, Lewellen N,
Michelini K, Widom J, Gilad Y, Pritchard JK. Controls of nucleosome positioning in the human genome. PLoS Genet. 2012;8:e1003036. 4. Schones DE, Cui K, Cuddapah S, Roh TY, Barski A, Wang Z, Wei G, Zhao K.
Dynamic regulation of nucleosome positioning in the human genome. Cell. 2008;132:887–98.
5. Albert I, Mavrich TN, Tomsho LP, Qi J, Zanton SJ, Schuster SC, Pugh BF. Translational and rotational settings of H2A.Z nucleosomes across the Saccharomyces cerevisiae genome. Nature. 2007;446:572–6.
6. Boyle AP, Davis S, Shulha HP, Meltzer P, Margulies EH, Weng Z, Furey TS, Crawford GE. High-resolution mapping and characterization of open chromatin across the genome. Cell. 2008;132:311–22.
7. Giresi PG, Kim J, McDaniell RM, Iyer VR, Lieb JD. FAIRE (Formaldehyde-Assisted Isolation of Regulatory Elements) isolates active regulatory elements from human chromatin. Genome Res. 2007;17:877–85. 8. Fullwood MJ, Wei CL, Liu ET, Ruan Y. Next-generation DNA sequencing of
9. Dekker J, Rippe K, Dekker M, Kleckner N. Capturing chromosome conformation. Science. 2002;295:1306–11.
10. Simonis M, Klous P, Splinter E, Moshkin Y, Willemsen R, de Wit E, van Steensel B, de Laat W. Nuclear organization of active and inactive chromatin domains uncovered by chromosome conformation capture-on-chip (4C). Nat Genet. 2006;38:1348–54.
11. Zhao Z, Tavoosidana G, Sjolinder M, Gondor A, Mariano P, Wang S, Kanduri C, Lezcano M, Sandhu KS, Singh U, et al. Circular chromosome
conformation capture (4C) uncovers extensive networks of epigenetically regulated intra- and interchromosomal interactions. Nat Genet. 2006;38: 1341–7.
12. Dostie J, Richmond TA, Arnaout RA, Selzer RR, Lee WL, Honan TA, Rubio ED, Krumm A, Lamb J, Nusbaum C, et al. Chromosome Conformation Capture Carbon Copy (5C): a massively parallel solution for mapping interactions between genomic elements. Genome Res. 2006;16:1299–309.
13. Lieberman-Aiden E, van Berkum NL, Williams L, Imakaev M, Ragoczy T, Telling A, Amit I, Lajoie BR, Sabo PJ, Dorschner MO, et al.
Comprehensive mapping of long-range interactions reveals folding principles of the human genome. Science. 2009;326:289–93. 14. Rao SS, Huntley MH, Durand NC, Stamenova EK, Bochkov ID, Robinson JT,
Sanborn AL, Machol I, Omer AD, Lander ES, et al. A 3D map of the human genome at kilobase resolution reveals principles of chromatin looping. Cell. 2014;159:1665–80.
15. Mifsud B, Tavares-Cadete F, Young AN, Sugar R, Schoenfelder S, Ferreira L, Wingett SW, Andrews S, Grey W, Ewels PA, et al. Mapping long-range promoter contacts in human cells with high-resolution capture Hi-C. Nat Genet. 2015;47:598–606.
16. Ma W, Ay F, Lee C, Gulsoy G, Deng X, Cook S, Hesson J, Cavanaugh C, Ware CB, Krumm A, et al. Fine-scale chromatin interaction maps reveal the cis-regulatory landscape of human lincRNA genes. Nat Methods. 2015;12:71–8. 17. Hsieh TH, Weiner A, Lajoie B, Dekker J, Friedman N, Rando OJ. Mapping
Nucleosome Resolution Chromosome Folding in Yeast by Micro-C. Cell. 2015;162:108–19.
18. Nagano T, Lubling Y, Yaffe E, Wingett SW, Dean W, Tanay A, Fraser P. Single-cell Hi-C for genome-wide detection of chromatin interactions that occur simultaneously in a single cell. Nat Protoc. 2015;10:1986–2003.
19. Nagano T, Lubling Y, Stevens TJ, Schoenfelder S, Yaffe E, Dean W, Laue ED, Tanay A, Fraser P. Single-cell Hi-C reveals cell-to-cell variability in chromosome structure. Nature. 2013;502:59–64.
20. Mumbach MR, Rubin AJ, Flynn RA, Dai C, Khavari PA, Greenleaf WJ, Chang HY. HiChIP: efficient and sensitive analysis of protein-directed genome architecture. Nat Methods. 2016;13:919-922
21. Fang R, Yu M, Li G, Chee S, Liu T, Schmitt AD, Ren B. Mapping of long-range chromatin interactions by proximity ligation-assisted ChIP-seq. Cell Res. 2016;26:1345–8.
22. Ma W, Ay F, Lee C, Gulsoy G, Deng X, Cook S, Hesson J, Cavanaugh C, Ware CB, Krumm A, et al. Using DNase Hi-C techniques to map global and local three-dimensional genome architecture at high resolution. Methods. 2018; S1046-2023(17)30240-2
23. Song L, Zhang Z, Grasfeder LL, Boyle AP, Giresi PG, Lee BK, Sheffield NC, Graf S, Huss M, Keefe D, et al. Open chromatin defined by DNaseI and FAIRE identifies regulatory elements that shape cell-type identity. Genome Res. 2011;21:1757–67.
24. Murtha M, Strino F, Tokcaer-Keskin Z, Sumru Bayin N, Shalabi D, Xi X, Kluger Y, Dailey L. Comparative FAIRE-seq analysis reveals distinguishing features of the chromatin structure of ground state- and primed-pluripotent cells. Stem Cells. 2015;33:378–91.
25. Dekker J, Mirny L. The 3D genome as moderator of chromosomal communication. Cell. 2016;164:1110–21.
26. Tang Z, Luo OJ, Li X, Zheng M, Zhu JJ, Szalaj P, Trzaskoma P, Magalska A, Wlodarczyk J, Ruszczycki B, et al. CTCF-Mediated Human 3D Genome Architecture Reveals Chromatin Topology for Transcription. Cell. 2015;163: 1611–27.
27. Simon JM, Giresi PG, Davis IJ, Lieb JD. Using formaldehyde-assisted isolation of regulatory elements (FAIRE) to isolate active regulatory DNA. Nat Protoc. 2012;7:256–67.
28. Rashid NU, Giresi PG, Ibrahim JG, Sun W, Lieb JD. ZINBA integrates local covariates with DNA-seq data to identify broad and narrow regions of enrichment, even within amplified genomic regions. Genome Biol. 2011;12:R67.
29. Hnisz D, Abraham BJ, Lee TI, Lau A, Saint-Andre V, Sigova AA, Hoke HA, Young RA. Super-enhancers in the control of cell identity and disease. Cell. 2013;155:934–47.
30. Whyte WA, Orlando DA, Hnisz D, Abraham BJ, Lin CY, Kagey MH, Rahl PB, Lee TI, Young RA. Master transcription factors and mediator establish super-enhancers at key cell identity genes. Cell. 2013;153:307–19.
31. Chen K, Chen Z, Wu D, Zhang L, Lin X, Su J, Rodriguez B, Xi Y, Xia Z, Chen X, et al. Broad H3K4me3 is associated with increased transcription elongation and enhancer activity at tumor-suppressor genes. Nat Genet. 2015;47:1149–57.
32. Cao F, Fang Y, Tan HK, Goh Y, Choy JYH, Koh BTH, Hao Tan J, Bertin N, Ramadass A, Hunter E, et al. Super-enhancers and broad H3K4me3 domains form complex gene regulatory circuits involving chromatin interactions. Sci Rep. 2017;7:2186.
33. Li G, Ruan X, Auerbach RK, Sandhu KS, Zheng M, Wang P, Poh HM, Goh Y, Lim J, Zhang J, et al. Extensive promoter-centered chromatin interactions provide a topological basis for transcription regulation. Cell. 2012;148:84–98. 34. Huang JL, Marco E, Pinello L, Yuan GC. Predicting chromatin organization
using histone marks. Genome Biol. 2015;16:162.
35. Sandhu KS, Li G, Poh HM, Quek YL, Sia YY, Peh SQ, Mulawadi FH, Lim J, Sikic M, Menghi F, et al. Large-scale functional organization of long-range chromatin interaction networks. Cell Rep. 2012;2:1207–19.
36. Dai C, Li W, Tjong H, Hao S, Zhou Y, Li Q, Chen L, Zhu B, Alber F, Jasmine Zhou X. Mining 3D genome structure populations identifies major factors governing the stability of regulatory communities. Nat Commun. 2016;7: 11549.
37. Zhu Y, Chen Z, Zhang K, Wang M, Medovoy D, Whitaker JW, Ding B, Li N, Zheng L, Wang W. Constructing 3D interaction maps from 1D epigenomes. Nat Commun. 2016;7:10812.
38. Zhang Y, Liu T, Meyer CA, Eeckhoute J, Johnson DS, Bernstein BE, Nusbaum C, Myers RM, Brown M, Li W, et al. Model-based analysis of ChIP-Seq (MACS). Genome Biol. 2008;9:R137.
39. Heinz S, Benner C, Spann N, Bertolino E, Lin YC, Laslo P, Cheng JX, Murre C, Singh H, Glass CK. Simple combinations of lineage-determining
transcription factors prime cis-regulatory elements required for macrophage and B cell identities. Mol Cell. 2010;38:576–89.
40. Huang da W, Sherman BT, Lempicki RA. Systematic and integrative analysis of large gene lists using DAVID bioinformatics resources. Nat Protoc. 2009;4:44–57.
41. Li T, Ji L, Cao Y, Chen Q, Li C. OCEAN-C: mapping hubs of open chromatin interactions across the genome reveals gene regulatory networks. Github; 2018.https://github.com/ChengLiLab/OCEAN-C/. Accessed 30 Mar 2018. 42. Li T., Ji L., Cao Y., Chen Q., and Li C., OCEAN-C: mapping hubs of open
chromatin interactions across the genome reveals gene regulatory networks. Zenodo; 2018.https://doi.org/10.5281/zenodo.1210107. 43. Consortium, E.P.,(Encode Project Consortium). An integrated encyclopedia
of DNA elements in the human genome. Nature. 2012;489:57–74.
• We accept pre-submission inquiries
• Our selector tool helps you to find the most relevant journal
• We provide round the clock customer support
• Convenient online submission
• Thorough peer review
• Inclusion in PubMed and all major indexing services
• Maximum visibility for your research
Submit your manuscript at www.biomedcentral.com/submit