R E S E A R C H
Open Access
Functional assessment of human enhancer
activities using whole-genome
STARR-sequencing
Yuwen Liu
1,2†, Shan Yu
1,2†, Vineet K. Dhiman
1,2†, Tonya Brunetti
1,2, Heather Eckart
2and Kevin P. White
1,2,3*Abstract
Background:Genome-wide quantification of enhancer activity in the human genome has proven to be a challenging problem. Recent efforts have led to the development of powerful tools for enhancer quantification. However, because of genome size and complexity, these tools have yet to be applied to the whole human genome.
Results: In the current study, we use a human prostate cancer cell line, LNCaP as a model to perform whole human genome STARR-seq (WHG-STARR-seq) to reliably obtain an assessment of enhancer activity. This approach builds upon previously developed STARR-seq in the fly genome and CapSTARR-seq techniques in targeted human genomic regions. With an improved library preparation strategy, our approach greatly increases the library complexity per unit of starting material, which makes it feasible and cost-effective to explore the landscape of regulatory activity in the much larger human genome. In addition to our ability to identify active, accessible enhancers located in open chromatin regions, we can also detect sequences with the potential for enhancer activity that are located in inaccessible, closed chromatin regions. When treated with the histone deacetylase inhibitor, Trichostatin A, genes nearby this latter class of enhancers are up-regulated, demonstrating the potential for endogenous functionality of these regulatory elements. Conclusion:WHG-STARR-seq provides an improved approach to current pipelines for analysis of high complexity genomes to gain a better understanding of the intricacies of transcriptional regulation.
Keywords:Enhancers, Regulatory elements, STARR-seq, Non-coding regions
Background
Enhancers are DNA elements that control the temporal and spatial expression of genes and thus are central to biological processes such as development, differentiation, and homeostasis [1]. Enhancers maintain precise control of gene expression by serving as a loading platform to a variety of recruited transcription factors (TFs) and associated co-regulators that regulate productive transcription at core promoters [2, 3]. Recent studies have linked nucleotide variation in enhancer elements to a number of phenotypic changes, including human diseases [4]. As such, characterization of enhancers
under various cellular contexts is of fundamental im-portance to understanding the genetic basis of devel-opment and disease pathogenesis.
Because of this fundamental importance of understand-ing enhancer function, the ENCODE Project and Epige-nome Roadmap Consortiums have invested tremendous efforts into the generation of comprehensive predictive annotations of cis-regulatory elements located in non-coding regions of the genome [5, 6]. These datasets in-clude, but are not limited to, analyses of TF-binding sites, histone modifications, and chromatin accessibility regions in various human tissues and cell types. These data are crucial for the identification of enhancers and for defining the epigenomic landscape in relation to enhancer func-tional impact on the regulatory programs that control development and disease. However, despite improvement on data-driven predictive algorithms in linking enhancers to their respective target genes, a proportionally small number of predictions have been functionally tested for * Correspondence:kpwhite@uchicago.edu
†Equal contributors
1
Institute for Genomics and Systems Biology, University of Chicago and Argonne National Laboratory, Chicago, IL 60637, USA
2Department of Human Genetics, University of Chicago, Chicago, IL 60637,
USA
Full list of author information is available at the end of the article
© The Author(s). 2017Open AccessThis article is distributed under the terms of the Creative Commons Attribution 4.0 International License (http://creativecommons.org/licenses/by/4.0/), which permits unrestricted use, distribution, and reproduction in any medium, provided you give appropriate credit to the original author(s) and the source, provide a link to the Creative Commons license, and indicate if changes were made. The Creative Commons Public Domain Dedication waiver (http://creativecommons.org/publicdomain/zero/1.0/) applies to the data made available in this article, unless otherwise stated. Liuet al. Genome Biology (2017) 18:219
enhancer activity. This lack of genome-wide prediction validation through enhancer functional activity assays can lead to many false-positive predictions [2, 7, 8]. Further-more, these datasets can only identify putative enhancers based on TF and histone chromatin immunoprecipitation (ChIP-seq) data and therefore do not necessarily exhaust-ively define functional enhancers, leading to false nega-tives. With the discovery of thousands of nucleotide variants in these regulatory elements linked to potential phenotypic outcomes, these limitations of the current pre-dictive approaches highlight the importance of obtaining genome-wide functional validations of enhancer activity.
Traditionally, enhancer activity has been quantified using reporter assays under the control of a minimal re-porter to measure the activity of the cloned region of interest. While this method of quantification has proven to be reliable and accurate, until recently it was primar-ily used to serially investigate individual candidate se-quences, making comprehensive assays of large genomes untenable. Recent advances have improved on this tech-nique by developing enhancer reporter assays that com-bine massively parallel assays coupled with cell sorting techniques [9–11], molecular barcode sequencing [12–14], or by coupling the activity of a candidate enhancer to the abundance of its own self-transcribed sequence by placing candidate regions downstream of a core promoter and into the 3’UTR of a reporter gene [15]. The latter method, known as Self-Transcribing Active Regulatory Regions sequencing (STARR-seq), has allowed the assessment of enhancer activ-ity on a genome-wide scale in model organism genomes and in selected regions of the human genome [2, 15–18].
While all of these massively parallel methods have pro-foundly improved on the traditional low-throughput en-hancer reporter assay, they still provide only limited quantitative information and have not been scaled to the whole human genome, at which the ENCODE and Epi-genomics Roadmap consortia have been performed. Scaling STARR-seq to a whole-genome level is a particu-larly promising prospect, as this technique allows active enhancers to transcribe themselves and become part of the resulting reporter signal and thus libraries can be constructed directly from human genomic DNA and do not require any complicated de novo synthesis steps with high error rate. However, there have been major limitations to the application of STARR-seq to the hu-man genome, primarily due to the genome size and complexity of humans compared to Drosophila, where the technique was developed. This higher complexity re-quires more starting material and deeper sequencing depth to achieve a comparable power for detecting and quantifying enhancers in humans and hence demands method development to increase screening library com-plexity, scale up cell transfection, and increase efficiency of NGS library preparation. To date, the only
STARR-seq applications that have been performed in human or other mammalian genomes are BAC-based [15] or capture-based approaches [19]. Unfortunately, these methods can only assay a small subset of predicted human enhancers. A method interrogating the entire human gen-ome for enhancer activity has yet to be reliably developed.
In the current study, we demonstrate whole human genome STARR-seq (WHG-STARR-seq) on the human prostate cancer cell line, LNCaP, to generate the first whole-genome-scale enhancer mapping and activity quantification in human cell lines. We show that this unbiased enhancer screening allows the identification of active enhancers located not only in euchromatic re-gions, but also poised enhancers located in heterochro-matic areas. Consequently, we find that the expression levels of nearby genes to these inaccessible enhancers are significantly lower than those near accessible en-hancers, indicating that the inherent regulatory activity of enhancer elements may be epigenetically silenced by local chromatin structure. We test this hypothesis by treatment with the histone deacetylase inhibitor Trichos-tatin A (TSA), and we find the expression level of genes near previously heterochromatic enhancers to increase significantly. These data indicate that many enhancers have latent activities that can be readily uncovered by altering chromatin accessibility. This functional coordin-ation between enhancer activity and chromatin accessi-bility, along with the existence of inaccessible enhancers, reinforce the idea that sequence-coded enhancer activity and chromatin context serve as two major functional layers that regulate transcription. This interplay is key for the understanding of non-coding variation as it con-tributes to human diseases and may have implications for how chromatin altering drugs might be combined with targeted therapies. WHG-STARR-seq scales the powerful STARR-seq methodology to the human genome and promises to help researchers reliably investigate regulatory element function in high complexity genomes elements.
Results
Generation of WHG-STARR-seq libraries
Fig. 1(See legend on next page.)
[image:3.595.60.537.84.705.2]conditions, data obtained using the SCP1 promoter showed higher complexity than data obtained from miniCMV promoter (Additional file 1: Figure S1A, B). We also observed negligible differences in dynamic range of the assay in these two minimal promoter com-parisons (Additional file 1: Figure S1B, C). Therefore, we decided to utilize the SCP1 promoter, with a similar con-figuration to that used in Arnold et al. [15] (Fig. 1a). Additionally, we developed a screening library generation protocol (see “Methods”) so that the screening libraries used in this study contained at least 158.6 million in-dependent candidate fragments, with average fragment length size of 500 bp (Additional file 1: Figure S2). We were able to uniquely sequence 83.7% of the whole hu-man genome. Of those regions, 74.3% had a sequencing depth of at least ten distinct fragments per nucleotide (Additional file 1: Figure S3). This unprecedented high complexity allows us to directly measure the regulatory activity of the majority of the human genome.
We used the human prostate cancer cell line, LNCaP, to demonstrate the utility of our screening library, due to the ease of handling and high transfection efficiency of LNCaP cells. We generated STARR-seq data from two biological replicates and pooled the replicates together for WHG-STARR-seq analyses, similar to the methods described in previous reports [15]. We identified 94,527 regions that were significantly enriched over the input library (MACS2, q-value < 0.05) (Fig. 1b). The signal of these enriched regions covers a large dynamic range where genes were associated with multiple enhancer regions and the median enhancer activity was 3.08 (Fig. 1c, d). Furthermore, the two biological replicates were highly correlated when comparing read counts and log-transformed read counts (R2= 0.93 and R2=
0.64, respectively; Additional file 1: Figure S5A, B), which is comparable to assay reproducibility of STARR-seq and CapStarr-seq assays. More than 90% of enhancers were either found in intergenic or intronic regions. Enhancers were also found in the 5’UTR and in the 3’UTR of nearby genes (Additional file 1: Figures S6, S7). A more stringent q-value cutoff (q-value < 0.01) only removed a couple hundred candidate peaks from the final analysis (Additional file 1: Figure S8). As such, for all fur-ther analyses, we decided to use a q-value cutoff of 0.05.
In order to validate the function of the active enhancers determined by WHG-STARR-seq, we selected 15 regions for all activity measurements and measured their activity using traditional Renillaluciferase reporter assays. These regions were previously tested for nuclear receptor binding in LNCaP cells in response to various hormone treatments independent of WHG-STARR-seq experiments. As seen in Fig. 1e, we observe a strong correlation (R2= 0.73) between
enhancer activity and luciferase reporter signal, with most of the luciferase validated enhancers also showing strong WHG-STARR-seq enrichment (fold change > 2.0). Conversely, most regions that did not have positive WHG-STARR-seq enrichment did not test positive in the luciferase validation assay. These data demonstrate that the WHG-STARR-seq technique compares reasonably well to traditional luciferase reporter assays.
Active enhancers correlate with both open and closed chromatin regions
Studies investigating transcriptional networks and regu-latory elements tend to focus on euchromatic regions of the genome that allow access for TF and co-regulatory binding. However, because WHG-STARR-seq utilizes episomal reporter constructs, it allows the user to eva-luate the potential of regulatory elements across the gen-ome independent of their chromatin context. For example, of the six active WHG-STARR-seq enhancers validated by luciferase experiments, four correspond to open chromatin regions in LNCaP cells and two corres-pond to closed chromatin regions (Additional file 2: Table S1). This unbiased evaluation of enhancer activity potential provides the ability to investigate all regulatory elements and to uncover even deeper layers of transcrip-tional regulation that might become available under cer-tain cellular or environmental conditions. To our surprise, only 12.7% (11,980) of the 94,527 active en-hancers overlap with at least one of the 143,756 DNase I sites in the same cellular context, and thus were located in open chromatin regions (Additional file 1: Figure S9). The enhancers in open chromatin regions (active and open enhancers) are associated with active chromatin marks including H3K4me1, H3K4me2, and H3K27Ac (Fig. 2a, b, Additional file 1: Figure S10A). In addition, open chromatin regions with WHG-STARR-seq signal (See figure on previous page.)
Fig. 2(See legend on next page.)
[image:5.595.56.542.85.701.2]are observed to be more conserved than open chromatin regions without detectable WHG-STARR-seq signal (Additional file 1: Figure S11). The repressed chromatin mark H3K27me3 is depleted around active and open en-hancers (Fig. 2a, b). Genes nearby these active enen-hancers in open chromatin display a positive correlation between enhancer activity and expression (Fig. 2c). Gene ontol-ogy (GO) term analysis of the top 2000 open active en-hancers revealed genes enriched for house-keeping functions that include gene transcription, protein transla-tion, and metabolic processes (Additional file 3: Table S2).
By contrast, the active regulatory elements identified by WHG-STARR-seq that are located in closed chroma-tin regions (active and closed enhancers) are not associ-ated with DNase I signal, H3K4me2, or H3K27Ac marks (Fig. 2a, b, Additional file 1: Figure S10B), classifying them as having active potential, yet inaccessible in their native chromatin state. These regions do show weak but notable enrichment for H3K4me1 (Fig. 2a, b, Add-itional file 1: Figure S10B), consistent with previous stud-ies that show H3K4me1 marks can be associated with enhancers regardless of their endogenous chromatin context [7, 22, 23]. These closed chromatin enhancers also show weak enrichment for H3K27me3 (Fig. 2a, b), indicating that some of these regulatory elements might be under the control of polycomb-mediated repression. For the closed chromatin enhancers, low presence of H3K4me1 may be indicative of poised enhancers, sug-gesting that these enhancers might be one stimuli away from active transcriptional regulation [24]. In further support of their inaccessibility, these closed chromatin regions do not show any correlation between enhancer activity and nearby gene expression level in LNCaP cells (Fig. 2c). Additionally, the conservation scores of closed, active enhancers that are opened in other ENCODE cells are higher than closed active enhancers that are closed in all ENCODE cell types (Additional file 1: Figure S12). Interestingly, the WHG-STARR-seq signal between ac-cessible enhancers compared to inacac-cessible enhancers are similar to one another (Fig. 2a). In contrast to en-hancers located in open chromatin regions, GO term
analyses for nearby genes of enhancers located in closed chromatin revealed genes enriched for regulation various developmental processes (Additional file 3: Table S2). Motif enrichment analysis using HOMER [25] revealed that these enhancers are enriched for transcription fac-tor binding sites such as FOXA1, NKX3.1, and STAT3 (Additional file 4: Table S3). Taken together, these results indicate that the vast majority of enhancers in the hu-man genome are in epigenetically poised or silent states, but maintain regulatory potential.
Closed chromatin enhancers drive nearby gene expression upon TSA treatment
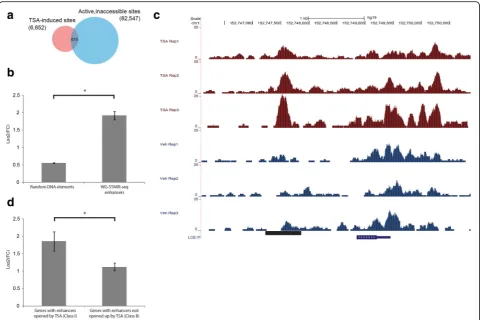
To determine whether the active, inaccessible enhancers are able to regulate nearby gene expression upon a change in the endogenous chromatin environment, we treated LNCaP cells with TSA for 24 h. TSA is a histone deacetylase inhibitor (HDAC) that leads to an accumula-tion of acetylated histone, resulting in a relaxed chroma-tin environment. Following treatment with TSA, we performed assay for transposase accessible chromatin se-quencing (ATAC-seq) and messenger RNA-sese-quencing (mRNA-seq) experiments to measure the genome-wide chromatic accessibility and gene expression levels, re-spectively. We identified 6652 sites (EdgeR [26], q-value < 0.05) with an observed increase in chromatin accessi-bility as compared to vehicle (we define these regions as TSA-induced sites hereafter). In inaccessible chromatin regions in the vehicle condition, there are 82,547 active, WHG-STARR-seq enhancers, among which 615 of these regions overlapped with the TSA-induced sites (Fig. 3a). By comparison, there are 2648 TSA-induced sites in closed chromatin regions without WHG-STARR-seq ac-tivity. Given that only ~ 3% of the closed chromatin re-gions have WHG-STARR-seq activity, there is a highly significant enrichment for active WHG-STARR-seq en-hancers in regions with TSA-induced accessibility (p value = 7.4e-293). We assigned the 615 active, inaccess-ible enhancers with TSA-induced chromatin accessibility to their nearest genes and, as such, we found that 401 genes have at least one such enhancer. The expression (See figure on previous page.)
level of these 401 genes are significantly higher when compared to all other genes across the genome (Fig. 3b). An example of this phenomenon can be seen with an enhancer region approximately 3-kb upstream of the LCE1F gene where, upon TSA treatment, there is a marked increase in chromatin accessibility in all three biological replicates (Fig. 3c).
To further statistically validate these experimental findings, we identified two different classes of genes. The first class (Class I) includes 59 genes that have nearby active, inaccessible enhancers (as defined by WHG-STARR-seq) opened up by TSA within 50 kb of their respective translational start sites. These genes also do not contain any nearby regulatory elements whose accessibility is decreased upon TSA treatment. The sec-ond class (Class II) of genes include 371 candidates that were selected with the same criteria, with the exception of being located nearby (within 50 kb) inaccessible DNA elements that were not identified by WHG-STARR-seq,
but still opened up upon TSA treatment. Using a stand-ard Wilcoxon statistical test, we find that the expression levels of genes in Class I are significantly higher than the expression of genes in Class II (p< 0.013) (Fig. 3d). Col-lectively, these results indicate that the closed chromatin enhancers identified by WHG-STARR-seq can become functional regulatory elements when their chromatin context assumes a more transcriptionally permissive environment.
Interplay of chromatin context and enhancer strength in regulating nearby genes
Based on the above results, we wanted to further inves-tigate the relationship between chromatin context, en-hancer strength, and nearby gene expression. While WHG-STARR-seq quantifies the inherent regulatory potential of enhancer elements, DNase-seq measures the accessibility of DNA elements to trans-acting factors such as TFs. As such, we wanted to integrate these two features Fig. 3Inaccessible enhancers are functional upon treatment with TSA.aVenn diagramshowing the overlap between active, inaccessible WHG-STARR-seq enhancers and TSA-induced sites.bComparison of gene expression in response to TSA treatment of global genes and the 401 genes that have nearby WHG-STARR-seq enhancers which were inaccessible under vehicle treatment but became accessible under TSA treatment. Statistical significance was calculated using Wilcox Sum Rank Test (*p= 2.2e-16).cGenomic snapshot displaying ATAC-seq signal atLCE1F locus of LNCaP cells treated with TSA vs vehicle.dComparison of nearby gene expression in response to TSA treatment of WHG-STARR-seq enhancers that were previously inaccessible, but opened up by TSA treatment (Class I) and regions not active in WHG-STARR-seq and opened up by TSA (Class II). Statistical significance was calculated by Wilcoxon sum rank test (*p= 1.6e-2)
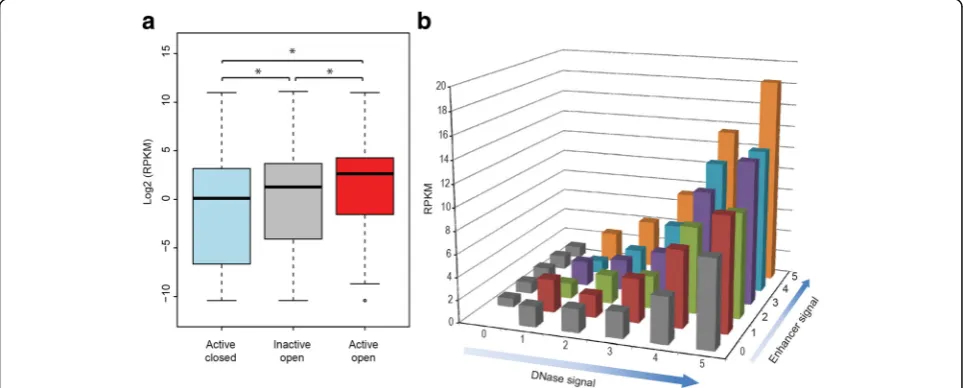
[image:7.595.58.542.87.407.2]to obtain a genome-wide assessment of their effects on gene expression levels. We first analyzed expression levels for genes nearby enhancers of varying activity and chro-matin accessibility. Expression of genes near sequences located within closed chromatin, but that showed WHG-STARR-seq activity, was lower than the expression of genes near DNase I hypersensitivity sites that did not show WHG-STARR-seq enhancer activity (inactive and open sites) (Fig. 4a). This may be due to recalcitrance of some cis-regulatory elements in open chromatin regions to individual testing for functionality by reporter assay-based WHG-STARR-seq, or these elements may not cor-respond to enhancers but rather have other biological functions. As expected, we find the highest expression of genes nearby open chromatin enhancers identified by WHG-STARR-seq.
To obtain a more quantitative view of the relationship among WHG-STARR-seq enhancer activity, chromatin state, and gene expression, we categorized all active and accessible enhancers into 36 separate groups (ranked 0– 5), based on their levels of DNase I signal and enhancer activity (Fig. 4b). Overall, we found that the average gene expression level of genes nearby these enhancers in-creases as one of the variables (DNase I signal or enhan-cer activity) stays fixed. Additionally, these two variables appear to act together such that higher enhancer signal and higher DNase I signal corresponded to genes with higher gene expression levels. Noticeably, enhancers with strong WHG-STARR-seq activity and weak DNase-seq signal were associated with lower gene expression levels than enhancers with weak WHG-STARR-seq
activity and strong DNase-seq signal. This observation may reflect false negatives from the WHG-STARR-seq assay, high levels of basal promoter activity in some genes, or a combination of these factors. Overall these data indicate that the enhancers we validated with WHG-STARR-seq are indeed biologically relevant and are quantitatively predictive of gene expression output when coupled with chromatin state data.
Discussion
In the current study, we improve on current enhancer profiling methods to develop WHG-STARR-seq, a tech-nique that allows for the genome-wide, quantitative assessment of regulatory elements in large and high complexity genomes. This method allows for an un-biased analysis of the entire genome. Whereas previous methods were able to detect enhancers on the order of thousands in the human genome, WHG-STARR-seq is able to detect activity of tens of thousands of enhancers.
STARR-seq assays provide a complementary approach to orthogonal enhancer discovery methods. For example, a recent study by Inoue et al., observed substantial dif-ferences in chromosomal integrated libraries vs episomal libraries [27]. While integrated libraries do well in iden-tifying endogenously active enhancers in a given cell or tissue type, our data in this study indicate that the de-tected enhancers from our episomal library are endogen-ously located in closed chromatin regions, accessible in other ENCODE cell lines and have biological relevance based on the sets of genes which reside nearby and the transcription factor binding sites enriched within them.
[image:8.595.57.539.478.672.2]Another complementary approach involves CRISPR screening, which has recently been shown to be effective for enhancer discovery [28, 29, 30] based on phenotypic readouts such as cell proliferation or survival to detect in-teresting regions for further interrogation. Such CRISPR mutational experiments demonstrate the necessity of spe-cific genomic elements for enhancer activity, while STARR-seq demonstrates sufficiency as well as providing direct quantitative readout of enhancer activity.
Overall, we reproducibly detected 94,527 active en-hancers in LNCaP cells. Surprisingly, the vast majority (87.3%) of active enhancers were found in closed chro-matin regions. It has been suggested that the large size and complexity of the human genome, compared to or-ganisms with substantially more compact genomes like Drosophila, corresponds to also to higher complexity of gene regulation [31]. Consistent with this idea, the frac-tion of enhancers mapped to closed chromatin regions in our data is about twofold of that in Drosophila STARR-seq data. Forty-one percent of these regions with WHG-STARR-seq activity, but endogenously within closed chromatin in LNCaP cells, reside in open chro-matin regions of at least one other ENCODE cell type. Interestingly, the genes nearby these enhancers were enriched for organ developmental processes. These en-richment patterns provide biological relevance to this group of“poised” enhancers identified by WHG-STARR-seq. We hypothesize that these regions may likely play im-portant roles in early organ development and afterwards become epigenetically silenced by histone modifications and/or chromatin remodeling. Thus, WHG-STARR-seq has the unique potential to identify hidden enhancers that, when exposed to trans-cellular environments, might act as pluripotent master regulators to reverse developmental processes. By comparison, we did find active WHG-STARR-Seq enhancers that are within closed chromatin for all ENCODE cell types. Near such enhancers, GO term analysis shows no biological process enrichment (data not shown). These enhancers also show low evolutionary con-servation scores. Therefore, there is poor evidence sup-porting possible functional roles for active STARR-seq enhancers that are epigenetically silenced in all ENCODE cell types, but they might still affect biological processes when chromatin accessibility is artificially changed.
Furthermore, addition of a molecule (TSA) that causes the modification of a subset of chromatin marks in the genome revealed that many of these closed chromatin en-hancers became endogenously functional and nearby genes increased in expression. This response to TSA clearly shows the interplay between chromatin structure and in-trinsic enhancer activity in regulating transcriptional dy-namics. Additionally, these observations illustrate limitations in methods and analyses that focus on using DNase I profiles and other chromatin mark datasets to
predict and/or pre-select enhancer elements for func-tional characterization. Cellular environments in vivo can vary dramatically in response to a vast variety of variables including growth factors, cytokines, hor-mones, cell–cell contact, and physical or environmen-tal challenges. Such variation in cellular environment may alter chromatin state, as demonstrated by the TSA experiments we performed to target histone modification enzymes. These results underscore that predictive methods that rely on chromatin state pro-filing for predicting enhancers genome-wide in the ENCODE and related projects are likely limited by the conditions under which cells are cultured.
Conclusions
While STARR-seq has efficiently covered enhancer activ-ity in flies [15] and CapStarr-seq improved on existing methods for the detection of a subset of active en-hancers in the mouse genome [19], we have been able to successfully modify and extend this enhancer profiling approach to the entire human genome. WHG-STARR-seq promises to provide an unprecedented amount gen-ome coverage for assessment of regulatory elements and transcriptional programs in many diverse human cellular systems, and in response to multiple cellular conditions.
Methods Cell culture
LNCaP cells were maintained in RMPI 1640 media (ThermoFisher Scientific), 10% FBS (Gemini) and 1.0% penicillin/streptomycin (ThermoFisher Scientific).
Generation of input plasmid library
Generation of plasmid libraries was based on the method described by Arnold et al. [15]. Briefly, human genomic DNA (Promega) was sheared by sonication (Covaris S2) and size-selected on 1% agarose gel (350– 650 bp). Size-selected DNA fragments were ligated to adaptors (sense: 5’-ACACTCTTTCCCTACACGACGCT CTTCCGATCT-3’; antisense: 5’-GATCGGAAGAGCAC ACGTCT-3’) and polymerase chain reaction (PCR) amp-lified using Q5 High-Fidelity DNA polymerase (NEB) to add homology arms for cloning (forward primer: 5’-G TAATAATTCTAGAGTCGGGGCGGGAATGATACGG CGACCACCGAGATCTACACTCTTTCCCTACACGA CGCTCTTCCGATCT-3’; reverse primer: 5’- TATCATG TCTGCTCGAAGCGGCATAGTGACTGGAGTTCAG ACGTGTGCTCTTCCGATCT-3’; PCR program: 98 °C for 30 s; 12 cycles of 98 °C for 10 s, 65 °C for 30 s, and 72 °C for 30 s). The vector backbone was modified from pGL4.23[luc2/minP] (Promega). Briefly, minP promoter was replaced with SCP1 promoter and a CmR-ccdB cas-sette was cloned between luc2 ORF and SV40 poly (A). The PCR product (homology arms added to DNA
fragments) was introduced into the vector backbone (linearized by SphI and NdeI restriction enzymes) using Gibson Assembly Master Mix (NEB), followed by trans-formations into MegaX DH10B™ T1R electrocompetent cells (ThermoFisher Scientific). A total of 32 Gibson As-sembly and transformations were performed. All trans-formed E. coli cells were pooled to grow in 4 L LBAMP
medium and harvested when Optical Density (OD) reached 1.0. The input plasmid library was extracted using Plasmid Mega Kit (Qiagen) and drop dialyzed be-fore transfection.
Transfection of input plasmid library into LNCaP cells Input plasmid library was electroporated into LNCaP cells using the Nucleofector™platform (Lonza) according to manufacturer’s protocol (1μg DNA/1 million cells). A total of 300 million cells were electroporated in each replicate and two biological replicates were generated. After transfection, cells were plated in phenol red free RPMI 1640 medium (ThermoFisher Scientific) supple-mented with 10% charcoal-stripped FBS (Gemini) and 1.0% penicillin/streptomycin (ThermoFisher Scientific) for 72 h until harvest.
WHG-STARR-seq library preparation
Total RNA was extracted from transfected LNCaP cells using PerfectPure RNA Cultured Cell Kit (5PRIME), and followed by poly (A) tail mRNA isolation using Dyna-beads® Oligo (dT) kit (ThermoFisher Scientific). mRNA was treated with TURBO™DNase (ThermoFisher Scien-tific) and purified by Agencourt RNAClean XP beads (Beckman Coulter). Target-specific first strand comple-mentary DNA (cDNA) synthesis was performed with SuperScript III (ThermoFisher Scientific; 1.5μg mRNA/ reaction) to specifically reverse transcribe WHG-STARR-seq mRNAs (RT primer: 5’- CAAACTCATCA ATGTATCTTATCATG-3’). All mRNA from the 150 million transfected cells was used in reverse transcrip-tion. After reverse transcription, reactions were treated with RNase A + H and pooled. In the final PCR amplifi-cation, every 5μL cDNA reaction was used as a template in every 50μL PCR reaction using Q5 High-Fidelity DNA polymerase (NEB) using the following program: 98 °C for 30s; 20 cycles of 98 °C for 10 secs, 65 °C for 30 secs and 72 °C for 30 secs. Illumina HiSeq platform compatible primers were used (forward: 5’- AATGATACGGCGACC ACCGAGATCTACACTCTTTCCCTACACGACGCTCT TCCGATCT-3’; reverse: 5’-CAAGCAGAAGACGGCA
TACGAGAT-index-GTGACTGGAGTTCAGACGTG-3’).
For each replicate, we set up separate final PCR reactions using 16 different indexing primers. A total of 20 dupli-cated PCR reactions were performed for each indexing PCR. PCR products were cleaned up by AmPure XP beads (Beckman Coulter; beads/reaction ratio = 0.8) and
submitted fro Illumina sequencing. Input library for se-quencing was generated using similar PCR setup. Prod-ucts from 12 duplicated PCR reactions were pooled (10 ng plasmid/reaction, ten cycles of PCR).
STARR-seq consists of two parts of data with different types of readouts. The input library is generated by dir-ectly amplifying inserts from the plasmid DNA used for cell transfection, served as reference of the original rep-resentation of insert fragments in starting plasmid pool. The output library measures the abundance of self-transcribed mRNA from insert fragments of the trans-fected plasmid pool.
Luciferase reporter assay
The vector backbone for the reporter assay used the in-put plasmid library backbone without a CmR-ccdB cas-sette. Candidate regions were PCR amplified from human genomic DNA (Promega) and cloned into the vector through Gibson Assembly reactions (vector line-arized by KpnI and NheI restriction enzymes). Reporter plasmids were co-transfected with luciferase control vec-tor pRL-CMV (Promega) into cells with Lipofectamine® 2000 (ThermoFisher Scientific) following the manu-facturer’s protocol (1.0 × 10⁵ cells/replicate, three repli-cates/testing region). After transfection, cells were seeded in 24-well plates in phenol red free RPMI 1640 medium (ThermoFisher Scientific) supplemented with 10% charcoal-stripped FBS (Gemini) and 1% penicillin/strepto-mycin (ThermoFisher Scientific). Dual luciferase assays (Promega) were performed at 72 h post transfection fol-lowing manufacturer’s protocol.
Trichostatin A treatment
Seeded in six-well plates were 1.0 × 10⁵cells per well in phenol red free RPMI 1640 medium (ThermoFisher Sci-entific) supplemented with 10% charcoal-stripped FBS (Gemini) and 1% penicillin/streptomycin (ThermoFisher Scientific) for 72 h before treatment. Cells were treated with either 100 ng/mL TSA (Sigma Aldrich) or DMSO vehicle for 24 h before harvest to achieve three bio-logical replicates.
ATAC-seq and RNA-seq library preparation
ATAC-seq was performed as previously described [32]. Nuclei from 50,000 TSA/DMSO treated cells were freshly extracted and incubated with Tn5 transposase (Illumina). Transposed DNA was extracted from nuclei and PCR amplified using NEBNext High-Fidelity DNA polymerase (NEB) and customized Nextera PCR primers.
manufacturer’s protocol (1 μg total RNA was used as initial material).
Enhancer peak calling
Paired-end sequencing reads (2 × 100 bp) from Illumina Hiseq2000 were aligned to human genome hg19 by bow-tie. Reads that are mapped to more than one location to the genome were filtered out. To exclude potential PCR amplification bias, fragments (inferred from paired-end reads) that have the same start and end positions were collapsed into distinct fragments by Picard (http://broad-institute.github.io/picard/). Uniquely mapped distinct fragments from the 16 different indexing libraries were pooled and all included for downstream analysis, since duplicated fragments coming from different indexing li-braries are considered as biological duplicates. To iden-tify enhancers, we combined data from two biological replicates and called enhancer peaks by MACS2 (default setting, q-value < 0.05) [33]. An enhancer peak is called when there is significant enrichment of fragments from one region in output library than the representation of that region in input library based on Poisson distribution using MACS2 (false discovery rate < 0.05). The genome coverage of the plasmid library was used as input when calculating the enrichment of STARR-seq reads. We took the enrichment score reported by MACS2 as enhancer ac-tivity. Enhancer activity for a given peak was calculated as (number of distinct fragments in peak region in output li-brary scaled by lili-brary size)/(number of distinct fragments in peak region in input library scaled by library size).
Addressing duplicate fragments
Since it is difficult to dissect biological duplicates from PCR/sequencing duplicates in the sequencing reads and using total reads may inappropriately inflate statistical power in peak detection leading to false positives, we decided to use distinct fragments for peak calling and downstream analyses, similar to previous studies [15, 19]. However, it is likely that some highly active enhancers are underestimated. To increase peak calling sensitivity with-out introducing PCR/sequencing artifacts, we modified the library preparation protocol and data processing pipe-line of the original STARR-seq paper. For each replicate of output library, we set up separate final PCR reactions using 16 different indexing primers and submitted for Illu-mina sequencing. We aligned reads to human genome and extracted uniquely mapped distinct fragments from the sequencing data of the 16 different indexing libraries, separately. Then we pooled all distinct mapped fragments from the 16 libraries and used all pooled fragments for downstream peak calling and analyses. Duplicated frag-ments coming from different indexing libraries could be justified as biological duplicates, which should be all
included for analysis. Though an optimal solution is needed to barcode each single cDNA molecule in order to get unbiased estimation, we have increased the power from the original paper.
Comparing enhancer activity with histone marks, DNase I signal, and gene expression data
To compare whole-genome STARR-seq enhancer signals with other epigenomics features, we gathered raw se-quencing data for H3K4Me2 (GSE43720), H3K27Me3 (GSE62497), H3K27Ac (GSE51621), DNase I (GSE32970), and chromatin input (GSE62497, GSE51621) in LNCaP cells under vehicle-treated conditions. We combined the datasets for each epigenomics feature together and mapped the reads to human genome hg19 by Bowtie [34], filtered out reads that have multiple alignment, and col-lapsed reads with the same genomic start and end sites. We used DNase I peaks called through the ENCODE pipeline (GSE32970) to characterize chromatin accessibil-ity in LNCaP cells under vehicle condition. Active STARR-Seq enhancers that overlap with open chromatin peaks are defined as open active enhancers and those that do not overlap are defined as closed active enhancers. In order to study the association of epigenomics marks with enhancer activity, we aligned enhancers within each of these two classes based on their centers and extended 10 kb to both directions. Reads from each feature were nor-malized to the same 50-M sequencing depth. We then cal-culated the mean enrichment of epigenomics reads over input reads (reads from each feature were first normalized to the same 50-M sequencing depth) in each 100-bp non-overlapping window spanning 20 kb around the centers of enhancers. Enhancers were assigned to their nearest genes by Homer [25] when comparing enhancer activity with gene expression.
Processing of mRNA-seq data
Single-end reads of 50 bp from Illumina Hiseq2000 were mapped to the human genome hg19 by Tophat [35]. Reads were intersected with gene annotations from Refseq and RPKM values were calculated as estimates of gene expression levels. To study the transcriptional re-sponses after TSA treatment, we first counted reads for each gene under each condition and then used EdgeR [26] (GLM tagwise dispersion used, q-value < 0.05) to identify genes that were differentially regulated compar-ing TSA to vehicle. All mRNA-seq experiments were performed with three biological replicates.
Processing of ATAC-seq data
Paired-end reads (2 × 50 bp) were sequenced by Illumina Hiseq2000. Because of the existence of adaptor se-quences in library molecules generated by ATAC-seq in-sertion events within 50 bp, we used Bowtie and
Bowtie2 [36] for each library to do a two-round align-ment to the hg19 human genome. In the first round, Bowtie was used and only uniquely mappable reads were kept and unmappable reads were gathered as the input for the second round. In the second round, after removing adaptor sequences by Cutadapt [37] (CTGTCTCTTATA-CACATCTCCGAGCCCACGAGACNNNNNNNNATCT CGTA in Read 1, CTGTCTCTTATACACATCTGACGC TGCCGACGAGTGTAGATCTCGGTGGT in Read 2), Bowtie2 was used for alignment and uniquely mappable reads were retained. We used Bowtie2 in the second round because Bowtie was not able to map pairs of reads that are complementary to each other, which arose from two adjacent ATAC-seq insertion events within 50 bp. Subsequently, we removed potential PCR duplicates by running Picard. We then adjusted the read start sites to represent the center of transposon binding event. All uniquely mappable reads aligning to the plus strand were offset by + 4 bp and those aligning to the minus strand were offset by−5 bp.
To identify TSA-induced chromatin accessibility change, we first used Fseq [38] at default parameters (http://fureylab.web.unc.edu/software/fseq/) to call peaks in both vehicle condition and TSA treatment. We then merged peaks across conditions and counted the ATAC-seq reads number for each peak in each condition. Gen-omic regions showing differential accessibility after TSA treatment were called by EdgeR (we treated each region as if it was a gene, GLM tagwise dispersion used, q-value < 0.05). Three biological replicates were collected for each condition. We then overlapped closed active hancers to TSA-induced sites to find closed, active en-hancers that are opened up by TSA treatment.
Additional files
Additional file 1:Supplemental figures. (PDF 10391 kb)
Additional file 2: Table S1.Genomic coordinates and chromatin environment of the 15 regions validated by luciferase assay. (XLSX 43 kb)
Additional file 3: Table S2.GO term analysis of the top 2000 active open enhancers and the top 2000 active closed enhancers. (XLSX 37 kb)
Additional file 4: Table S3.Motif enrichment analysis of WHG-STARR-seq enhancers. (XLSX 24 kb)
Acknowledgements
We kindly thank Alexander Stark for providing the SCP1 promoter.
Funding
This work was supported in part by the NIH/NHGRI ENCODE III grant (U54HG006996).
Availability of data and materials
All data files are available at Gene Expression Omnibus (GEO under the accession number: GSE82204 [39]. https://www.ncbi.nlm.nih.gov/geo/query/ acc.cgi?acc=GSE82204
Authors’Contributions
YL, SY, and KPW conceived and designed the project. YL, SY, and HE conducted WHG-STARR-seq experiments. VKD and SY performed TSA experiments. YL and TB performed peak calling on WHG-STARR-seq datasets. YL performed the computational analysis on sequencing datasets. SY performed the motif analysis. VKD, YL, SY, and KPW wrote the manuscript. All authors read and approved the final manuscript.
Ethics approval and consent to participate
Not applicable in this study.
Competing interests
The authors declare that they have no competing interests.
Publisher’s Note
Springer Nature remains neutral with regard to jurisdictional claims in published maps and institutional affiliations.
Author details 1
Institute for Genomics and Systems Biology, University of Chicago and Argonne National Laboratory, Chicago, IL 60637, USA.2Department of
Human Genetics, University of Chicago, Chicago, IL 60637, USA.3Tempus Labs, 600 West Chicago Ave., Chicago, IL 60654, USA.
Received: 23 November 2016 Accepted: 11 October 2017
References
1. Buecker C, Wysocka J. Enhancers as information integration hubs in development: lessons from genomics. Trends Genet. 2012;28:276–84. 2. Muerdter F, Boryn LM, Arnold CD. STARR-seq - principles and applications.
Genomics. 2015;106:145–50.
3. Yanez-Cuna JO, Kvon EZ, Stark A. Deciphering the transcriptional cis-regulatory code. Trends Genet. 2013;29:11–22.
4. Inoue F, Ahituv N. Decoding enhancers using massively parallel reporter assays. Genomics. 2015;106:159–64.
5. Roadmap Epigenomics Consortium, Kundaje A, Meuleman W, Ernst J, Bilenky M, Yen A, et al. Integrative analysis of 111 reference human epigenomes. Nature. 2015;518:317–30.
6. ENCODE Project Consortium. An integrated encyclopedia of DNA elements in the human genome. Nature. 2012;489:57–74.
7. Shlyueva D, Stampfel G, Stark A. Transcriptional enhancers: from properties to genome-wide predictions. Nat Rev Genet. 2014;15:272–86.
8. Kwasnieski JC, Fiore C, Chaudhari HG, Cohen BA. High-throughput functional testing of ENCODE segmentation predictions. Genome Res. 2014;24:1595–602. 9. Gisselbrecht SS, Barrera LA, Porsch M, Aboukhalil A, Estep 3rd PW, Vedenko A, et al. Highly parallel assays of tissue-specific enhancers in whole Drosophila embryos. Nat Methods. 2013;10:774–80.
10. Dickel DE, Zhu Y, Nord AS, Wylie JN, Akiyama JA, Afzal V, et al. Function-based identification of mammalian enhancers using site-specific integration. Nat Methods. 2014;11:566–71.
11. Murtha M, Tokcaer-Keskin Z, Tang Z, Strino F, Chen X, Wang Y, et al. FIREWACh: high-throughput functional detection of transcriptional regulatory modules in mammalian cells. Nat Methods. 2014;11:559–65.
12. Patwardhan RP, Hiatt JB, Witten DM, Kim MJ, Smith RP, May D, et al. Massively parallel functional dissection of mammalian enhancers in vivo. Nat Biotechnol. 2012;30:265–70.
13. Smith RP, Taher L, Patwardhan RP, Kim MJ, Inoue F, Shendure J, et al. Massively parallel decoding of mammalian regulatory sequences supports a flexible organizational model. Nat Genet. 2013;45:1021–8.
14. Kheradpour P, Ernst J, Melnikov A, Rogov P, Wang L, Zhang X, et al. Systematic dissection of regulatory motifs in 2000 predicted human enhancers using a massively parallel reporter assay. Genome Res. 2013;23:800–11.
15. Arnold CD, Gerlach D, Stelzer C, Boryn LM, Rath M, Stark A. Genome-wide quantitative enhancer activity maps identified by STARR-seq. Science. 2013;339:1074–7.
17. Zabidi MA, Arnold CD, Schernhuber K, Pagani M, Rath M, Frank O, et al. Enhancer-core-promoter specificity separates developmental and housekeeping gene regulation. Nature. 2015;518:556–9.
18. Arnold CD, Gerlach D, Spies D, Matts JA, Sytnikova YA, Pagani M, et al. Quantitative genome-wide enhancer activity maps for five Drosophila species show functional enhancer conservation and turnover during cis-regulatory evolution. Nat Genet. 2014;46:685–92.
19. Vanhille L, Griffon A, Maqbool MA, Zacarias-Cabeza J, Dao LT, Fernandez N, et al. High-throughput and quantitative assessment of enhancer activity in mammals by CapStarr-seq. Nat Commun. 2015;6:6905.
20. Liu Y. Nuclear receptor-mediated transcriptional regulation in prostate cancer cells. Proquest Dissertations Publishing; 2014. 3628087 21. Zhou J. Functional genomic analysis of nuclear receptors in MCF7 cells.
Proquest DissertationsPublishing; 2014. 3627912.
22. Bernstein BE, Mikkelsen TS, Xie X, Kamal M, Huebert DJ, Cuff J, et al. A bivalent chromatin structure marks key developmental genes in embryonic stem cells. Cell. 2006;125:315–26.
23. Rada-Iglesias A, Bajpai R, Swigut T, Brugmann SA, Flynn RA, Wysocka J. A unique chromatin signature uncovers early developmental enhancers in humans. Nature. 2011;470:279–83.
24. Heinz S, Romanoski CE, Benner C, Glass CK. The selection and function of cell type-specific enhancers. Nat Rev Mol Cell Biol. 2015;16:144–54. 25. Heinz S, Benner C, Spann N, Bertolino E, Lin YC, Laslo P, et al. Simple combinations
of lineage-determining transcription factors prime cis-regulatory elements required for macrophage and B cell identities. Mol Cell. 2010;38:576–89.
26. Robinson MD, McCarthy DJ, Smyth GK. edgeR: a Bioconductor package for differential expression analysis of digital gene expression data. Bioinformatics. 2010;26:139–40.
27. Inoue F, Kircher M, Martin B, Cooper GM, Witten DM, McManus MT, et al. A systematic comparison reveals substantial differences in chromosomal versus episomal encoding of enhancer activity. Genome Res. 2017;27:38–52. 28. Sanjana NE, Wright J, Zheng K, Shalem O, Fontanillas P, Joung J, et al. High-resolution interrogation of functional elements in the noncoding genome. Science. 2016;353:1545–9.
29. Fulco CP, Munschauer M, Anyoha R, Munson G, Grossman SR, Perez EM, et al. Systematic mapping of functional enhancer-promoter connections with CRISPR interference. Science. 2016;354:769–73.
30. Diao Y, Fang R, Li B, Meng Z, Yu J, Qiu Y, et al. A tiling-deletion-based genetic screen for cis-regulatory element identification in mammalian cells. Nat Methods. 2017;14:629–35.
31. Berg JM, Tymoczko JL, Stryer L. Section 31.2: The greater complexity of eukaryotic genomes requires elaborate mechanisms for gene regulation. In: Biochemistry. 5th ed. New York: W H Freeman; 2002. Available from: https:// www.ncbi.nlm.nih.gov/books/NBK22479/.
32. Buenrostro JD, Giresi PG, Zaba LC, Chang HY, Greenleaf WJ. Transposition of native chromatin for fast and sensitive epigenomic profiling of open chromatin, DNA-binding proteins and nucleosome position. Nat Methods. 2013;10:1213–8.
33. Zhang Y, Liu T, Meyer CA, Eeckhoute J, Johnson DS, Bernstein BE, et al. Model-based analysis of ChIP-Seq (MACS). Genome Biol. 2008;9:R137. 34. Langmead B, Trapnell C, Pop M, Salzberg SL. Ultrafast and memory-efficient
alignment of short DNA sequences to the human genome. Genome Biol. 2009;10:R25.
35. Trapnell C, Roberts A, Goff L, Pertea G, Kim D, Kelley DR, et al. Differential gene and transcript expression analysis of RNA-seq experiments with TopHat and Cufflinks. Nat Protoc. 2012;7:562–78.
36. Langmead B, Salzberg SL. Fast gapped-read alignment with Bowtie 2. Nat Methods. 2012;9:357–9.
37. Martin M. Cutadapt removes adapter sequences from high-throughput sequencing reads. EMBnetjournal. 2011;17:10–2.
38. Boyle AP, Guinney J, Crawford GE, Furey TS. F-Seq: a feature density estimator for high-throughput sequence tags. Bioinformatics. 2008;24:2537–8. 39. Liu Y, Yu S, Dhiman V, Brunetti T, Scott H, White K. Genome-wide functional
assessment of enhancer activities in the human genome. Gene Expression Omnibus. 2017. https://www.ncbi.nlm.nih.gov/geo/query/acc.cgi?acc= GSE82204.
• We accept pre-submission inquiries
• Our selector tool helps you to find the most relevant journal
• We provide round the clock customer support
• Convenient online submission
• Thorough peer review
• Inclusion in PubMed and all major indexing services
• Maximum visibility for your research
Submit your manuscript at www.biomedcentral.com/submit