5
IV
April 2017
Technology (IJRASET)
Analysis of Different Lubricants in Gearbox
Performance using Ansys
Rajput Arvind1, Vatsal Shah2
1
Gujarat Technological University, 2Chandubhai s patel institute of technology(CHARUSAT)
Abstract—In the present paper CFD based investigation has been reported in order to study about the power losses for different gear oils in operating conditions and alternative of it. It has been observed that there is significant change during working condition of gearbox. During working condition heat is generated, when two teeth meshes together. Because of heat generation inside the gearbox, the viscosity of the oil decreases and ultimately there is change in the oil properties. This change in gear oil properties(i.e decrease in gear tooth hardness, oil level and speed of gear and increase in vibration, noise, wear and power loss.) These losses are the sum of squeezing, churning and windage power losses. In order to predict the power losses in the gearbox performance the analysis is done using software ANSYS12 and a general idea about the gearbox model is created using modelling software SOLID WORKS 2012.
Keywords— Gear, Gearbox, Lubricants, CFD, SOLID WORKS, Power Loss.
I. INTRODUCTION
Designing and choosing a gearbox for different industrial application are must to consider some performance specifications. These important specifications for gearbox designing and selection are gear ratio, torque, maximum input power, maximum input rpm, shaft alignment. The gear ratios can be defined as the relationship between the number of teeth on two different gears meshed together, the circumference of two pulleys connected with a drive belt. Torque is a rotational force. It is force multiplied by perpendicular distance. Power in mechanical systems is the combination of forces and moments. In particular, power is the product of a force on an object and the object's velocity, or the product of a torque on a shaft and shaft's angular velocity. A revolution per minute is a measure of the frequency of a rotation. It annotates the number of turns completed in one minute around a fixed axis. It is used as a measure of rotational speed of a mechanical component. The rapid advance made in computer hardware and software led to significant developments in FEA software. FE programming gas emerged as a specialized discipline which requires knowledge and experience in the diverse areas such as FE technology including foundations of machines, and numerical analysis on the one hand and the computational skills in areas of software technology including programming techniques, data structure, database management and computer graphics on the other hand.
II. AIMS
Analysis of heat generation in gearbox using ANSYS[1]
Modelling of gearbox[2]
Analysis of temperature change in gearbox using ANSYS[3] Analysis of power losses in gearbox using ANSYS[4] Analysis of different lubricant in gearbox using ANSYS[5]
III. EXPERIMENT WORK
Technology (IJRASET)
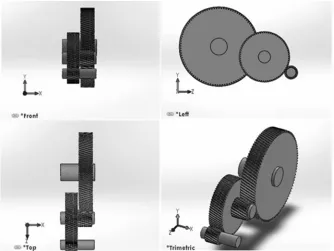
The Gear box model is prepared in solid works 2012 software as per gear specification. Various parts of gearbox and assembly are shown in Fig. 1 to 3.[2]
[image:3.612.164.447.111.241.2][image:3.612.163.449.277.420.2]
Fig. 1 1st stage gears (19th teeth pinion, 77th teeth gear)
Fig. 2 2nd stage gears (20th teeth pinion, 101th teeth gear)
[image:3.612.140.474.453.704.2]Technology (IJRASET)
IV. CFDANALYSIS
CFD can be used to determine the performance of a component at the design stage, or it can be used to analyse difficulties with an existing component and lead to its improved design. For example, the pressure drop through a component may be considered excessive. The first step is to identify the region of interest. The geometry of the region of interest is then defined. If the geometry already exists in CAD, it can be imported directly. The mesh is then created. After importing the mesh into the pre-processor, other elements of the simulation including the boundary conditions (inlets, outlets, etc.) and fluid properties are defined. The flow solver is run to produce a file of results which contain the variation of velocity, pressure and any other variables throughout the region of interest. The results can be visualized and can provide engineer with an understanding of the behaviour of the fluid throughout the region of interest.
A. Prepare Model Gearbox
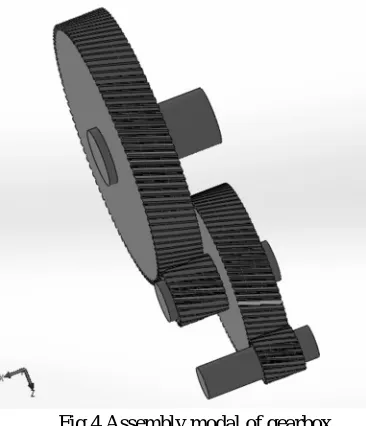
[image:4.612.216.399.246.459.2]The assembly modal of gearbox made in solid works 2012 is converted into STEP file and imported in ANSYS workbench is as shown in fig. 4
Fig.4 Assembly modal of gearbox
B. Meshing
FEA software typically uses a CAD representation of the physical model and breaks it down into small pieces called finite “elements” (think of a 3-D puzzle). This process is called “meshing”. The higher quality of the mesh (collection of elements), is a better mathematical representation of the physical model. ANSYS workbench simulation provides two forms of automated meshing: Fully automatic and manually directed automatic. Both forms employ a fault-tolerant philosophy and it means that, if a problem occurs, at least 12 attempts of automatic trouble-shooting are made before the meshing fails and tags the area of difficulty with a label. The Manual directed means that the user may specify meshing over rides on specific areas of a part or the baseline mesh density on entire parts that differ from other parts within the assembly, either for accuracy or efficiency purposes. Here in current work the fully automatic meshing of gearbox is done. The element chosen for meshing by ANSYS is ten nodes tetrahedral shown in fig.5 . This element is good for meshing in curvature area.[1]
Numbers of nodes and elements used for meshing are listed in table 1 below[2]
Domain Nodes Elements
Gear 5347 23913
Castor oil 23680 124330
All Domains 29027 148243
Technology (IJRASET)
Fig. 5 Meshing modal of gearbox
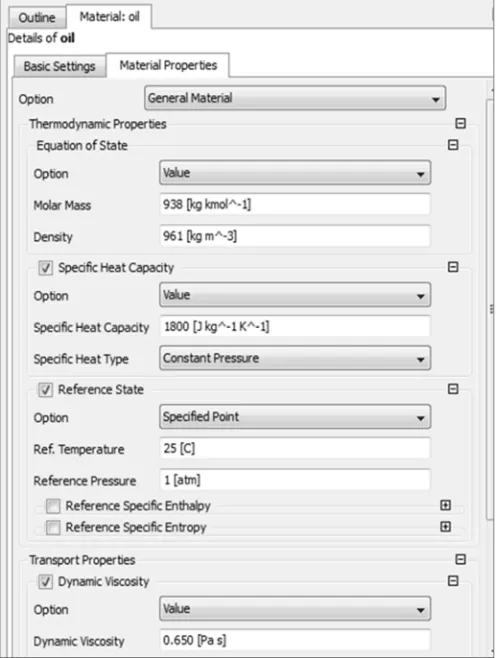
C. Material Property
Materials in the Workbench are imported from material library available in ANSYS database. If the material is not available in material library then it is required to define manually. Here in this experiment, work for doing Computational Fluid Dynamics(CFD) analysis of Castor oil in gear box the property of Castor oil is imported manually as shown in fig 6.
[image:5.612.183.432.370.699.2]Technology (IJRASET)
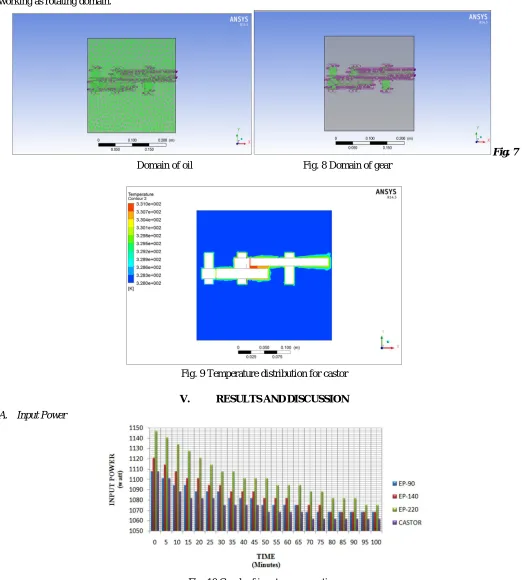
D. Boundary Condition
The boundary condition in Pre processor is very important for getting approximate result nearer to actual condition. In present work the boundary condition is defined as domain in pre processer. The first domain is defined as gear oil and second is a gear. The gear is a rotating domain and speed of rotation is 1450 rpm. This rotation effect of gear domain is transferred to the gear oil so it is also working as rotating domain.
Fig. 7 Domain of oil Fig. 8 Domain of gear
Fig. 9 Temperature distribution for castor
V. RESULTSANDDISCUSSION
[image:6.612.42.564.134.714.2]A. Input Power
Technology (IJRASET)
From the above graph of input power vs. time it is seen that initially the required input power for the gear box is different as different types of the oil. The EP-220 gear oil requires higher initial input power compared to other oil. While EP-90 and Castor oil have required very less initial power. Also from the graph it is seen that the required input power reduces with increase in running time of gear box for all oil. This reduction of the input power with respect to running time of gear box is due to increase in temperature of the gear oil which causes the reduction of the viscosity of the oil.
[image:7.612.124.484.186.345.2]B. Output Power
Fig. 11 Graph of output power vs. time
From the above graph of output power vs. time it is seen that initially the output power for the gear box is different as different types of the oil. The EP-220 and EP-140 gear oil have initially less output power compared to other oil. While the EP-90 and Castor oil have initial very high output power. Also from the graph it is seen that the output power increases with increase in running time of gear box for all oil but after 35 min it becomes same for all oil. The EP-220 oil takes more time compare to other types of oil for reaching maximum power output because its viscosity is very high compared to other oils and that causes churning effect in gear rotation.
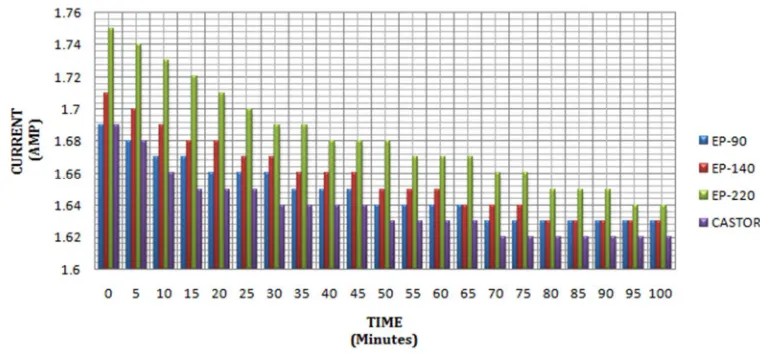
C. Current
Fig. 12 Graph of current vs. time
[image:7.612.115.495.462.641.2]Technology (IJRASET)
time of gear box is due to decrease of viscosity with increase in oil temperature. [image:8.612.105.504.108.275.2]D. Temperature
Fig. 13 Graph of temperature vs. time
From the above graph of temperature vs. time it is seen that the initial temperature for all the gear oil is nearly same. The EP-220 gear oil has higher temperature compared to other oil. While the EP-90 has less temperature compared to other type oil. Also from the graph it is seen that the temperature increases with increase in running time of gear box for all oil. This increasing of temperature with respect to running time of gear box is due to friction between the oil and gear meshing.
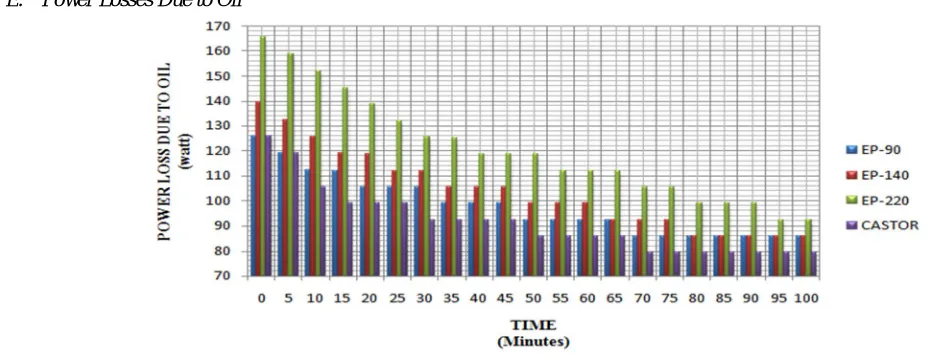
E. Power Losses Due to Oil
Fig. 14 Graph of power loss due to oil vs. time
From the above graph of power loss due to oil vs. time (Fig.14) it is seen that initially the power loss due to oil for the gear box is different as different types of the oil. The EP-220 gear oil has initially higher power loss compared to other oil. While the EP-90 and the Castor oil have very less initial power loss. Also from the graph it is seen that the power loss is decreased with increase in running time of gear box for all oil and Castor oil power loss is less than other type of oils. EP-90 and EP-140 gear oil has same power loss after 80 min. This reduction of the power loss with respect to running time of gear box is due to increase in temperature of the gear oil which causes the reduction of the viscosity of the oil, decrease requirement of initial current, input power and increase output power.
VI. CONCLUSION
The CFD analysis for find out the power losses in gear box due to different gear oil (EP-90, EP-140, EP-220, Castor) is carried out for 100 min. from the experiment it is concluded that:
[image:8.612.38.502.359.538.2]Technology (IJRASET)
time. [1]The output power is increasing with increase of the gear running time but after 35 min it becomes maximum for all the gear oil. The EP-220 has required more time compared to other oil for reaching maximum output power, while the castor oil has required very less time to reach at maximum output power compared to other gear oil.[2]
The temperature of the gear oil is increasing with increase of the gear running time. The EP-220 having high temperature of oil compare to other gear oil, while the EP-90 oil having less temperature compare to other gear oil. [3]
The power loss due to the gear oil decreases with increase in gear running time for all the gear oil. The EP-220 having higher power loss compared to other gear oils, while the castor oil having very less power loss compared to other types of gear oils.[4]
The castor oil is best alternative lubricant in reduction gear boxes for reducing power losses with low cost.[5]
The CFD analysis is very good tool to avoid costliest experiment processes and for finding out temperature of the new gear oil in gear box.[6]
REFERENCES [1] A Report on fan design by Moore, 800 s. Missouri avenue Marceline, Missouri.
[2] A Research report on blades for axial flow fan by Camargo Do, Amaranth Odilon Antonio (Rua Fernandes de Barros, 1455 apto. 07 -200 Curitiba, PR, CEP-80040, BR).
[3] Standards in spur and helical gears with FEM based verification,” ASME Journal of Mechanical Design,Vol 128/114
[4] Machine Design 2 by Prof.K.Gopinath & Prof.M.M.Mayuram Submitted at Indian Institute of Technology Madras [6] CFD solutions for turbo machinery design.