©IJRASET: All Rights are Reserved
2079
Automatic Classification of Transmission Line
Faults Using Probabilistic Neural Network and
Discrete Wavelet Transform
Suhail Khokhar1, Suhail Mustafa2, Adnan Ahmed Arain3, Mohsin Ali Tunio 4
1Electrical Engineering Department, 2Computer System Engineering Department, Quaid-e-Awam University of Engineering, Science & Technology, Nawabshah Pakistan, 3Electrical Engineering Deparmtent, Mehran University of Engineering &
Technology, 4S.Z.A.B. Campus Khairpur Mirs. Pakistan
Abstract: The largest physical length of transmission network is the most critical part of the power system. The fast recognition of faults and events in transmission line has a significant role in order to prevent equipment damage and suddenly collapse of power system. The signal-processing and computational-intelligence based techniques have been proposed in literature for automatic classification of faults and events in transmission network. In this paper, discrete wavelet transform based probabilistic neural network have been proposed for the identification and classification of faults in transmission network. The short circuit faults are created at various fault resistances and fault locations. The wavelet transform is used to extract the features in order to distinguish the type of faults. The probabilistic neural network is used to automatically classify the type of faults. A real-time transmission network is used for simulation of faults. The simulation results show that the proposed algorithm is efficient and reliable for automatic classification of faults in electrical power system.
Keywords: Transmission line faults, discrete wavelet transforms, feature extraction, probabilistic neural network
I. INTRODUCTION
There are various types of faults in transmission lines, occurring due to short circuit, high impedance, transients, harmonics, lightning stroke, flash over, fire, snow and wind. These faults directly affect the power system. For the safety of the power system, it is important to detect and localize these faults accurately and classify them as soon as possible [1]. There are many sources of faults in transmission line. There are two types of load linear loads and non-linear loads. The huge applications of power electronics, semiconductor devices, inverter and AC regulators are the main sources of linear loads due to occurrence of non-linear loads power quality can gradually diminished. Transient are produced due to instantaneous variation in current and voltage. Spike or surges produced in voltage and current which causes disturbance and also the usage of electromagnetic which causes transient when fault occurred spike created so the fault information is included in the transient. Mostly these transient used for the prediction of faults when transient are created the voltage can be swing above or below
High Impedance Fault (HIF) occurs when conductor come in contact with birds, tree, lighting strike or other equipment strike to conductor or two conductor come in contact or conductor fall in ground so the impedance becomes abruptly high so it can’t detected by traditional protection. HIFs occur due to various causes such as humidity, voltage up and down, load condition. HIF harm the whole system and also endanger risk for human safety it is also important to detect these types of faults using algorithm [2].
Transmission line faults which are further classified as A. Single Line-to-Ground faults (SLG)
B. Line-to-Line faults (LL) C. Double Line-to-Ground (LLG) D. Three Phase faults (LLL)
E. Three Phase-to-Ground faults (LLLG)[3]
©IJRASET: All Rights are Reserved
2080
Fourier transform actually break down the signal into smaller frequencies of different sinusoids or break the signal into alternative sine wave or it can transform the signal from frequency base to time base or vice versa. This technique is very beneficial and simplified in nature if the signal is in the static condition. But this technique possess some limitation if we transform the signal from one domain to another domain or from frequency domain to time domain so time information is lost or in other words if the signal is non-stationary or transient it does not inform the accurate location q[11].
Dennis Gabor (1946) presents the idea of Short Time Fourier Transform (STFT) to predict only a small section of the signal at a particular time. To overcome the limitation of Fourier transform STFT prove more attractive and draw a signal into two dimensions of frequency as well as time, this is possible only a small portion of the signal being window. This technique will solve the problem of FT for some specific cases but there is still hurdle. Some of its drawbacks which are listed below, for the time window once you chose the specific size window that window is same for all the frequencies. Also short pulses can only poorly be localized in time with long window, low frequencies can hardly be illustrated with short window these limitations are in time-frequency resolution[12]. Due to all of these complications resulted the innovation of Wavelet Transform (WT) which emerge as a new technique which can solve the difficulties of FT and STFT, wavelet transform allow the use of long time intervals where we need more error-free low frequency data and smaller section where we need high-frequency data [13].
Another emergence technique is wavelet singular entropy (WSE).So finally demerits of all these techniques is that they are all rest on specified measurement and it’s hard to find peak or heavy loading condition [14].
For feature extraction mostly method used are Fourier Transform (FT) and Wavelet Transform (WT). And further these feature extraction carried as input and classified by the most intelligence methods Artificial Neural Network (ANN) and Fuzzy Logic (FL) [15-17].
Exploiting some algorithms which generally well-regarded for fault detection and even we remind nowadays how could we forget ANN which stands fast and accurate and widely express [18-21].. Neuro-Fuzzy systems require massive numbers of training patterns in succeeding a valid relay function. And frequently retraining must be mandatory in different power systems[22]. It must be essential to adopts algorithm which can localize and classify fault in expert’s way. Speed, accuracy, short time must be essential. The rest of the paper is organized as follows. Section 2 describes the wavelet transform and probabilistic neural network. Section 3 discusses the proposed methodology. The results and discussion are provided in section 4. The conclusion of the paper is given in section 5.
II. PROPOSEDMETHODS
A. Transmission Line Model
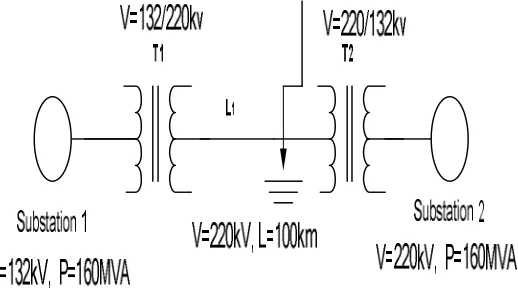
[image:3.612.178.437.555.699.2]The single line diagram of the proposed transmission line is shown in Fig.1. If the fault is occurred in the line, the variations occurred in the current and voltage waveforms. The transients are generated and the fault information is included in the transient component so it is necessary to predict the fault and analyze the reason of faults. It is necessary to detect fault with in short time and accurately. The change in values occurred in those phases in which fault is occurred. The changes may be large according to the type of fault so it will be easier to detect the fault and classify that type of faults. A 220kV, 50Hz and 100km transmission line is proposed. The values of resistance, inductance and capacitance and the values included with positive, negative and zero sequence component.
©IJRASET: All Rights are Reserved
2081
B. Wavelet Transform
Signal mostly exist slowly change in trends or oscillation interrupted with transients. Fourier transform is an important technique for data calculation. Fourier Transform (FT) represents data in the sum of sine and cosine wave or breaking signal in smaller infinite sine wave. If there is stationary signal then FT performing best mostly in power system increasing usage of electronic devices these are the main creator of transient and harmonics. If there is non-stationary signal then in FT if the signal is in frequency domain the time information is lost and vice versa. So it’s better to use those techniques which localize the signal in time and frequency domain accurately so innovation brings to the new topic of Wavelet Transform (WT).A wavelet is a small wave which has zero mean that are located the signal in different time and scale wavelet exhibits in time as well as frequency base. As compared to FT which exist in infinite period wavelet occur for finite period wavelet have many types that have different shapes and sizes some family of wavelet are described here
1) Morlet 2) Daubechies 3) Coiflets 4) Biorthogonal
To pick out the accurate wavelet family you need to look at the application, usage, suitability then carried that family forward. The wavelet equations which are shown as under. Continuous wavelet transform (CWT)
W (a, b) = 1
√a x(t)Ψ
∗ t−b
a dt (1.1)
Where WΨ(a,b) are wavelet coefficients, a and b are scale and translation real parameters. Discrete wavelet transforms (DWT)
W (m, n) = 1
a x(k)(
k−a nb
a ) (1.2)
Where a=a0m, b=a0mnb0, m and n are the integer numbers provided a0˃1 and b0≠0.
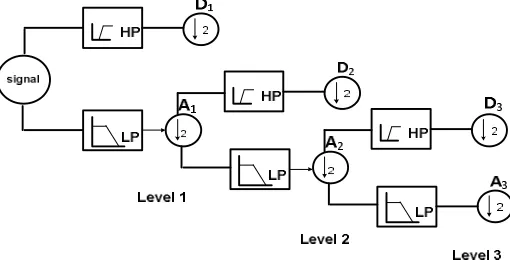
[image:4.612.173.428.510.649.2]Then further we have to be describe the wavelet working principle how wavelet work actually wavelet describe by two coefficients scaling and detail, the coefficient scaling refers to the process of expand or compress the signal with respect to time by using equation, A larger scale factor results in a expanse wavelet which relates to a lower frequency, An expanded or stretched wavelet helps in capturing the little bit altering changes in the signal. A smaller scale factor result in a compressed wavelet which relates to a high frequency and the compressed wavelet helps in catching the sudden alteration. We will build distant scales that inversely corresponds to the equivalent frequency, while shifting means delaying or progressing insert of the wavelet beside, the size of the signal, moved wavelet represent using this sign Ø(t-k) means to shift the wavelet and centered at k, we must shift the wavelet to combine with a feature that are necessary in a signal. Main Transforms in wavelet are Discrete Wavelet Transform (DWT) and Continuous Wavelet Transform (CWT).
Fig. 2 Wavelet transform C. Probabilistic Neural Networks
©IJRASET: All Rights are Reserved
2082
connection among the neurons of the brain, A neuron is the basis processing unit in a neural network, neuron inside the brain are connected through synaptic junction brain consist of 10 billion nerve cells or neurons, each neuron is connected to other neuron through about 10,000 synapses this may be an estimated figure but not an exact figure. The brain can be learnt from experience and also it performs massively parallel computations extremely efficiently for example if there is a huge database the brain work more easily and swiftly than computer or complex visual perception occur within less than 100 milliseconds while computer trying to recollect image it takes a long time, even we have the fast machine like Computers why do we need ANN, lets shed a light to comparison between Brain and Computer.
Table 1 Comparison between Brain and computer Processin
g Elements
Energy Use
Processin g Speed
Learn
Brain 10
14
synapses 30 Watt 100hz
Learn fastly Compute
r
108 transistor
30 Watt
CPU 10
8 hz A little
[image:5.612.182.429.389.520.2]Although it’s clear that computer can solve the problems more speedy like Arithmetic calculation, multiplication, division and many other problems but when we talking about Intelligence operation likewise language understanding, pattern recognition, complex visual perception so once again Brain will solve within mille second and computer either fail or hardly solve these types of problem or take a long time for solving. So the learning process of brain is much faster than computer. Although from all of this discussion we understand some properties of the brain, during the last few centuries, scientists and researchers tried to develop an Artificial Neural Network (ANN) and it is observed that ANN is motivated by some features that exist in the brain, this ANN has three basic elements, nodes, weights and activation function.
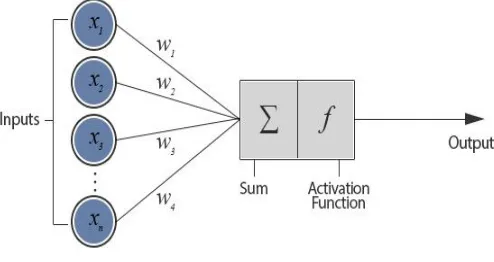
Fig. 3 ANN Activation Function
[image:5.612.183.428.590.705.2]This figure show the input which are x1, x2, x3 up to goes on to xn and which are connected through weight w1,w2,w3, and wn and these weights are multiplied with the signal as they reach to the output signal, the output is simply the sum of the signals multiplied with the weights and then this output goes to an activation function.
©IJRASET: All Rights are Reserved
2083
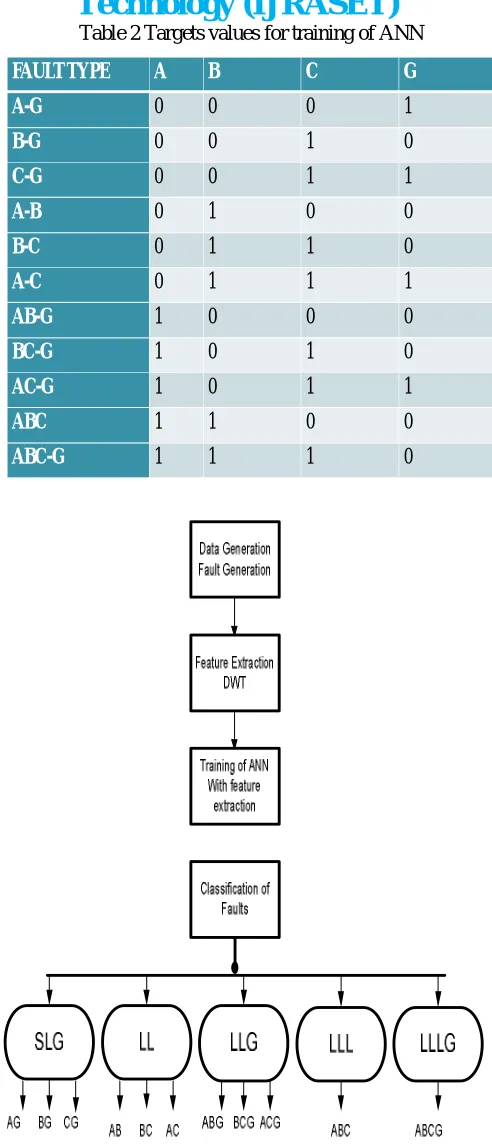
Table 2 Targets values for training of ANN
[image:6.612.188.434.66.638.2]Fig. 5 Flow chart of the Proposed Methodology
III. METHODOLOGY
Single line diagram of power system is clearly represented in to figure 1. The system consist of two generators and transformer and the transmission line parameters can be illustrated as follows, Gird station of Hyderabad T M KHAN HYDERABAD with 220kv transmission line with two generator of 160MVA.
FAULT TYPE A B C G
A-G 0 0 0 1
B-G 0 0 1 0
C-G 0 0 1 1
A-B 0 1 0 0
B-C 0 1 1 0
A-C 0 1 1 1
AB-G 1 0 0 0
BC-G 1 0 1 0
AC-G 1 0 1 1
ABC 1 1 0 0
©IJRASET: All Rights are Reserved
2084
Substation Voltage: 132kv Frequency: 50Hz Power: 160MVA X/R: 10 Transformer Voltage: 132/220kv : 220/132kv Transmission linePositive and negative sequence arrangement inductance per unit length= 0.00092974 Zero sequence arrangement inductance per unit length= 0.0032829
Positive and negative sequence arrangement capacitance per unit length =1.2571e-8 Zero sequence arrangements capacitance per unit length = 7.8555e-9
Positive as well as negative sequence arrangement resistance per unit length = 0.01809 Zero sequence arrangement resistance per unit length =0.2188
Load
Power: 100MVA Power factor: 0.8
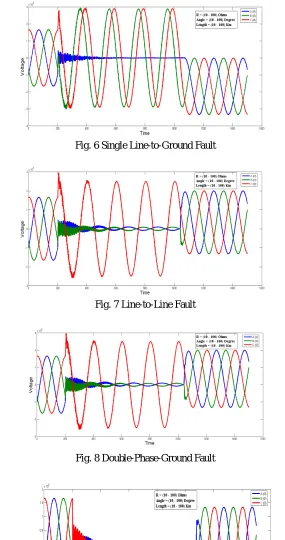
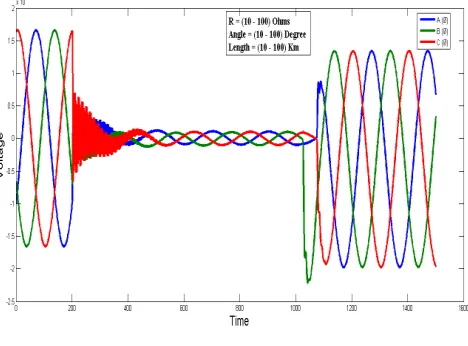
IV. SIMULATIONRESULTS
[image:7.612.69.548.418.697.2]To study various faults of transmission line, a transmission network is framed in MATLAB/Simulink (version 2008). DWT is used for fault detection or extraction when surges occur current will go abruptly high and voltage diminish so DWT used for detection purpose and ANN is used for classifying the faults. System has 2 substation of 160MVA, 132kv. These substation are combined with the power transformer of 132/220kv, 160MVA and also the series load is connected of 100MVA with leading power factor of 0.8 and transmission line has voltage of 220kv with a length of 100km the Results are shown in figures. Different types of faults that are occurred on the transmission lines are detect with use of DWT. Alternative types of faults As shown in figures simultaneously.
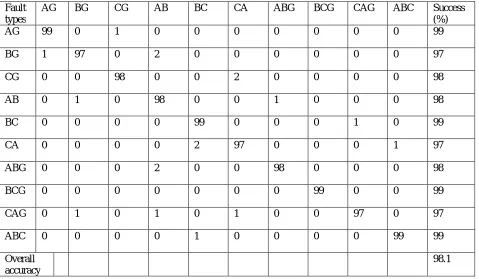
Table 3: Test result for the proposed fault classification scheme using test samples Fault
types
AG BG CG AB BC CA ABG BCG CAG ABC Success
(%)
AG 99 0 1 0 0 0 0 0 0 0 99
BG 1 97 0 2 0 0 0 0 0 0 97
CG 0 0 98 0 0 2 0 0 0 0 98
AB 0 1 0 98 0 0 1 0 0 0 98
BC 0 0 0 0 99 0 0 0 1 0 99
CA 0 0 0 0 2 97 0 0 0 1 97
ABG 0 0 0 2 0 0 98 0 0 0 98
BCG 0 0 0 0 0 0 0 99 0 0 99
CAG 0 1 0 1 0 1 0 0 97 0 97
ABC 0 0 0 0 1 0 0 0 0 99 99
Overall accuracy
©IJRASET: All Rights are Reserved
2085
Fig. 6 Single Line-to-Ground Fault
[image:8.612.161.446.80.620.2]Fig. 7 Line-to-Line Fault
Fig. 8 Double-Phase-Ground Fault
©IJRASET: All Rights are Reserved
2086
Fig. 10 Three-phase-Ground Fault
These simulation results are helpful for designing protection of transmission network especially in Pakistan. Tab. 4 Results of fault classification for various fault types
V. CONCLUSION
The adopted algorithm used the digitized samples of current signals (Ia, Ib, Ic), which are obtained using digital relay. Using wavelet toolbox the DWT is used for feature extraction of signals which are in the form of indices (A, B, C). which are shown in Tab. 4, All of these indices of 11 types of faults are further given as input to ANN, so the next step is to compare the indices of no fault which is at normal condition to abnormal condition which is at the occurrence of fault. If the values of indices at abnormal condition or occurrence of fault exceed to normal condition or no fault condition, then the whole process is taken to the next level which is classification of faults. For classification the coding of ANN is proposed which is shown in Tab. 2 according to the types of faults, ANN is being trained and classifies the fault accurately. To classify transmission line faults which are as SLG, LL, and LLG etc. The joint approach of DWT and ANN is used to classify faults. The approximation of this method is that it can accurately detect the fault and classify as fast as possible, the efficiency reliability and accuracy of this method is high. After shedding the light to the Results so consequence of this method is that Automatically detection of fault implementing DWT for feature extraction and choosing ANN for classification clearly explain that this technique accurately detect the fault and analyze as fast as possible. So if
Fault type
A
B
C
AG 8.793074 2.412454 1.781219
BG 2.241024 2.400959 2.972748
CG 2.746005 1.423488 3.324033
AB 4.067775 1.708913 2.136151
BC 3.139409 1.03598 3.015802
AC 3.945093 0.662414 2.750042
ABG 4.067775 1.708913 2.136151
BCG 2.166244 1.200211 3.426883
ACG 3.887197 0.315019 3.120889
ABC 3.787845 1.391539 3.150422
©IJRASET: All Rights are Reserved
2087
we implement this method as comparing to other traditional method which are ambivalent to fault classification. It will beneficial in the form of life saving of equipment and cost reduction. This method is more economical.
VI. AKNOWLEDGEMENT
This work was financially supported by Quaid-e-Awam University of Engineering, Science & Technology Nawabshah Pakistan.
REFERENCES
[1] Adly, A.R., R.A. El Sehiemy, and A.Y. Abdelaziz, A novel single end measuring system based fast identification scheme for transmission line faults. Measurement, 2017. 103: p. 263-274.
[2] Ghaderi, A., H.L. Ginn, and H.A. Mohammadpour, High impedance fault detection: A review. Electric Power Systems Research, 2017. 143: p. 376-388. [3] Adhikari, S., N. Sinha, and T. Dorendrajit, Fuzzy logic based on-line fault detection and classification in transmission line. SpringerPlus, 2016. 5(1): p. 1002. [4] Subramani, C., et al. Fault investigation methods on power transmission line: A comparative study. in PowerAfrica, 2016 IEEE PES. 2016. IEEE.
[5] Christie, R.D., H. Zadehgol, and M.M. Habib, High impedance fault detection in low voltage networks. IEEE Transactions on power delivery, 1993. 8(4): p. 1829-1836.
[6] Eissa, M. and M. Masoud, A novel digital distance relaying technique for transmission line protection. IEEE Transactions on Power Delivery, 2001. 16(3): p. 380-384.
[7] Aggarwal, R., et al., A novel fault classification technique for double-circuit lines based on a combined unsupervised/supervised neural network. IEEE transactions on Power Delivery, 1999. 14(4): p. 1250-1256.
[8] Mor, V. and A. Vaghamshi, REVIEW ON FAULT DETECTION, IDENTIFICATION AND LOCALIZATION IN ELECTRICAL NETWORKS USING FUZZY-LOGIC. 2016.
[9] Kezunovic, M., I. Rikalo, and D.J. Sobajic, Real-time and off-line transmission line fault classification using neural networks. ENGINEERING INTELLIGENT SYSTEMS FOR ELECTRICAL ENGINEERING AND COMMUNICATIONS, 1996. 4: p. 57-63.
[10] Bo, Z., M. Redfern, and G. Weller, Positional protection of transmission line using fault generated high frequency transient signals. IEEE Transactions on Power Delivery, 2000. 15(3): p. 888-894.
[11] Gupta, P. and R. Mahanty, An Approach for Detection and Classification of Transmission Line Faults by Wavelet Analysis. International Journal of Applied Engineering Research, 2016. 11(9): p. 6290-6296.
[12] Rao, H.G., et al., Detection, Classification and Location of Overhead Line Faults using Wavelet Transform. Indian Journal of Science and Technology, 2017. 8(1).
[13] Prasad, A. and J.B. Edward. Importance of artificial neural networks for location of faults in transmission systems: A survey. in Intelligent Systems and Control (ISCO), 2017 11th International Conference on. 2017. IEEE.
[14] Dubey, R., S.R. Samantaray, and B.K. Panigrahi, An spatiotemporal information system based wide-area protection fault identification scheme. International Journal of Electrical Power & Energy Systems, 2017. 89: p. 136-145.
[15] Rosa, G. and M.A. Costa, Robust functional analysis for fault detection in power transmission lines. Applied Mathematical Modelling, 2016. 40(21): p. 9067-9078.
[16] Jain, A. and B. Moses. Soft computing based fault detection & classification for transmission lines. in Electrical, Electronics, and Optimization Techniques (ICEEOT), International Conference on. 2016. IEEE.
[17] Saha, B., B. Patel, and P. Bera. DWT and BPNN based fault detection, classification and estimation of location of HVAC transmission line. in Intelligent Control Power and Instrumentation (ICICPI), International Conference on. 2016. IEEE.
[18] Fathabadi, H., Novel filter based ANN approach for short-circuit faults detection, classification and location in power transmission lines. International Journal of Electrical Power & Energy Systems, 2016. 74: p. 374-383.
[19] Sanaye-Pasand, M. and O. Malik, High speed transmission system directional protection using an Elman network. IEEE Transactions on Power Delivery, 1998. 13(4): p. 1040-1045.
[20] Sanaye-Pasand, M. and O. Malik, Implementation and laboratory test results of an Elman network-based transmission line directional relay. IEEE transactions on power delivery, 1999. 14(3): p. 782-788.
[21] Chen, W., et al., Study of wavelet-based ultra high speed directional transmission line protection. IEEE Transactions on Power Delivery, 2003. 18(4): p. 1134-1139.