R E S E A R C H
Open Access
Benchmarking mutation effect prediction
algorithms using functionally validated
cancer-related missense mutations
Luciano G Martelotto
1†, Charlotte KY Ng
1†, Maria R De Filippo
1, Yan Zhang
1, Salvatore Piscuoglio
1,
Raymond S Lim
1, Ronglai Shen
2, Larry Norton
3, Jorge S Reis-Filho
1*and Britta Weigelt
1*Abstract
Background:Massively parallel sequencing studies have led to the identification of a large number of mutations present in a minority of cancers of a given site. Hence, methods to identify the likely pathogenic mutations that are worth exploring experimentally and clinically are required. We sought to compare the performance of 15 mutation effect prediction algorithms and their agreement. As a hypothesis-generating aim, we sought to define whether combinations of prediction algorithms would improve the functional effect predictions of specific mutations.
Results:Literature and database mining of single nucleotide variants (SNVs) affecting 15 cancer genes was performed to identify mutations supported by functional evidence or hereditary disease association to be classified either as non-neutral (n = 849) or neutral (n = 140) with respect to their impact on protein function. These SNVs were employed to test the performance of 15 mutation effect prediction algorithms. The accuracy of the prediction algorithms varies considerably. Although all algorithms perform consistently well in terms of positive predictive value, their negative predictive value varies substantially. Cancer-specific mutation effect predictors display no-to-almost perfect agreement in their predictions of these SNVs, whereas the non-cancer-specific predictors showed no-to-moderate agreement. Combinations of predictors modestly improve accuracy and significantly improve negative predictive values.
Conclusions:The information provided by mutation effect predictors is not equivalent. No algorithm is able to predict sufficiently accurately SNVs that should be taken forward for experimental or clinical testing. Combining algorithms aggregates orthogonal information and may result in improvements in the negative predictive value of mutation effect predictions.
Background
Massively parallel sequencing studies have demonstrated that tumors can be regarded as genetically heterogeneous populations of individual clones that accumulate muta-tions during the process of tumorigenesis and tumor pro-gression [1]. These mutations, likely the result of genetic instability, may confer a selective growth advantage and be causally implicated in carcinogenesis (that is, driver mutations), or are either selectively neutral (that is,
passenger mutations) or deleterious for the cancer cells and eventually purged [2,3].
Recent advances in nucleic acid sequencing technolo-gies now provide the means to explore whole genomes at base-pair resolution [4]. The Cancer Genome Atlas (TCGA), the International Cancer Genome Consortium (ICGC) and endeavors led by individual investigators have demonstrated that the repertoire of genes affected by highly recurrent mutations is limited and that there is a large collection of genes affected by mutations in 1% to 2% of cancers from a given anatomical site [2,4,5]. Al-though defining driver mutations based on the presence of hotspot mutations and recurrence rates has resulted
in the identification of bona fide oncogenes and tumor
suppressor genes (TSGs) and a partial repertoire of genes
* Correspondence:[email protected];[email protected] †Equal contributors
1
Department of Pathology, Memorial Sloan Kettering Cancer Center, 1275 York Avenue, New York, NY 10065, USA
Full list of author information is available at the end of the article
© 2014 Martelotto et al.; licensee BioMed Central Ltd. This is an Open Access article distributed under the terms of the Creative Commons Attribution License (http://creativecommons.org/licenses/by/4.0), which permits unrestricted use, distribution, and reproduction in any medium, provided the original work is properly credited. The Creative Commons Public Domain Dedication waiver (http://creativecommons.org/publicdomain/zero/1.0/) applies to the data made available in this article, unless otherwise stated.
significantly mutated in cancer [6-8], this strategy cannot be readily applied to the study of the genes affected by mutations in a minority of tumors of a given anatomical site. In fact, recent studies have demonstrated that some of these mutations are of functional significance and likely
constitutebona fidedrivers, therapeutic targets, or
mecha-nisms of therapy resistance (for example, ERBB2 and
ESR1activating mutations in breast cancer) [9-12].
Defining whether a non-hotspot mutation is biologic-ally and/or clinicbiologic-ally relevant is by no means a trivial task, in particular for missense mutations, and often la-borious functional assays need to be performed [9-12]. Given the vast number of mutations being identified by massively parallel sequencing efforts, finding ways to prioritize which mutations should be subjected to func-tional analysis is crucial. Computafunc-tional methods to dis-cern which somatic mutations likely result in amino acid changes that could have biologic implications have been developed [13]. Most of these algorithms rely on the as-sumption that protein sequences derived from existing living organisms have survived natural selection [14], and many also utilize sequence, structural information, and/or protein annotation (that is, whether a mutation affects an active site, ligand binding domain, disulfide bridges, or protein-protein interactions) to differentiate mutations that result in no or negligible impact on protein function from those that are likely pathogenic. Prediction is feasible because mutations that affect protein function tend to occur at evolutionarily conserved sites [15]. Ex-amples of such computational prediction methods (Additional file 1) are Sorted Intolerant From Tolerant (SIFT) [16], PolyPhen-2 [17], Mutation Assessor [18], CONsensus DELeteriousness score of missense muta-tions (Condel) [19], Cancer-specific High-throughput Annotation of Somatic Mutations (CHASM) [20], Protein Variation Effect Analyzer (PROVEAN) [14], Functional Analysis Through Hidden Markov Models (FATHMM) [21], Variant Effect Scoring Tool (VEST) [22], Mutation-Taster [23], Cancer Driver Annotation (CanDrA) [24], and others [25]. Additionally, CHASM, FATHMM, and CanDrA were developed explicitly to differentiate muta-tions that are likely to constitute cancer drivers from pas-sengers. In particular, FATHMM is a species-independent method, which incorporates pathogenicity weights and is capable of recognizing protein domains (species-inde-pendent/evolutionary units) sensitive to missense muta-tions [21]. CHASM [20] is a machine-learning system trained using the information from the Catalogue Of Somatic Mutations In Cancer (COSMIC) [26] and other cancer-related databases, and utilizes a set of 49 predictive features, including the frequency of a given missense change type in COSMIC. Cancer-Related Analysis of VAriants Toolkit (CRAVAT) is a web-based application for CHASM that provides a simple interface to prioritize
genes and variants important for specific cancer tissue types [22]. CanDrA is a support vector machine method that renders predictions from a set of 95 features and scores computed by 10 other prediction algorithms [24]. While most of these predictors are single/independent predictors, Condel and CanDrA make use of scores gener-ated by other algorithms and, therefore, can be considered meta-predictors (Additional file 1).
These predictors provide a fast and inexpensive way to define functional annotation and to predict the effects of mutations, and could theoretically be employed to assist in the selection of mutations that would be worth ex-ploring experimentally and clinically. Different predic-tors have been designed based on different algorithms (Additional file 1) and, most importantly, were trained using different sets of functional and neutral mutations. As a consequence of the differences in the underlying methodology, these predictors often return dissimilar or even contradictory results [27]. Therefore, we sought to benchmark the performance of 15 mutation effect pre-diction algorithms comprehensively using a set of mis-sense mutations whose functional effects have been experimentally validated and/or that have been shown to result in early onset breast and ovarian cancer syndrome, Li-Fraumeni syndrome or Li-Fraumeni-like syndrome. To generate a list of neutral and non-neutral mutations, we
rigorously compiled a set of mutations inbona fide
onco-genes, recently described cancer genes andbona fideTSGs
by mining the literature and mutation databases (see Methods) [28-30]. As a hypothesis-generating aim and
using our ‘gold standard’ list of validated mutations, we
sought to define whether the mutation effect predictions made by combinations of algorithms would outperform those made by individual predictors or meta-predictors.
Results
Categorization of mutations based on functional evidence
We included known missense mutations in six bona fide
oncogenes (BRAF,KIT,PIK3CA,KRAS,EGFR,ERRB2), six
recently described cancer genes (ESR1, DICER1, MYOD1,
IDH1, IDH2, SF3B1) and three bona fide TSGs (TP53,
BRCA1,BRCA2) in this study. We next performed an
ex-haustive search in the literature and/or existing databases to gather functional evidence for each of the 3,706 muta-tions compiled for the 15 genes (see Methods; Additional file 2). Given that PolyPhen-2, MutationTaster, CanDrA, and Condel can only define the potential functional impact of single nucleotide variants (SNVs), dinucleotide and tri-nucleotide changes were excluded from this study. The final dataset employed consists of 3,591 SNVs (Table 1; Additional file 2).
SNVs with experimentally validated effects on the target protein function or proven to be causative of Li-Fraumeni syndrome, Li-Fraumeni-like syndrome, or early onset breast
Martelottoet al. Genome Biology2014,15:484 Page 2 of 20
and ovarian cancer syndrome were considered non-neutral, those that have been experimentally validated as non-functional or proven not to be causative of Li-Fraumeni syndrome, Li-Fraumeni-like syndrome, and early onset breast and ovarian cancer syndrome as neutral, and those without definitive experimental validation or con-sidered germline variants of unknown significance were considered uncertain (see Methods).
Using these criteria, 849 SNVs were categorized as non-neutral, 140 SNVs were assigned to the neutral category, and the remaining 2,602 were regarded as uncertain (Table 1; Additional file 2). Of the neutral and non-neutral mutations (n = 989), we collected a median of 28.5 SNVs
(range, 23 to 38) for thebona fideoncogenes, a median of
five SNVs (range, 1 to 11) for the new cancer genes, and a
median of 81 SNVs (range, 62 to 640) for the bona fide
TSGs (Table 1).
Agreement between mutation effect prediction algorithms
We evaluated 11 single/independent prediction algorithms, namely CHASM (breast), CHASM (lung), CHASM (melan-oma) [20], FATHMM (cancer), FATHMM (missense) [21], Mutation Assessor [18], MutationTaster [23], PolyPhen-2
[17], PROVEAN [14], SIFT [16], and VEST [22], and four meta-predictors, namely CanDrA (breast), CanDrA (lung), CanDrA (melanoma) [24], and Condel [19] using the 3,591 SNVs compiled (Additional files 1 and 2). These 15 algorithms returned predictions that were strikingly distinct from one another (Table 2). For instance, VEST
predicted 2,465 SNVs to be‘functional’and 1,126 to be
‘neutral’, whereas PROVEAN predicted that 1,630 SNVs
would be ‘deleterious’ and 1,961 would be ‘neutral’;
these discrepancies were also observed when the other mutation effect prediction algorithms were employed. It should be noted that CanDrA appears to be gene- and
tissue-specific, as all but oneTP53SNVs were predicted
to be‘Drivers’by all CanDrA algorithms (that is, CanDrA
breast/lung/melanoma), whereas all BRCA1 and BRCA2
SNVs were predicted to be‘Drivers’ by CanDrA (breast)
but almost exclusively ‘Passengers/No-call’ by CanDrA
(lung/melanoma) (Additional file 2). To allow comparison between predictors, we converted the calls made by each
predictor into‘neutral’or‘non-neutral’(see Methods).
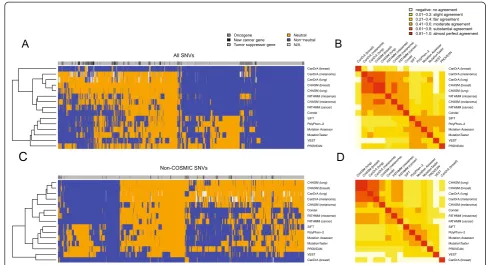
To evaluate the inter-rater agreement between predic-tion methods, we performed unsupervised clustering of the calls made for all 3,591 SNVs by each predictor and
calculated pairwise unweighted Cohen’s Kappa coefficients
for each pair of predictors. Unsupervised clustering of the results of the mutation effect prediction algorithms re-vealed two main groups with an additional outlier CanDrA (breast) (Figure 1A). One of the clusters (referred to as
‘Cluster 1’) contained all but one of the cancer-specific
predictors, namely CHASM (breast), CHASM (lung), CHASM (melanoma), FATHMM (cancer), CanDrA (lung) and CanDrA (melanoma), and the non-cancer-specific predictor FATHMM (missense) and its related meta-predictor Condel (Figure 1A; Additional file 1). Their pairwise unweighted Kappa coefficients showed
fair-to-almost perfect agreement (median unweightedκ= 0.5679,
range κ = 0.3861 to 0.9004; Figure 1B; Additional file 3).
CanDrA (breast) was the sole cancer-specific predictor that did not belong to this cluster. The best agreement within this group was between CHASM (breast) and
CHASM (lung) (κ= 0.9004), which is not surprising
con-sidering that they share the underlying prediction engine.
The second cluster (referred to as ‘Cluster 2’) was
com-posed of non-cancer-specific mutation effect prediction algorithms, namely Mutation Assessor, MutationTaster, PolyPhen-2, PROVEAN, SIFT, and VEST (Figure 1A). The pairwise agreement between these predictors ranged
from fair to moderate (median unweighted κ = 0.4347,
range κ = 0.3355 to 0.5662, Figure 1B; Additional file 3).
[image:3.595.57.290.122.372.2]The modest agreement between these predictors was surprising, given that conservation is a feature employed by all algorithms (Additional file 1), and the sole feature employed by Mutation Assessor and SIFT [27]. Overall, the agreement between predictors from distinct clusters
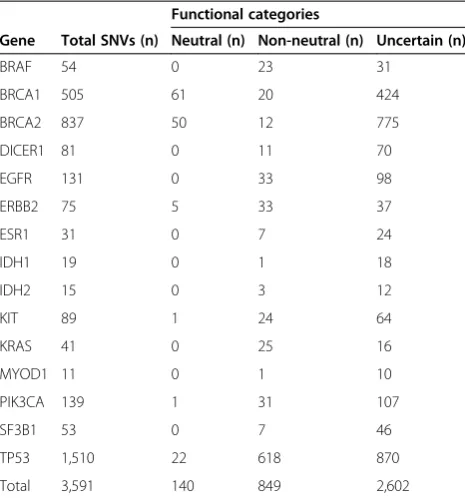
Table 1 Single nucleotide variants included in this study stratified according to the evidence supporting their impact on protein function
Functional categories
Gene Total SNVs (n) Neutral (n) Non-neutral (n) Uncertain (n)
BRAF 54 0 23 31
BRCA1 505 61 20 424
BRCA2 837 50 12 775
DICER1 81 0 11 70
EGFR 131 0 33 98
ERBB2 75 5 33 37
ESR1 31 0 7 24
IDH1 19 0 1 18
IDH2 15 0 3 12
KIT 89 1 24 64
KRAS 41 0 25 16
MYOD1 11 0 1 10
PIK3CA 139 1 31 107
SF3B1 53 0 7 46
TP53 1,510 22 618 870
Total 3,591 140 849 2,602
A total of 3,591 single nucleotide variants (SNVs) in sixbona fideoncogenes, six new cancer genes and threebona fidetumor suppressor genes were assessed for the evidence supporting a functional role for each of the mutations. These SNVs were classified as non-neutral,neutral or uncertain based on direct experimental/functional data in the literature and/or on the basis of causation of Li-Fraumeni syndrome and Li-Fraumeni-like syndrome (forTP53) or early onset breast and ovarian cancer syndrome (forBRCA1and BRCA2), as recorded in dedicated mutation databases [28-30]. For a detailed list, see Additional file2.
Martelottoet al. Genome Biology2014,15:484 Page 3 of 20
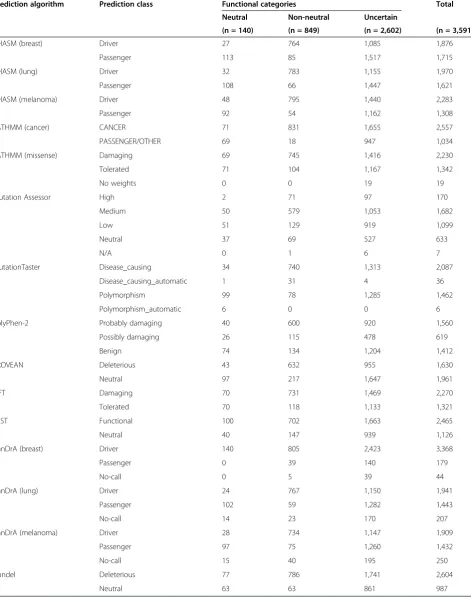
Table 2 Predictions of 3,591 functionally validated single nucleotide variants by 15 mutation effect prediction algorithms
Prediction algorithm Prediction class Functional categories Total
Neutral Non-neutral Uncertain
(n = 140) (n = 849) (n = 2,602) (n = 3,591)
CHASM (breast) Driver 27 764 1,085 1,876
Passenger 113 85 1,517 1,715
CHASM (lung) Driver 32 783 1,155 1,970
Passenger 108 66 1,447 1,621
CHASM (melanoma) Driver 48 795 1,440 2,283
Passenger 92 54 1,162 1,308
FATHMM (cancer) CANCER 71 831 1,655 2,557
PASSENGER/OTHER 69 18 947 1,034
FATHMM (missense) Damaging 69 745 1,416 2,230
Tolerated 71 104 1,167 1,342
No weights 0 0 19 19
Mutation Assessor High 2 71 97 170
Medium 50 579 1,053 1,682
Low 51 129 919 1,099
Neutral 37 69 527 633
N/A 0 1 6 7
MutationTaster Disease_causing 34 740 1,313 2,087
Disease_causing_automatic 1 31 4 36
Polymorphism 99 78 1,285 1,462
Polymorphism_automatic 6 0 0 6
PolyPhen-2 Probably damaging 40 600 920 1,560
Possibly damaging 26 115 478 619
Benign 74 134 1,204 1,412
PROVEAN Deleterious 43 632 955 1,630
Neutral 97 217 1,647 1,961
SIFT Damaging 70 731 1,469 2,270
Tolerated 70 118 1,133 1,321
VEST Functional 100 702 1,663 2,465
Neutral 40 147 939 1,126
CanDrA (breast) Driver 140 805 2,423 3,368
Passenger 0 39 140 179
No-call 0 5 39 44
CanDrA (lung) Driver 24 767 1,150 1,941
Passenger 102 59 1,282 1,443
No-call 14 23 170 207
CanDrA (melanoma) Driver 28 734 1,147 1,909
Passenger 97 75 1,260 1,432
No-call 15 40 195 250
Condel Deleterious 77 786 1,741 2,604
Neutral 63 63 861 987
Single nucleotide variants (SNVs) were classified as non-neutral, neutral or uncertain based on functional/experimental data from the literature or mutation databases [28-30]. Each SNV was classified by each of the mutation effect prediction algorithms independently.
Martelottoet al. Genome Biology2014,15:484 Page 4 of 20
ranged from no to fair agreement (median unweighted
κ = 0.2062, range κ= -0.0520 to 0.4216, Figure 1B;
Additional file 3). CanDrA (breast) was an outlier and displayed no-to-slight agreement with each of the other predictors (Figure 1B; Additional file 3). We repeated the same comparisons employing only the 989 SNVs considered to be non-neutral or neutral on the basis of functional analyses, which revealed similar results, with the exception of CanDrA (breast), which now belongs to Cluster 1 (Additional files 4 and 5).
As the cancer-specific CanDrA, CHASM, and FATHMM (cancer) are all trained using training sets consisting of ca-nonical somatic SNVs and their frequencies, we evaluated the inter-rater agreement of all predictors after excluding from our dataset the SNVs found in the COSMIC database (v68). Of the 3,591 SNVs, 1,699 (47.3%) were not present in COSMIC, of which 297 were experimentally validated as ei-ther non-neutral or neutral (Additional files 6 and 7). Akin to the analysis including all SNVs, unsupervised clustering of the predictions made for non-COSMIC SNVs demon-strated that the two main clusters and their compositions were largely maintained (Figure 1C). In this analysis, not only CanDrA (breast) but also VEST emerged as outliers, clustering separately from the two main clusters (Figure 1C). Compared to the Kappa values obtained using all SNVs, when employing only non-COSMIC SNVs, we observed
that median Kappa coefficients in Cluster 2 remained largely unchanged, whereas the median unweighted Kappa
scores within Cluster 1 decreased from κ = 0.5679 to
0.4558 (Figure 1D; Additional file 3). These data provide evidence to suggest that the agreement between predictors in Cluster 1 is reduced when SNVs present in the COSMIC database were removed given that some mutation effect predictors from Cluster 1 were trained using SNVs in-cluded in COSMIC.
[image:5.595.52.539.88.353.2]It could be hypothesized that the discrepancies in the predictions made by different mutation effect prediction algorithms would predominantly affect SNVs whose classifications are based on predictions of relatively poor confidence. CanDrA (breast), CanDrA (lung), CanDrA (melanoma), PolyPhen-2, and Mutation Assessor have pre-specified categories that identify SNVs whose predic-tions are based on limited confidence. For the other pre-dictors, we employed a heuristic approach based on the original description of each predictor and additional online sources to define a category of SNVs whose predictions were of poor confidence (see Methods). We classified the 3,591 SNVs included in this study into non-neutral, neu-tral, and low confidence categories (Additional file 8), and observed that a median of 437 (range, 44 to 1,298) SNVs were classified as of low confidence. CanDrA (breast) clas-sified only 44 SNVs as of low confidence, whereas
Figure 1Inter-rater agreement between 15 mutation effect prediction algorithms.Hierarchical clustering of the calls made by 15 mutation effect prediction algorithms using(A)all 3,591 single nucleotide variants (SNVs) included in this study, and(C)the 1,699 SNVs not present in the COSMIC database. The unweighted Cohen’s Kappa coefficient was computed for each pair of predictors using(B)all 3,591 SNVs and(D)the 1,699 SNVs not present in the COSMIC database. The ranges of unweighted Kappa values and their corresponding colors are indicated in the color key.
Martelottoet al. Genome Biology2014,15:484 Page 5 of 20
PROVEAN classified 1,298 in this category. These marked differences may be a mere reflection of the different cutoffs chosen; however, when only the predictors that have a pre-defined low confidence category (that is, CanDrA (breast), CanDrA (lung), CanDrA (melanoma), PolyPhen-2, and Mutation Assessor) were assessed, the number of SNVs classified as such ranged from 44 (CanDrA (breast)) to 1,099 (Mutation Assessor). In fact, only 27 SNVs had a majority vote of low confidence (that is, eight or more predictors classifying a given SNV as of low confidence; Additional file 9). Hierarchical clustering of the predic-tions for the 3,591 SNVs including a low confidence category revealed a cluster structure similar to that obtained with only non-neutral and neutral categories (that is, Cluster 1 enriched for cancer-specific predictors and Cluster 2 exclusively composed of non-cancer-specific predictors), however PROVEAN clustered in a
separate branch from Cluster 2. Noteworthy, the Cohen’s
Kappa coefficients were lower than those observed when SNVs were classified into two categories only (that is, as neutral or non-neutral; Additional files 10 and 11). When these analyses were repeated including only the non-COSMIC SNVs, the results of the clustering analysis were similar, however the agreement between predictors was reduced even further (Additional files 10 and 11). By fo-cusing only on the 989 SNVs with functional evidence to classify them as neutral or non-neutral, the addition of a low confidence category resulted again in a similar cluster structure, however PROVEAN was an outlier. This obser-vation was likely due to the fact that 132 of the 989 (13.3%) SNVs were classified as of low confidence by PROVEAN only (Additional file 12). As compared to
the Cohen’s Kappa coefficients obtained with two
cat-egories, the analysis of agreement between predictors for the classification of these 989 SNVs was generally lower when the low confidence category was included (Additional file 13). Similar results were obtained when the subset of 297 non-COSMIC SNVs were analyzed (Additional files 12 and 13).
Performance of 15 commonly used mutation effect prediction algorithms
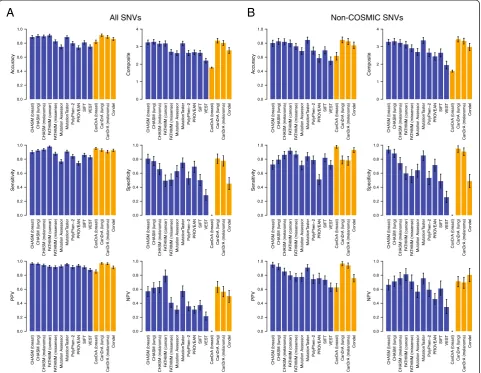
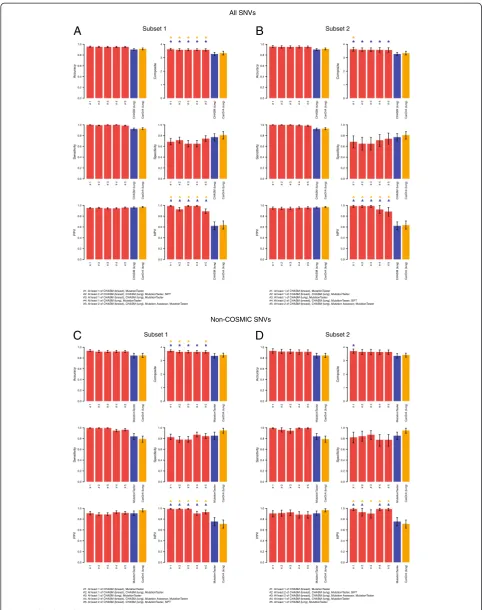
Among the SNVs included in this study, 989 had sufficient functional evidence to support their classification as either non-neutral (n = 849) or neutral (n = 140) with respect to an effect on protein function (Table 1). Hence, the per-formance of the predictors was assessed using these validated SNVs. Accuracy, specificity, sensitivity, positive predictive value (PPV), negative predictive value (NPV), and composite score were calculated to evaluate the per-formance of each predictor (see Methods). This analysis revealed that the proportion of SNVs correctly classified by the different predictors varied considerably (median, 85.84%; range, 73.71% to 91.28%; Figure 2A, Table 3).
Of the single predictors, FATHMM (cancer) was the most accurate (91.00%, 95% confidence interval (CI) 89.18-92.62%), while PROVEAN was the least accurate (73.71%, 95% CI 70.88-76.64%; Figure 2A, Table 3). The meta-predictors with the highest accuracy (Figure 2A, Table 3) were CanDrA (lung; 91.28%, 95% CI 89.54-93.04%) and CanDrA (melanoma; 88.97%, 95% CI 87.02-90.91%), though their accuracy was not statistically different from that of the best single predictor FATHMM (cancer) in this
set of SNVs (P>0.05).
The sensitivity and specificity of the algorithms varied substantially (median, 90.73%; range, 74.44% to 97.88%; median, 62.86%; range, 0% to 80.95%, respectively; Figure 2A, Table 3). The most sensitive single predictor was FATHMM (cancer; 97.88%, 95% CI 96.87-98.82%), which was statistically more sensitive than the most sensi-tive meta-predictor CanDrA (breast) in this mutation set
(95.38%, 95% CI 93.85-96.81%, Figure 2A, Table 3;P<0.05).
Of the single predictors, CHASM (breast) was the most specific (80.71%, 95% CI 73.33-87.12%) and the most spe-cific meta-predictor was CanDrA (lung; 80.95%, 95% CI 73.64-87.32%), though no statistically significant differences
between these were observed in this mutation set (P>0.05).
Noteworthy, CanDrA (breast) had 0% specificity with the set of SNVs tested, while the other CanDrA predictors (lung/melanoma) achieved >75% specificity, which suggests that the predictions made by CanDrA have a strong de-pendency on tissue of origin. Although all 15 predictors performed consistently well in terms of PPV (median, 92.59%; range, 85.19% to 96.97%), a dramatic difference in NPV was observed (median, 50.00%; range, 0.00% to 79.31%; Figure 2A, Table 3). In particular, FATHMM (cancer; 79.31%, 95% CI 70.59-87.66%) significantly
out-performed all single predictors (P <0.05) but CHASM
(melanoma; 63.01%, 95% CI 55.40-70.92%) in the set of SNVs tested, and its NPV did not significantly differ from that of the best meta-predictor CanDrA (lung; 63.35%,
95% CI 56.10-71.01%;P>0.05; Figure 2A, Table 3).
Intuitively, the best algorithm would have high and bal-anced values for each of the performance statistics. With
this rationale, we calculated a ‘composite score’, ranging
from 0 to 4, by summing up the sensitivity, specificity, PPV, and NPV of each predictor as an overall performance indicator for each predictor. The median composite score was 2.7866 (range, 1.8056 to 3.3413; Figure 2A, Table 3). Using this parameter, the best-performing single predictor was CHASM (lung; 3.2751, 95% CI 3.1418-3.3988) but it was not significantly different from the best meta-predictor CanDrA (lung) in this set of SNVs (3.3413,
95% CI 3.2103-3.4747,P>0.05, Figure 2A, Table 3).
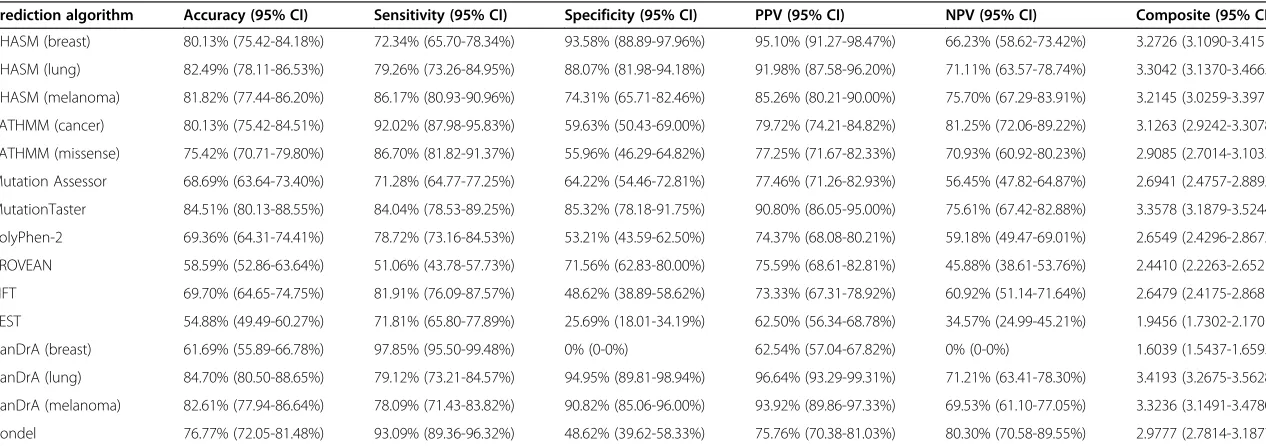
We next performed the same analysis using only the 297 SNVs not included in the COSMIC database. In this analysis, the median accuracy and sensitivity were 76.77% (range, 54.88% to 84.70%) and 79.26% (range,
Martelottoet al. Genome Biology2014,15:484 Page 6 of 20
51.06% to 97.85%), respectively (Figure 2B, Table 4). The most accurate single and meta-predictors in this con-text were MutationTaster (84.51%, 95% CI 80.13-88.55%) and CanDrA (lung; 84.70%, 95% CI 80.50-88.65%), re-spectively (Figure 2B, Table 4). As compared to the ana-lysis including all SNVs, when excluding SNVs present in the COSMIC database, the accuracy of all predictors but Mutation Assessor and MutationTaster were statistically
significantly reduced (P <0.05). Furthermore, eight of 15
mutation effect prediction algorithms showed statistically significant reduction in sensitivity and 10 of 15 showed a statistically significant reduction in PPV (Figure 2B; Table 4).
To assess whether the mutation effect prediction algo-rithms would have different performances when SNVs in
bona fideoncogenes,bona fideTSGs or new cancer genes
were considered, we selected from the set of 989 SNVs
those found in bona fide oncogenes, bona fideTSGs or
new cancer genes (n = 176, n = 783 or n = 30 SNVs, re-spectively; Additional file 14). When only SNVs in onco-genes were assessed, FATHMM (cancer) remained the most accurate single predictor (96.59%, 95% CI 93.75-98.86%; Additional files 15 and 16) and CanDrA (lung) remained the most accurate meta-predictor (95.00%, 95% CI 91.36-98.15%; Additional files 15 and 16). When only SNVs affecting TSGs were tested, CHASM (lung) was the most accurate single predictor (92.98%, 95% CI 91.19-94.76%) and CanDrA (melanoma) was the most accurate meta-predictor (93.46%, 95% CI 91.74-95.15%, Additional files 15 and 16). Interestingly, six predictors, namely CHASM (breast), CHASM (melanoma), FATHMM (mis-sense), Mutation Assessor, CanDrA (melanoma), and Condel performed significantly better for SNVs in TSGs
as compared to SNVs in oncogenes (P <0.05; Additional
A
All SNVsB
Non-COSMIC SNVsCHASM (breast) CHASM (lung)
CHASM (melanoma)
F
A
THMM (cancer)
FA
THMM (missense) Mutation Assessor
MutationT
aster
P P
R
O
VEAN SIFT VEST
CanDrA (breast) CanDrA (lung)
CanDrA (melanoma) Condel Accur acy 0.0 0.4 0.6 0.8 1.0
CHASM (breast) CHASM (lung)
CHASM (melanoma) F A T HMM (cancer) F A
THMM (missense) Mutation Assessor
Mutation
T
aster
P PR
O
VEAN SIFT VEST
CanDrA (breast) CanDrA (lung)
CanDrA (melanoma) Condel Composite 0 1 3 4
CHASM (breast) CHASM (lung)
CHASM (melanoma) F A T HMM (cancer) F A T HMM (missense) Mutation Assessor MutationT aster P P R O
VEAN SIFT VEST
CanDrA (breast) CanDrA (lung)
CanDrA (melanoma) Condel Sensitivity 0.0 0.4 0.6 0.8 1.0
CHASM (breast) CHASM (lung)
CHASM (melanoma) F A T HMM (cancer) F A
THMM (missense) Mutation Assessor
MutationT
aster
P PR
O
VEAN SIFT VEST
CanDrA (breast) CanDrA (lung)
CanDrA (melanoma) Condel Specificity 0.0 0.4 0.6 0.8 1.0
CHASM (breast) CHASM (lung)
CHASM (melanoma) F A THMM (cancer) F A
THMM (missense) Mutation Assessor
MutationT
aster
P PR
O
VEAN SIFT VEST
CanDrA (breast) CanDrA (lung)
CanDrA (melanoma) Condel PPV 0.0 0.4 0.6 0.8 1.0
CHASM (breast) CHASM (lung)
CHASM (melanoma)
F
A
THMM (cancer)
FA
THMM (missense) Mutation Assessor
Mutation T aster P P R O
VEAN SIFT VEST
CanDrA (breast) CanDrA (lung)
CanDrA (melanoma) Condel NPV 0.0 0.4 0.6 0.8 1.0
CHASM (breast) CHASM (lung)
CHASM (melanoma) F A THMM (cancer) F A
THMM (missense) Mutation Assessor
Mutation T aster P P R O
VEAN SIFT VEST
CanDrA (breast) CanDrA (lung)
CanDrA (melanoma) Condel Accu racy 0.0 0.4 0.6 0.8 1.0
CHASM (breast) CHASM (lung)
CHASM (melanoma) F A THMM (cancer) F A
THMM (missense) Mutation Assessor
MutationT
aster
P P
R
O
VEAN SIFT VEST
CanDrA (breast) CanDrA (lung)
CanDrA (melanoma) Condel Composite 0 1 3 4
CHASM (breast) CHASM (lung)
CHASM (melanoma) F A T HMM (cancer) FA
THMM (missense) Mutation Assessor
MutationT
aster
P P
R
O
VEAN SIFT VEST
CanDrA (breast) CanDrA (lung)
CanDrA (melanoma) Condel Sensitivity 0.0 0.4 0.6 0.8 1.0
CHASM (breast) CHASM (lung)
CHASM (melanoma) F A THMM (cancer) F A T HMM (missense) Mutation Assessor Mutation T aster P PR O
VEAN SIFT VEST
CanDrA (breast) CanDrA (lung)
CanDrA (melanoma) Condel Specificity 0.0 0.4 0.6 0.8 1.0
CHASM (breast) CHASM (lung)
CHASM (melanoma) F A THMM (cancer) F A
THMM (missense) Mutation Assessor
Mutation T aster P P R O
VEAN SIFT VEST
CanDrA (breast) CanDrA (lung)
CanDrA (melanoma) Condel PPV 0.0 0.4 0.6 0.8 1.0
CHASM (breast) CHASM (lung)
CHASM (melanoma) F A THMM (cancer) F A
THMM (missense) Mutation Assessor
MutationT
aster
P P
R
O
VEAN SIFT VEST
CanDrA (breast) CanDrA (lung)
[image:7.595.58.540.90.463.2]CanDrA (melanoma) Condel NPV 0.0 0.4 0.6 0.8 1.0
Figure 2Performance statistics of mutation effect prediction algorithms.Based on the prediction results of(A)the non-neutral (n = 849) and neutral (n = 140) single nucleotide variants (SNVs) included in this study and(B)the non-neutral (n = 188) and neutral (n = 109) SNVs not present in the COSMIC database, the accuracy, sensitivity, specificity, positive predictive value (PPV), negative predictive value (NPV), and composite score for each predictor are plotted. Error bars represent the 95% CIs generated by bootstrapping. Single/independent predictors are shown in blue bars, and meta-predictors are shown in orange bars.
Martelottoet al. Genome Biology2014,15:484 Page 7 of 20
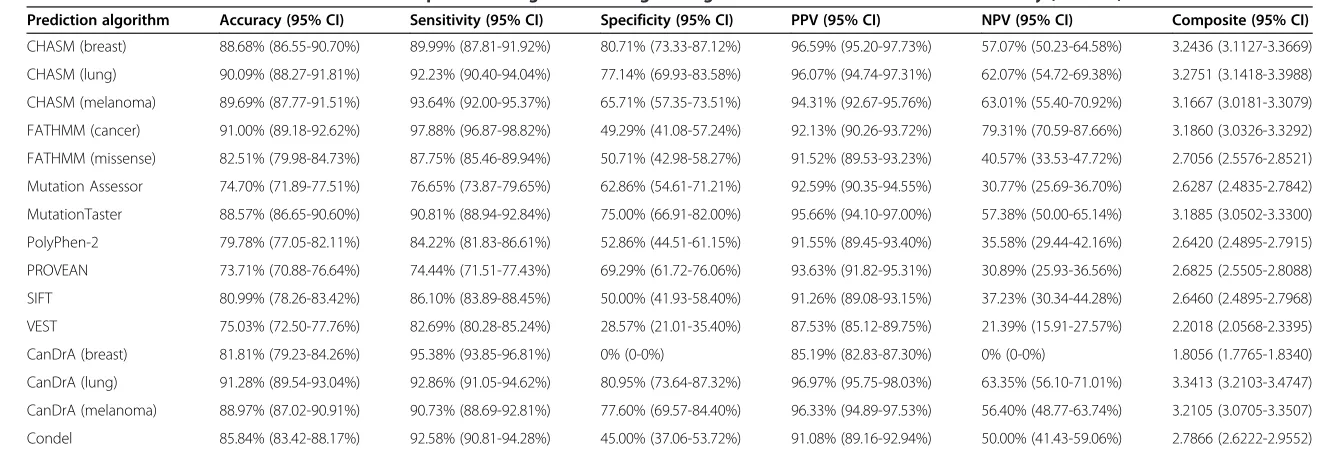
Table 3 Performance statistics of mutation effect prediction algorithms using all single nucleotide variants tested functionally (n = 989)
Prediction algorithm Accuracy (95% CI) Sensitivity (95% CI) Specificity (95% CI) PPV (95% CI) NPV (95% CI) Composite (95% CI)
CHASM (breast) 88.68% (86.55-90.70%) 89.99% (87.81-91.92%) 80.71% (73.33-87.12%) 96.59% (95.20-97.73%) 57.07% (50.23-64.58%) 3.2436 (3.1127-3.3669)
CHASM (lung) 90.09% (88.27-91.81%) 92.23% (90.40-94.04%) 77.14% (69.93-83.58%) 96.07% (94.74-97.31%) 62.07% (54.72-69.38%) 3.2751 (3.1418-3.3988)
CHASM (melanoma) 89.69% (87.77-91.51%) 93.64% (92.00-95.37%) 65.71% (57.35-73.51%) 94.31% (92.67-95.76%) 63.01% (55.40-70.92%) 3.1667 (3.0181-3.3079)
FATHMM (cancer) 91.00% (89.18-92.62%) 97.88% (96.87-98.82%) 49.29% (41.08-57.24%) 92.13% (90.26-93.72%) 79.31% (70.59-87.66%) 3.1860 (3.0326-3.3292)
FATHMM (missense) 82.51% (79.98-84.73%) 87.75% (85.46-89.94%) 50.71% (42.98-58.27%) 91.52% (89.53-93.23%) 40.57% (33.53-47.72%) 2.7056 (2.5576-2.8521)
Mutation Assessor 74.70% (71.89-77.51%) 76.65% (73.87-79.65%) 62.86% (54.61-71.21%) 92.59% (90.35-94.55%) 30.77% (25.69-36.70%) 2.6287 (2.4835-2.7842)
MutationTaster 88.57% (86.65-90.60%) 90.81% (88.94-92.84%) 75.00% (66.91-82.00%) 95.66% (94.10-97.00%) 57.38% (50.00-65.14%) 3.1885 (3.0502-3.3300)
PolyPhen-2 79.78% (77.05-82.11%) 84.22% (81.83-86.61%) 52.86% (44.51-61.15%) 91.55% (89.45-93.40%) 35.58% (29.44-42.16%) 2.6420 (2.4895-2.7915)
PROVEAN 73.71% (70.88-76.64%) 74.44% (71.51-77.43%) 69.29% (61.72-76.06%) 93.63% (91.82-95.31%) 30.89% (25.93-36.56%) 2.6825 (2.5505-2.8088)
SIFT 80.99% (78.26-83.42%) 86.10% (83.89-88.45%) 50.00% (41.93-58.40%) 91.26% (89.08-93.15%) 37.23% (30.34-44.28%) 2.6460 (2.4895-2.7968)
VEST 75.03% (72.50-77.76%) 82.69% (80.28-85.24%) 28.57% (21.01-35.40%) 87.53% (85.12-89.75%) 21.39% (15.91-27.57%) 2.2018 (2.0568-2.3395)
CanDrA (breast) 81.81% (79.23-84.26%) 95.38% (93.85-96.81%) 0% (0-0%) 85.19% (82.83-87.30%) 0% (0-0%) 1.8056 (1.7765-1.8340)
CanDrA (lung) 91.28% (89.54-93.04%) 92.86% (91.05-94.62%) 80.95% (73.64-87.32%) 96.97% (95.75-98.03%) 63.35% (56.10-71.01%) 3.3413 (3.2103-3.4747)
CanDrA (melanoma) 88.97% (87.02-90.91%) 90.73% (88.69-92.81%) 77.60% (69.57-84.40%) 96.33% (94.89-97.53%) 56.40% (48.77-63.74%) 3.2105 (3.0705-3.3507)
Condel 85.84% (83.42-88.17%) 92.58% (90.81-94.28%) 45.00% (37.06-53.72%) 91.08% (89.16-92.94%) 50.00% (41.43-59.06%) 2.7866 (2.6222-2.9552)
Based on the prediction results of all non-neutral and neutral single nucleotide variants included in this study, the accuracy, sensitivity, specificity, positive predictive value (PPV), negative predictive value (NPV), and composite score for each predictor were computed. The 95% confidence intervals (CI) generated by bootstrapping are shown in parentheses.
Martelotto
et
al.
Genome
Biology
2014,
15
:484
Page
8
o
f
2
0
http://geno
mebiology
.com/2014/
Table 4 Performance statistics of mutation effect prediction algorithms using only functionally tested single nucleotide variants not present in the COSMIC database (n = 297)
Prediction algorithm Accuracy (95% CI) Sensitivity (95% CI) Specificity (95% CI) PPV (95% CI) NPV (95% CI) Composite (95% CI)
CHASM (breast) 80.13% (75.42-84.18%) 72.34% (65.70-78.34%) 93.58% (88.89-97.96%) 95.10% (91.27-98.47%) 66.23% (58.62-73.42%) 3.2726 (3.1090-3.4151)
CHASM (lung) 82.49% (78.11-86.53%) 79.26% (73.26-84.95%) 88.07% (81.98-94.18%) 91.98% (87.58-96.20%) 71.11% (63.57-78.74%) 3.3042 (3.1370-3.4665)
CHASM (melanoma) 81.82% (77.44-86.20%) 86.17% (80.93-90.96%) 74.31% (65.71-82.46%) 85.26% (80.21-90.00%) 75.70% (67.29-83.91%) 3.2145 (3.0259-3.3971)
FATHMM (cancer) 80.13% (75.42-84.51%) 92.02% (87.98-95.83%) 59.63% (50.43-69.00%) 79.72% (74.21-84.82%) 81.25% (72.06-89.22%) 3.1263 (2.9242-3.3078)
FATHMM (missense) 75.42% (70.71-79.80%) 86.70% (81.82-91.37%) 55.96% (46.29-64.82%) 77.25% (71.67-82.33%) 70.93% (60.92-80.23%) 2.9085 (2.7014-3.1033)
Mutation Assessor 68.69% (63.64-73.40%) 71.28% (64.77-77.25%) 64.22% (54.46-72.81%) 77.46% (71.26-82.93%) 56.45% (47.82-64.87%) 2.6941 (2.4757-2.8892)
MutationTaster 84.51% (80.13-88.55%) 84.04% (78.53-89.25%) 85.32% (78.18-91.75%) 90.80% (86.05-95.00%) 75.61% (67.42-82.88%) 3.3578 (3.1879-3.5244)
PolyPhen-2 69.36% (64.31-74.41%) 78.72% (73.16-84.53%) 53.21% (43.59-62.50%) 74.37% (68.08-80.21%) 59.18% (49.47-69.01%) 2.6549 (2.4296-2.8672)
PROVEAN 58.59% (52.86-63.64%) 51.06% (43.78-57.73%) 71.56% (62.83-80.00%) 75.59% (68.61-82.81%) 45.88% (38.61-53.76%) 2.4410 (2.2263-2.6521)
SIFT 69.70% (64.65-74.75%) 81.91% (76.09-87.57%) 48.62% (38.89-58.62%) 73.33% (67.31-78.92%) 60.92% (51.14-71.64%) 2.6479 (2.4175-2.8681)
VEST 54.88% (49.49-60.27%) 71.81% (65.80-77.89%) 25.69% (18.01-34.19%) 62.50% (56.34-68.78%) 34.57% (24.99-45.21%) 1.9456 (1.7302-2.1701)
CanDrA (breast) 61.69% (55.89-66.78%) 97.85% (95.50-99.48%) 0% (0-0%) 62.54% (57.04-67.82%) 0% (0-0%) 1.6039 (1.5437-1.6593)
CanDrA (lung) 84.70% (80.50-88.65%) 79.12% (73.21-84.57%) 94.95% (89.81-98.94%) 96.64% (93.29-99.31%) 71.21% (63.41-78.30%) 3.4193 (3.2675-3.5628)
CanDrA (melanoma) 82.61% (77.94-86.64%) 78.09% (71.43-83.82%) 90.82% (85.06-96.00%) 93.92% (89.86-97.33%) 69.53% (61.10-77.05%) 3.3236 (3.1491-3.4780)
Condel 76.77% (72.05-81.48%) 93.09% (89.36-96.32%) 48.62% (39.62-58.33%) 75.76% (70.38-81.03%) 80.30% (70.58-89.55%) 2.9777 (2.7814-3.1877)
Based on the prediction results of non-neutral and neutral single nucleotide variants not present in the COSMIC database, the accuracy, sensitivity, specificity, positive predictive value (PPV), negative predictive value (NPV), and composite score for each predictor were computed. The 95% confidence intervals (CI) generated by bootstrapping are shown in parentheses.
Martelotto
et
al.
Genome
Biology
2014,
15
:484
Page
9
o
f
2
0
http://geno
mebiology
.com/2014/
files 15 and 16). On the other hand, FATHMM (cancer), MutationTaster, PolyPhen-2, PROVEAN, and VEST per-formed better for SNVs in oncogenes than in TSGs
(P<0.05). These results suggest that some of the
predic-tors showed preferential performance towards SNVs in either oncogenes or TSGs; alternatively, these differ-ences in performance may stem from the fact that there was a statistically significant difference in the proportion of
neutral SNVs in oncogenes as compared to TSGs (Fisher’s
exact test, two-tailed, P <0.0001). The same comparisons
could not be performed for SNVs affecting new cancer genes, as no evidence to support a neutral classification for SNVs affecting these genes was obtained in the literature search, reflecting the relative novelty of these SNVs.
Taken together, these results demonstrate that muta-tion effect predicmuta-tion algorithms are not equivalent for the classification of individual SNVs, that the predictions from some algorithms may be tumor tissue dependent, and that some may have a better performance for the identification of neutral than non-neutral SNVs.
Combination of mutation effect prediction algorithms
To evaluate whether combinations of single predictors would result in an improvement of the predictions made in this dataset, we generated 11,253 combinations by
usingn(n =2, 3, …11) single predictors at a time, with
a given mutation being considered non-neutral if at least
p(p =1, 2, …11) predictors called it non-neutral for all
combinations ofnandp.We computed the performance
statistics and their confidence intervals for each of these combinations from 1,000 random subsets comprising two-thirds and one-third of the total dataset (referred to
as ‘subset 1’ and ‘subset 2’, respectively; Additional file
17). We ranked the combinations based on mean accur-acy or based on mean composite score for subsets 1 and 2 separately, and compared their performance to the best-performing single and meta-predictors, respectively. Fur-thermore, as excluding SNVs not present in the COSMIC database had a significant impact on the performance of many predictors and their pairwise agreement, we also performed the same experiment using only non-COSMIC SNVs (Additional file 18).
Of the 11,253 possible single predictor combinations we evaluated using all SNVs, 1,854 predictor combina-tions were found to have a numerically higher mean ac-curacy in subsets 1 and 2 than the most accurate single predictor (that is, FATHMM (cancer)). Six of these combinations were concurrently significantly more ac-curate than the most acac-curate single predictor (that is, FATHMM (cancer)) in both subsets (Additional files 19, 20, and 21). When ranking the predictor combinations ac-cording to composite score, 1,483 combinations had nu-merically higher mean composite scores in subsets 1 and 2 than the composite score of the best single predictor
(that is, CHASM (lung)); five of these showed statistically significantly higher composite scores than those of CHASM (lung) in both subsets (Figure 3, Additional files 19 and 21). The mutation effect prediction algo-rithm combination that resulted in a significant increase in both accuracy and composite score as compared to the best single predictor and meta-predictor in both subsets was CHASM (breast) and MutationTaster. This predictor combination called a given SNV non-neutral if at least one of CHASM (breast) and MutationTaster called it non-neutral, and it was ranked first in terms of both accuracy and composite score in subsets 1 and 2 independently (in subset 1: 95.46%, 95% CI 94.54-96.51% and 3.6255, 95% CI 3.5584-3.6982; in subset 2: 95.43%, 95% CI 93.33-97.27%, and 3.6236, 95% CI 3.4841-3.7573, respectively; Additional file 21). Similar observations were made when SNVs found in the COSMIC database were excluded. Only the CHASM (breast) and MutationTaster predictor combination outperformed the most accurate single predictor MutationTaster consistently in both sub-sets (Figure 3; Additional files 19, 20, and 22).
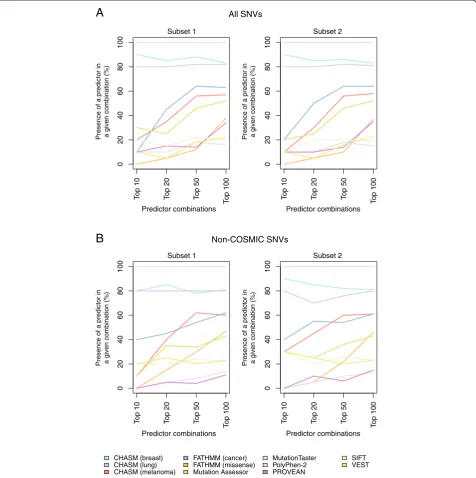
Although mutation effect prediction algorithm combi-nations had a relatively limited impact on accuracy and composite score, some predictor combinations signifi-cantly improved the NPV as compared to the best single and meta-predictor (Figure 3, Additional files 20, 21, and 22). Again, the CHASM (breast) and MutationTaster pre-dictor combination resulted in a significant improvement in NPV as compared to the NPV of the best single pre-dictor or the best meta-prepre-dictor in all subsets. When ana-lyzing the top 10, top 20, top 50, and top 100 combinations of mutation effect prediction algorithms, we noted that MutationTaster, CHASM (breast), and CHASM (lung) were consistently present in the top performing predictor combinations in subsets 1 and 2 using the 989 functionally validated SNVs, irrespective of whether the combination predictor performance was ranked according to accuracy or composite score (Figure 4; Additional file 23). When only the non-COSMIC SNVs were included in the ana-lysis, the same mutation effect prediction algorithms were consistently present in the best performing muta-tion effect predicmuta-tion algorithm combinamuta-tions (Figure 4; Additional file 23).
While the most consistently accurate predictor com-bination called a given mutation non-neutral in this dataset if at least one of CHASM (breast) and Mutation-Taster called it non-neutral, we also evaluated whether
there were optimal combinations of n and p. In both
subsets, for any givenn(1≤n≤4), the highest accuracy
was achieved whenp≈2n(Additional files 24 and 25 for
subset 1; data for subset 2 not shown). Similarly, for any
givenp(3≤p≤11), the optimalnwas approximatelyp/2
(Additional files 24 and 25 for subset 1; data for subset 2 not shown). Similar observations could be made for the
Martelottoet al. Genome Biology2014,15:484 Page 10 of 20
# 1 # 2 # 3 # 4 # 5 MutationT aster CanDrA (lung) Accur acy 0.0 0.2 0.4 0.6 0.8 1.0
# 1 # 2 # 3 # 4 # 5
Mutation Ta s te r CanDrA (lung) Composite 0 1 2 3 4
# 1 # 2 # 3 # 4 # 5
MutationT a ster CanDrA (lung) Sensitivity 0.0 0.2 0.4 0.6 0.8 1.0
# 1 # 2 # 3 # 4 # 5
Mutation Ta s te r CanDrA (lung) Specificity 0.0 0.2 0.4 0.6 0.8 1.0
# 1 # 2 # 3 # 4 # 5
MutationT a ster CanDrA (lung) PPV 0.0 0.2 0.4 0.6 0.8 1.0
# 1 # 2 # 3 # 4 # 5
MutationT a ster CanDrA (lung) NPV 0.0 0.2 0.4 0.6 0.8 1.0 # 1 # 2 # 3 # 4 # 5
MutationT a ster CanDrA (lung) Accur a cy 0.0 0.2 0.4 0.6 0.8 1.0
# 1 # 2 # 3 # 4 # 5
MutationT a ster CanDrA (lung) Composite 0 1 2 3 4
# 1 # 2 # 3 # 4 # 5
Mutation T aster CanDrA (lung) Sensitivity 0.0 0.2 0.4 0.6 0.8 1.0
# 1 # 2 # 3 # 4 # 5
MutationT a ster CanDrA (lung) Specificity 0.0 0.2 0.4 0.6 0.8 1.0
# 1 # 2 # 3 # 4 # 5
Mutation T aster CanDrA (lung) PPV 0.0 0.2 0.4 0.6 0.8 1.0
# 1 # 2 # 3 # 4 # 5
MutationT a ster CanDrA (lung) NPV 0.0 0.2 0.4 0.6 0.8 1.0
A
B
C
D
Subset 1 Subset 2
All SNVs
Subset 1 Subset 2
Non-COSMIC SNVs
#1: At least 1 of CHASM (breast), MutationTaster #2: At least 2 of CHASM (breast), CHASM (lung), MutationTaster, SIFT #3: At least 2 of CHASM (breast), CHASM (lung), Mutation Assessor, MutationTaster #4: At least 1 of CHASM (breast), CHASM (lung), MutationTaster #5: At least 1 of CHASM (lung), MutationTaster #1: At least 1 of CHASM (breast), MutationTaster
#2: At least 1 of CHASM (breast), CHASM (lung), MutationTaster #3: At least 1 of CHASM (lung), MutationTaster
#4: At least 2 of CHASM (breast), CHASM (lung), Mutation Assessor, MutationTaster #5: At least 2 of CHASM (breast), CHASM (lung), MutationTaster, SIFT
#1: At least 1 of CHASM (breast), MutationTaster #2: At least 1 of CHASM (breast), CHASM (lung), MutationTaster #3: At least 1 of CHASM (lung), MutationTaster #4: At least 2 of CHASM (breast), CHASM (lung), MutationTaster, SIFT #5: At least 2 of CHASM (breast), CHASM (lung), Mutation Assessor, MutationTaster #1: At least 1 of CHASM (breast), MutationTaster
#2: At least 2 of CHASM (breast), CHASM (lung), MutationTaster, SIFT #3: At least 1 of CHASM (breast), CHASM (lung), MutationTaster #4: At least 1 of CHASM (lung), MutationTaster
#5: At least 2 of CHASM (breast), CHASM (lung), Mutation Assessor, MutationTaster
# 1 # 2 # 3 # 4 # 5
CHASM (lung) CanDrA (lung)
Accur a cy 0.0 0.2 0.4 0.6 0.8 1.0
# 1 # 2 # 3 # 4 # 5
CHASM (lung) CanDrA (lung)
Composite 0 1 2 3 4
# 1 # 2 # 3 # 4 # 5
CHASM (lung) CanDrA (lung)
Sensitivity 0.0 0.2 0.4 0.6 0.8 1.0
# 1 # 2 # 3 # 4 # 5
CHASM (lung) CanDrA (lung)
Specificity 0.0 0.2 0.4 0.6 0.8 1.0
# 1 # 2 # 3 # 4 # 5
CHASM (lung) CanDrA (lung)
PPV 0.0 0.2 0.4 0.6 0.8 1.0
# 1 # 2 # 3 # 4 # 5
CHASM (lung) CanDrA (lung)
NPV 0.0 0.2 0.4 0.6 0.8 1.0 # 1 # 2 # 3 # 4 # 5
CHASM (lung) CanDrA (lung)
Accu ra c y 0.0 0.2 0.4 0.6 0.8 1.0
# 1 # 2 # 3 # 4 # 5
CHASM (lung) CanDrA (lung)
Composite 0 1 2 3 4
# 1 # 2 # 3 # 4 # 5
CHASM (lung) CanDrA (lung)
Sensitivity 0.0 0.2 0.4 0.6 0.8 1.0
# 1 # 2 # 3 # 4 # 5
CHASM (lung) CanDrA (lung)
Specificity 0.0 0.2 0.4 0.6 0.8 1.0
# 1 # 2 # 3 # 4 # 5
CHASM (lung) CanDrA (lung)
PPV 0.0 0.2 0.4 0.6 0.8 1.0
# 1 # 2 # 3 # 4 # 5
CHASM (lung) CanDrA (lung)
[image:11.595.56.539.87.698.2]NPV 0.0 0.2 0.4 0.6 0.8 1.0
Figure 3(See legend on next page.)
Martelottoet al. Genome Biology2014,15:484 Page 11 of 20
results generated by using only the non-COSMIC SNVs (Additional files 26 and 27 for subset 1; data for subset 2 not shown).
Taken together, the combination of mutation effect pre-diction algorithms resulted in a modest but significant im-provement in accuracy and composite score. It should be noted, however, that selected combinations of mutation effect prediction algorithms significantly improved NPV. This information can be instrumental in ruling out SNVs that should not be followed up experimentally and/or clinically, given that SNVs considered neutral by these combinations have a higher probability of being genuinely neutral than those called neutral by single predictors or meta-predictors individually.
Discussion
Here we demonstrated, by using a set of extensively
cu-rated,‘gold-standard’list of mutations, that mutation effect
prediction algorithms are not equivalent for the classifica-tion of individual mutaclassifica-tions, and that the agreement be-tween predictors is modest and dependent on the set of mutations and mutation effect type. The agreement be-tween cancer-specific prediction algorithms, which define driver versus passenger mutations, was more consistent than that of non-cancer-specific predictors, which differen-tiate pathogenic versus non-pathogenic mutations. Fur-thermore, we observed that the predictions made by some algorithms may be tumor tissue dependent, and that others may have a better performance for the identification of neutral than non-neutral mutations.
A comparative analysis of the functional predictions of 15 commonly used mutation effect prediction algorithms revealed distinct sensitivities, specificities, PPVs and NPVs when a dataset of functionally/experimentally assessed
mu-tations from sixbona fideoncogenes, six new cancer genes,
and three bona fideTSGs was tested. For instance, while
FATHMM (cancer) had the highest sensitivity (97.88%, 95% CI 96.87-98.82%) in the dataset analyzed, its specificity was limited (49.29%, 95% CI 41.08-57.24%). On the other hand, CHASM (breast) had good specificity (80.71%, 95% CI 73.33-87.12%) but limited NPV (57.07%, 95% CI 50.23-64.58%).
Most of the single predictors and meta-predictors dis-played very good PPVs, however their NPVs were found to be relatively low. Using a combination of single pre-diction algorithms, the combination of CHASM (breast) and MutationTaster resulted in a significant improve-ment in accuracy as compared to the accuracy obtained with the best single predictor and meta-predictor in the SNV dataset studied, however this increase was mod-est. Importantly, however, by using mutation effect pre-dictor algorithm combinations, we achieved substantial statistically significant improvements in NPV. Different combinations of individual predictors including CHASM (breast) and MutationTaster were repeatedly found to have a significantly higher NPV than the best single predictor and the best meta-predictor in this dataset, while at least maintaining equivalent accuracy and composite score. In the effort to sift through lists of mutations to identify bio-logically interesting candidates to take forward for func-tional experiments, NPV is an often-overlooked measure. A high NPV allows for the exclusion of passenger or neu-tral alterations with greater confidence, without the risk of losing truly pathogenic mutations called neutral/passenger by a given algorithm.
Our analysis further revealed that some mutation ef-fect prediction algorithms are dependent on the type of gene altered. In particular for the case of CanDrA
meta-predictor, as all but oneTP53SNVs were predicted to be
‘drivers’by all CanDrA algorithms (that is, CanDrA breast/
lung/melanoma), whereas all BRCA1 and BRCA2
muta-tions were predicted to be‘drivers’by CanDrA (breast) but
almost exclusively ‘passengers/no-call’ by CanDrA (lung/
melanoma). This suggests that some predictors are highly tissue-specific and users ought to employ predictors appro-priate for the tumor tissue type analyzed.
Our study has several limitations, despite using a set
of curated mutations inbona fideoncogenes, new cancer
genes, andbona fideTSGs. First, the dataset we employed
has a limited size, and neutral mutations were largely
de-rived from TSGs, in particularBRCA1andBRCA2, which
may have caused biases in the estimation of specificity and NPV. Importantly, however, unlike previous comparisons of mutation effect prediction algorithms, this study has
(See figure on previous page.)
Figure 3Performance statistics of the top five mutation effect prediction algorithm combinations as ranked by composite scores. Prediction results of the non-neutral (n = 849) and neutral (n = 140) single nucleotide variants (SNVs) in the entire dataset(A, B)and the non-neutral (n = 188) and neutral (n = 109) SNVs not present in the COSMIC dataset(C, D)are shown. Results are ranked according to the composite scores of each mutation effect prediction algorithm combination, and the corresponding accuracy, sensitivity, specificity, positive predictive value (PPV), negative predictive value (NPV), and composite score of the top five prediction algorithm combinations in subset 1(A, C)and subset 2(B, D)are plotted. Error bars represent the 95% CIs generated by 1,000 random samples of subsets 1 and 2. Red bars represent predictor combinations, blue bars single/ independent predictors, and orange bars meta-predictors. Blue stars: statistically significant improvement in composite score as compared to that of the best performing single/independent predictor; orange stars: statistically significant improvement in composite score as compared to that of the best performing meta-predictor; blue triangles: statistically significant improvement in NPV as compared to that of the best performing single/independent predictor; orange triangles: statistically significant improvement in NPV as compared to that of the best performing meta-predictor.
Martelottoet al. Genome Biology2014,15:484 Page 12 of 20
employed rather rigorous standards to define the mutation set to be analyzed, by leveraging functional evidence from an extensive literature search and database mining. Sec-ond, mutations may be context-dependent, in that they would only elicit a phenotype under particular circum-stances, such as genetic background. Hence, the number
of mutations considered of unknown or indeterminate sig-nificance was high. Third, a substantial number of neutral and non-neutral mutations was obtained from datasets re-lated to the impact of germline mutations. The actual im-pact of those mutations when they are found as somatic genetic alterations would require further investigation.
A
B
Subset 1 Subset 2
CHASM (breast) CHASM (lung) CHASM (melanoma)
FATHMM (cancer) FATHMM (missense) Mutation Assessor
MutationTaster PolyPhen-2 PROVEAN
SIFT VEST Predictor combinations Predictor combinations
Predictor combinations Predictor combinations
All SNVs
Non-COSMIC SNVs
Subset 1 Subset 2
Presence of a predictor in a given combination (%) Presence of a predictor in a given combination (%)
Presence of a predictor in a given combination (%) Presence of a predictor in a given combination (%)
0
2
04
06
08
0
1
0
0
To
p
1
0
To
p
2
0
To
p
5
0
T
op 100
0
2
0
4
0
6
0
8
0
100
T
op 10 Top 20 Top 50
T
op 100
02
0
40
60
80
100
T
op 10 Top 20 Top 50
T
op 100
0
2
04
06
08
0
1
0
0
To
p
1
0
To
p
2
0
To
p
5
0
T
[image:13.595.61.538.90.569.2]op 100
Figure 4Recurrence of individual mutation effect prediction algorithms in the top performing mutation effect prediction algorithm combinations ranked by composite score.The top 10, top 20, top 50, and top 100 combinations of prediction algorithms were defined using the non-neutral (n = 849) and neutral (n = 140) single nucleotide variants (SNVs) included in the entire dataset and ranked according to composite score. The frequency of each single mutation effect predictor present in these top combinations was determined in subset 1 and subset 2(A). The top 10, top 20, top 50, and top 100 combinations of prediction algorithms were defined using the non-neutral (n = 188) and neutral (n = 109) SNVs not present in the COSMIC database and ranked according to composite score. The frequency of each single mutation effect predictor present in these top combinations was determined in subset 1 and subset 2(B).
Martelottoet al. Genome Biology2014,15:484 Page 13 of 20
Fourth, given that some predictors display distinct perfor-mances according to the tumor tissue type and that some SNVs included in this dataset are preferentially found in
specific tumor types (for example, BRCA1 and BRCA2
mutations are more frequently found in breast and ovarian cancers), this dataset could theoretically favor mutation effect prediction algorithms that are breast cancer-specific. This was not observed, however, given that the best performing single predictors and meta-predictors were not breast cancer-specific. Fifth, the agreement between mutation effect prediction algo-rithms employing a low confidence category in addition to the neutral and non-neutral categories of SNVs is dependent on the cut-points chosen to define predictions of low confidence. It should be noted, however, that similar results for prediction algorithms with a pre-defined low confidence category were observed as compared to those where a low confidence category was defined employing a heuristic approach based on the original descriptions and online sources of the predictors. Sixth, CHASM (breast/lung/melanoma), FATHMM (cancer/missense), and PolyPhen-2 are algorithms that employed training sets in their development and validation. Given the
ap-proach employed to create the ‘gold standard’ dataset
used in this study, overlaps between our ‘gold standard’
dataset and the training sets employed for the develop-ment of these algorithms were inevitable. To minimize potential biases, we have performed all analyses after the removal of all functionally curated SNVs present in COSMIC; however, even after taking this step, a residual number of SNVs present in the original training sets remained (Additional file 28). When we compared the performance of these mutation effect predictors after the removal of SNVs present in COSMIC or in the ori-ginal training sets, we either observed no significant differences in their accuracy or a lower accuracy when COSMIC SNVs were removed (Additional file 29). Finally, although experimental validation is informative, it is not often definitive. In particular for neutral effects, it is plaus-ible that the results of such experiments are context dependent (that is, cell line or organism employed and the constellation of mutations already present in a given model). For instance, the true effect of some mutations may be conditioned by the genetic make-up (that is, quan-titative trait loci, epistasis) [31,32], be only effective in a particular developmental stage [33], or be species-specific [34]. On the other hand, non-neutral mutation effects do not necessarily imply causality with regards to an organis-mal level phenotype; many dozens of loss-of-function vari-ants exist in healthy humans [35].
Conclusions
Our study demonstrates that the challenges researchers face at the time of analyzing massively parallel sequencing
data to identify variants for further experimental studies are genuine. The information provided by mutation effect prediction algorithms is not equivalent. None of the algo-rithms analyzed here was found to deliver optimal accur-acy, sensitivity, specificity, PPV, and NPV in the mutation dataset studied. Mutation effect predictors are not equiva-lent for the classification of individual mutations. The performance of some of these predictors may be dependent on tumor tissue and mutation type (that is, canonical versus non-canonical mutations, neutral versus non-neutral muta-tions). Combinations of mutation effect predictors, albeit providing only modest but significant improvements in the overall accuracy when compared to individual predictors or meta-predictors, were found to result in substantially im-proved NPVs without compromising accuracy.
Materials and methods
Mutation sets
To standardize the procedure of compiling mutations that can be employed for the benchmarking of mutation
effect predictors, mutations affecting sixbona fide
onco-genes (BRAF, KIT, PIK3CA, KRAS, EGFR, and ERRB2),
whose mutations preferentially affect kinase domains, six
recently described cancer genes (DICER1, ESR1, IDH1,
IDH2, MYOD1, and SF3B1), whose mutations do not
affect kinase domains, and three bona fideTSGs (TP53,
BRCA1, and BRCA2) were retrieved from the TCGA
Pan-Cancer dataset by Kandothet al. [36] and from
stud-ies functionally testing mutations affecting these genes (Additional file 2). In addition, for TSGs, specific
data-bases were employed; for TP53, the IARC database
[29,37], and forBRCA1andBRCA2, the Universal
Muta-tion Database (UMD) [28,38,39]. This mining exercise re-sulted in the identification of 3,706 mutations, of which 3,591 were SNVs (Table 1, Additional file 2). Given that some mutation effect prediction algorithms (that is, PolyPhen-2, MutationTaster, CanDrA, and Condel) do not process dinucleotide or trinucleotide missense mu-tations, and to have the same number of mutations successfully analyzed by each predictor, we have only in-cluded SNVs for the purpose of creating a mutation dataset to benchmark mutation effect predictors. SNVs were also annotated based on their presence in the COSMIC dataset v68 [26].
Literature search
Literature search was performed by four of the authors (LGM, MRDF, YZ, SP) to identify experimental evidence of functional effects of each mutation. This strategy entailed the use of Boolean logic in combination with search engines such as PubMed, ScienceDirect, Google Scholar, and MEDLINE. Search terms were combined using Boolean (that is, AND, OR) and Adjacency (that is, NEAR) operators to create search statements as well
Martelottoet al. Genome Biology2014,15:484 Page 14 of 20
as to narrow and refine the search (for example, BRAF
AND V600E AND validation/function, ERBB2 AND
mutation NEAR kinase domain AND validation/func-tion). In addition, the references listed in the papers found were also scrutinized to aid the search of add-itional literature in support of the findings. For TSGs,
in addition to literature search, the IARCTP53functional
assessment dataset [29], UMD-BRCA1, and UMD-BRCA2 mutation databases [28] were employed to ascertain
whether specific missense mutations in TP53 would
be causative of Li-Fraumeni or Li-Fraumeni-like syn-drome or have been functionally assessed, and
muta-tions in BRCA1 and BRCA2 would be causative of
early onset breast and ovarian cancer syndrome, respect-ively (see below).
Oncogenes and new cancer genes
The sixbona fideoncogenes, namelyBRAF,KIT,PIK3CA,
KRAS,EGFR, andERRB2 and the six new cancer genes,
namelyDICER1,ESR1, IDH1,IDH2,MYOD1, and SF3B1
used for the present analysis were selected on the basis of the presence and the absence of a kinase domain, re-spectively, and the availability of studies investigating functionally the impact of mutations affecting these genes. In this literature search, direct functional evi-dence to determine whether a mutation was neutral (that is, passenger) or non-neutral (that is, pathogenic) was sought. The functional impact of SNVs affecting these 12 genes was categorized into six groups, namely: (1) Change in kinase, GTPase, or other enzymatic activ-ity (for example, RNase); (2) Effect in response to ligand/ substrate, impact on downstream effectors/pathways, or cell proliferation/survival, differentiation, apoptosis; (3) Ability to immortalize or transform human or murine cells (for example, MCF10A, BaF3, NIH3T3 cell lines) and/or anchorage-independent growth; (4) Response to
specific chemical/biological compounds, therapeutic
agents, or temperature; (5) Tumor growth/induction
in vivo (for example, xenografts, mouse/fish models), or
changes in the rates of progression-free or overall survival in pre-clinical models; and (6) Changes in genome (that is, aneuploidy), epigenome (that is, methylation), transcrip-tome (that is, splicing), miRNA biogenesis, or DNA/RNA binding affinity (Additional file 2). SNVs affecting these genes were considered non-neutral if there was literature evidence to support their impact on at least one of the mentioned categories. When the functional testing dem-onstrated no significant impact on the wild-type function of the protein in at least one functional category, and/or no evidence was found for other categories, the SNVs were classified as neutral mutations. SNVs for which no reliable functional evidence or conflicting evidence was found for any of the six categories, were regarded as uncertain.
Tumor suppressor genes (TSGs)
The IARC datasets‘TP53 germline mutations and family
history’and‘Functional assessment of p53 mutant
pro-teins in various experimental assays’(R17) [29,37] were
employed to ascertain whether specific mutations
affecting TP53 would be associated with the
develop-ment of Li-Fraumeni syndrome or Li-Fraumeni-like
syn-drome, and/or whether specificTP53 SNVs would result
in conserved wild-type function, loss of function, domin-ant negative activity, gain of function, and/or temperature
sensitivity in various systems and cell lines [29,37]. TP53
mutations strictly associated with Li-Fraumeni syndrome or Li-Fraumeni-like syndrome, and present in patients without additional germline mutations affecting cancer
causing genes (for example, PTEN, BRCA1, or BRCA2),
and/or meeting at least one of the above functional levels of evidence were considered non-neutral, whereas those mutations lacking an association with Li-Fraumeni syn-drome or Li-Fraumeni-like synsyn-drome or a functional
im-pact were considered neutral. The remainingTP53 SNVs
were considered uncertain. For BRCA1 and BRCA2, the
BRCA1 (4 February 2014 update) and UMD-BRCA2 (22 January 2014 update) mutation databases [28,38,39] were used to collect information on specific
BRCA1and BRCA2 mutations. Mutations with validated
functional evidence classified as ‘5 - Causal’ in the
data-base were classified as non-neutral in this study,‘1 -
Neu-tral’in the database were classified as neutral in this study,
and‘4 - Likely causal’,‘3 - UV’, and‘2 - Likely neutral’in
the database were classified as uncertain in this study.
Assessment of mutation effect predictors
We first tested the set of 3,591 SNVs using 15 prediction algorithms, including 11 single predictors and four meta-predictors or consensus classifiers (Additional file 1) using default settings. The single predictors included PROVEAN (v1.1.3) [14] and SIFT (Ensemble 66) [16] from [40], which
used the ‘PROVEAN Human Genome Variants’and
pro-vided both PROVEAN and SIFT results (default prediction cutoff of -2.5 and 0.05, respectively). For PolyPhen-2 (v2.2.2) [17], we employed the Batch Query Data tool from
[41], using the ‘HumDiv’classifier model (default
predic-tion categories). We used the downloadable version of CHASM (v1.0.7) [20] employing a cutoff of 0.3, which was selected as the approximate point of intersection of the dis-tributions of scores for the drivers and passengers from the
original study [20]. SNVs with scores ≤0.3 were classified
as ‘drivers’and those with scores >0.3 were classified as
‘passengers’. For CHASM, we selected classifiers specific to
breast cancer, melanoma and lung adenocarcinoma,
re-ferred to as‘CHASM (breast)’,‘CHASM (melanoma)’, and
‘CHASM (lung)’, respectively. We obtained VEST (v3.0)
[22] predictions from [42], employing a cutoff of 0.5. For VEST, given that no particular threshold was recommend
Martelottoet al. Genome Biology2014,15:484 Page 15 of 20