Technology (IJRASET)
©IJRASET 2015: All Rights are Reserved
156
Active Power Loss Minimization Using
Simultaneous Network Reconfiguration and DG
Placement with AGPSO Algorithm
K.Sandhya1,Venkata Supura Vemulapati2 1,2
Department of Electrical and Electronics Engineering
Annamacharya Institute of Technology and Sciences, Tirupathi, A.P, India
Abstract- This paper presents a new approach has been proposed to solve network reconfiguration in the presence of distributed generation (DG) in distribution system with an objective of minimization real power loss and improving voltage profile of the consumers connected to radial distribution network. Improper allocation of DG sources in power system would not only lead to increase power losses, but can also jeopardize the system action. The finest position of DG is needed for the minimization of losses and improving reliability and stability in power system. In order to overcome the drawbacks of mathematical optimization practices, soft computing algorithms have been actively introduced during the past decade. In this paper AGPSO algorithm is proposed to solve the network reconfiguration problem which gives optimal switching combination and also the same used to calculate the optimal size of DG to minimize power loss in the distribution system. Sensitivity study is used to recognize corresponding optimal location for installation of distributed generation (DG). The proposed method was examined on distribution network consisting of 33 and 69- bus radial distribution systems at different load levels to verify efficacy of the planned method, the outcome shows that the planned method is fast and effective.
Keywords – Distributed Generation, Reconfiguration, Harmony Search Algorithm, Sensitivity Analysis, Autonomous Groups Partical Swarm Optimization
I. INTRODUCTION
©IJRASET 2015: All Rights are Reserved
[image:3.612.205.410.133.255.2]157
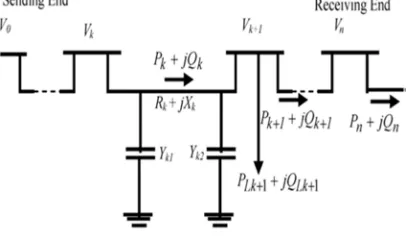
DGs, which are dependent on each other. Such a coordinated planning can provide maximum benefits for the network owner and/or the network users. A heuristic iterative search technique is developed that optimizes the weighting factor of the objective function and maximizes the potential benefit to the optimal DG placement.Fig. 1. Single-line diagram of a main feeder.
II. FORMULATION OF OPTIMIZATION PROBLEM
A. Power Flow Equations
The power losses in the distribution systems are real power loss and reactive power loss. The total real power loss (I2R loss) in a balanced distribution system consisting of b branches can be written as
= ∑ (1) Where is the branch current and R is the resistance of the branch of the network.
= + j* (2)
The branch current Iiis the active part of the branch Current and reactive part of branch current in the network can be obtained from the load flow solution of the network. The total I2R loss PLT can be separated in to two components PLA and PLR based on the
active and reactive components of branch currents. The power loss components can be defined as
= ∑ (3)
= ∑ (4) The power loss in the line section connecting buses and k+1 may be computed as
P Loss(k, k+1) = .
( )
| | (5)
The network reconfiguration problem in a distribution system is to find a best configuration of radial network that gives minimum power loss while the imposed operating constraints are satisfied, which are voltage profile of the system, current capacity of the feeder and radial structure of distribution system.
B. Power Loss Using Network Reconfiguration
The network reconfiguration plays a vital role in finding the radial operating structure in order to minimize the system power losses and at the same time maintaining operating constraints, such as voltage profile of the system, current carrying capacity of the feeder and radial structure of distribution system. After reconfiguration, the power loss in the line section with buses k and k+1 is calculated as follows
( , + 1) = ∙( + )
| | . (6)
The total real power loss of the all lines sections in n bus system ( , ) is calculated by adding up the losses of all line sections
Technology (IJRASET)
©IJRASET 2015: All Rights are Reserved
158
, = ( , + 1). (7)
C. Loss Reduction Using Network Reconfiguration
Net power loss reduction in the system is the variance of power loss before and after reconfiguration, that is equations (5) − (7) and is given by
∆ = , ( , + 1)− , ( , + 1). (8)
D. Power Loss Reduction Using DG Installation
Distributed generation units’ installation in optimal location of a distribution system results in various benefits. These contain Supplying peaking power to reduce the cost of electricity, reduce environmental emissions through clean and renewable technologies (Green Power), combined heat and power (CHP), high level of reliability and quality of supplied power and deferral of the transmission and distribution line investment through improved load ability are the major applications of the DG. Other than these applications, the major application of DG in the deregulated environment lies in the form of ancillary services.
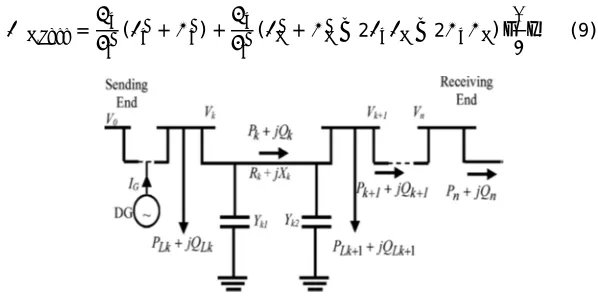
The power loss when a DG is installed at an arbitrary location, the power loss is given by,
[image:4.612.155.454.315.463.2], = ( + ) + ( + −2 −2 ) . (9)
Fig. 2. Distribution system with DG installation at an arbitrary location.
Net power loss reduction is the variance of equations (9) and (16) is given by,
∆ = , −
Δ = ( + −2 −2 ) . (10)
The positive sign of ∆ indicates that the system loss reduces with installation of DG. In difference the negative sign of ∆
denotes that DG origins the higher system loss.
E. Objective Function Of The Problem
The objective function of the problem is expressed to maximize the power loss reduction in distribution system while subjected to power balance constraints and power generation limit. Which is given by
Maximize the = max∙(∆ +∆ ) (11)
©IJRASET 2015: All Rights are Reserved
159
And feeder capability limits, ≤ , , } (12)
Generator operator constraints
≤ + ,
Radial structure of the system
det( ) = 1 −1( )
det( ) = 0( ) } (13)
Where the lower bound of bus voltage limits is and is the upper bound of bus voltage limits.
III. SENSITIVITY ANALYSIS FOR DG INSTALLATION
Sensitivity factor method is based on the principle of linearization of original nonlinear equation around the initial operating point, which helps to reduce the number of solution space. Loss sensitivity factor method has been widely used to solve the capacitor allocation problem [12]. Sensitivity factors [13] are evaluated at each bus to install DG units, firstly using the values obtained from the base case power flow. The fig shows a line impedance of + between k-1 and k buses connected to the load of , +
, . The active power loss in kth line as shown in equation [1].
Fig.3. connected line between bus k-1 and k
= [ ] × (14)
Where the branch current is and R is the resistance of line. In addition,
= , ,
,
∗
(15)
Where P, Q, V are the real power load and reactive power load, voltage at the receiving end. By substituting equation (15) in (14) as given follows, Active power loss in the -line between k-1 and k buses is given by,
= , + , (16)
The sensitivity factor of real power loss is obtained by differentiating equation (16) with respect to real power injection from DG at bus k which is given by as follows,
,
=2∗ , ∗ . (17)
Technology (IJRASET)
©IJRASET 2015: All Rights are Reserved
160
0 5 10 15 20 25 30 35
0.94 0.95 0.96 0.97 0.98 0.99 1 Node number N o d e v o lt a g e ( V p .u ) Voltage profile Without AGPSO With AGPso algorithm
0 5 10 15 20 25 30 35
0.91 0.92 0.93 0.94 0.95 0.96 0.97 0.98 0.99 1 1.01 Node number N o d e v o lt a g e ( V p .u ) Voltage profile Without AGPSO With AGPSO
0 10 20 30 40 50 60 70 80 90 100
16.48 16.5 16.52 16.54 16.56 16.58 16.6 16.62 16.64 16.66 iteration no. P o w e rl o s s Loss reduction
0 10 20 30 40 50 60 70 80 90 100
65 70 75 80 85 90 95 iteration no. P o w e rl o s s Loss reduction
IV. AUTONOMOUS PARTICLES GROUPS FOR PARTICLE SWARM OPTIMIZATION
In this paper, a modified particle swarm optimization (PSO) algorithm called autonomous groups particle swarm optimization (AGPSO) is projected to further improve the two problems of trapping in local minima and slow convergence rate in solving high-dimensional problems.
The main proposal of AGPSO algorithm is inspired by individual’s diversity in bird flocking or bug swarming. In natural colonies, individuals are not basically fairly parallel in terms of intelligence and ability, but they all do their duties as members of a colony. Each individual’s capability can be useful in a particular state. In this paper, a mathematical model of diverse particles groups called autonomous groups is proposed. In other words different functions with diverse slopes, curvatures, and interception points are employed to tune the group and cognitive parameters of the PSO algorithm to give particles different behaviors as in natural colonies. The results show that PSO with autonomous groups of particles outperforms the conventional and some latest modifications of PSO in terms of avoidance local minima and convergence speed. The results also show that dividing particles in groups and allowing them to have different individual and social thoughts can improve the performance of PSO considerably.
V. SIMULATION RESULTS FOR AGPSO ALGORITHM
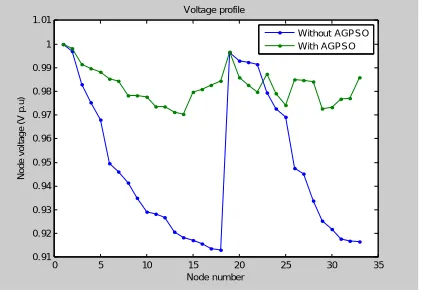
[image:6.612.287.501.344.493.2]The main idea is to get best combinations of open/closed switches and place an optimal size of DGs at sensitive buses so that the combined network must give minimum real power loss and improve the voltage profile in the system. The algorithm was developed in MATLAB and simulations are carried out.AGPSO algorithm with, and without for light and nominal, heavy load for IEEE 33 and 69-bus systems for improving voltage profile and loss reduction.
Figure 4:voltage profile of the 33-bus test system for light load(0.5) using with and with out AGPSO
[image:6.612.41.252.345.497.2]Figure 6: voltage profile of the 33-bus test system for nominal load(1.0) using with and with out AGPSO
Figure 5: loss reduction for 33bus test system for light load (0.5) using AGPSO algorithm
[image:6.612.296.505.529.685.2] [image:6.612.52.263.534.679.2]©IJRASET 2015: All Rights are Reserved
161
0 5 10 15 20 25 30 35
0.91 0.92 0.93 0.94 0.95 0.96 0.97 0.98 0.99 1 Node number N o d e v o lt a g e ( V p .u ) Without AGPSO With AGPSO
0 10 20 30 40 50 60 70 80 90 100
139.4 139.6 139.8 140 140.2 140.4 140.6 140.8 141 141.2 141.4 iteration no. P o w e rl o s s
0 10 20 30 40 50 60 70
0.96 0.965 0.97 0.975 0.98 0.985 0.99 0.995 1 Node number N o d e v o lt a g e (V p .u ) Voltage profile Without AGPSO With AGPSO
0 10 20 30 40 50 60 70 80 90 100
12.5 13 13.5 14 14.5 15 iteration no. P o w e rl o s s Loss reduction
0 10 20 30 40 50 60 70
0.9 0.91 0.92 0.93 0.94 0.95 0.96 0.97 0.98 0.99 1 Node number N o d e v o lt a g e ( V p .u ) Voltage profile Without AGPSO With AGPSO
0 10 20 30 40 50 60 70 80 90 100
[image:7.612.39.253.79.252.2]41.5 42 42.5 43 43.5 44 iteration no. P o w e rl o s s Loss reduction Figure 8: voltage profile of the 33-bus test system for heavy
[image:7.612.292.505.79.254.2]load(1.6) using with and with out AGPSO
[image:7.612.38.256.300.485.2]Figure 9: loss reduction for 33bus test system for heavy load (1.6) using AGPSO algorithm
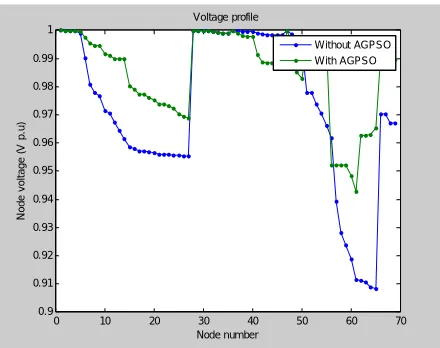
[image:7.612.313.527.306.486.2]Figure 10: voltage profile of the 69-bus test system for light load(0.5) using with and with out AGPSO
Figure 11: loss reduction for 69-bus test system for light load (0.5) using AGPSO algorithm
Figure 12: voltage profile of the 69-bus test system for nominal load(1.0) using with and with out AGPSO
Figure 13: loss reduction for 69-bus test system for nominal
[image:7.612.334.547.513.698.2] [image:7.612.35.255.515.689.2]Technology (IJRASET)
©IJRASET 2015: All Rights are Reserved
162
0 10 20 30 40 50 60 70
0.84 0.86 0.88 0.9 0.92 0.94 0.96 0.98 1 1.02 Node number N o d e v o lt a g e ( V p .u ) Voltage profile Without AGPSO With AGPSO
0 10 20 30 40 50 60 70 80 90 100
106 108 110 112 114 116 118 120 iteration no. P o w e rl o s s Loss reduction VI. CONCLUSION
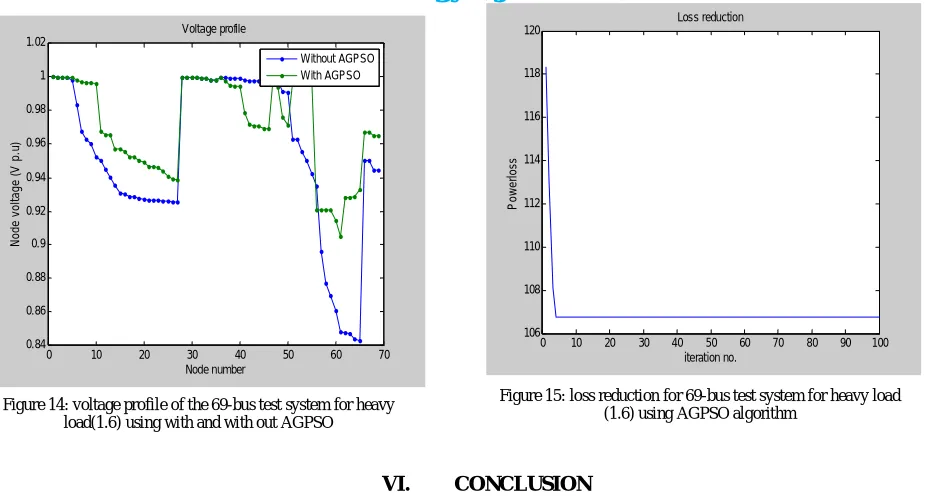
A new algorithm has been presented to solve the network reconfiguration problem in the presence of distributed generation (DG) for minimizing the real power losses. An AGPSO algorithm is used in the optimization process of the network reconfiguration and DG installation. The proposed method is tested on an IEEE test systems at different load levels, light, nominal and heavy. The results show that simultaneous network reconfiguration and DG installation method is more effective in reducing power loss and improving the voltage profile compared to other methods. The ratio of percentage loss reduction to DG size is highest when number of DG installation locations is three. In earlier approaches, network reconfiguration and DG placement in distribution networks are considered independently. However, in the proposed method network reconfiguration and DG installation are dealt simultaneously for improved loss minimization and voltage profile.
REFERENCES
[1] A. Merlin and H. Back, “search for a minimal-loss operating spanning tree configuration in an urban power distribution system,” in proc. 5th power system computation conf. (PSCC), Cambridge, U.K., 1975, pp.1-18.
[2] D. Shirmohammadi and H.W. Hong, “Reconfiguration of electric distribution networks for resistive line losses reduction,” IEEE Trans. power Del., vol. 4, no.
2, pp. 1498, Apr. 1989.
[3] S. Civanlar, J. Grainger, H. Yin, and S. Lee, “Distribution Feeder Reconfiguration for Loss Reduction”, IEEE Trans. Power Del., vol. 3, no. 3, pp. 1217-1223,
Jul. 1988.
[4] D. Das, “A Fuzzy Multi-Objective Approach for Network Reconfiguration of Distribution Systems”, IEEE Trans. Power Del., vol. 21, no. 1, pp. 202-209, Jan.
2006.
[5] K. Nara, A. Shiose, M. Kitagawoa, and T. Ishihara, “Implementation of Genetic Algorithm for Distribution Systems Loss Minimum Reconfiguration”, IEEE
Trans. Power syst., vol. 7, no. 3, pp. 1044-1051, Aug.1992
[6] J.Z. Zhu, “Optimal Reconfiguration of Electrical Distribution Network using the Refined Genetic Algorithm”, Elect. Power Syst. Res., vol. 62, pp. 37-42, 2002.
[7] C.Wang and M.H. Nehrir, “Analytical Approaches for Optimal Placement of Distributed Generation Sources in Power Systems”, IEEE Trans. Power syst., vol.
19, no. 4, pp. 2068-2076, Nov. 2004.
[8] G. Celli, E. Ghiani, S. Mocci, and F. Pilo, “A multi-objective evolutionary algorithm for the sizing and the sitting of distributed generation,” IEEE Trans. Power
syst., vol.20, no.2, pp. 750-757, May 2005.
[9] M. Damodar Reddy and Dr. V.C. Veera Reddy, “A two-stage methodology of network reconfiguration for the compensated network”, i-manager’s Journal on
Electrical Engineering, Vol-1, No-4, p.p. 22-29, April-June 2008.
[10] R. Srinivasa Rao, S.V.L. Narasimham, M.R.Raju, and A. Srinivasa Rao, “Optimal Network Reconfiguration of Large-Scale Distribution System Using
Harmony Search Algorithm”, IEEE Trans. Power Syst., vol. 26, no. 3, pp. 1080-1088, Aug. 2011.
[11] S. Ghosh and K. S. Sherpa, “An efficient method for load-flow solution of radial distribution networks,” Int. J. Elect. Power Energy Syst. Eng., vol. 1, no. 2, pp.
108–115, 2008.
[12] P.Prasad, A.V.Sudhakara Reddy, B.Bhargava Reddy "Power loss minimization in distribution systems using Network Reconfiguration with particle Swarm
Optimization" International journal of Engineering Science and Advanced Technology, vol.-5, issue-3, pp. 171-178, May-June 2015.
[13] N. Acharya, P. Mahat and N. Mithulananthan, “An Analytical Approach for DG Allocation in Primary Distribution Network”, Int. J. Electr. Power energy syst.,
[image:8.612.72.535.75.323.2]Figure 14: voltage profile of the 69-bus test system for heavy load(1.6) using with and with out AGPSO
©IJRASET 2015: All Rights are Reserved
163
[14] Z. W. Geem, J. H. Kim, and G. V. Loganathan, “A new heuristic optimization algorithm: Harmony search,” Simulation, vol. 76, no. 2, pp. 60–68, 2001.
[15] S. Das, A. Mukhopadhyay, A. Roy, A. Abraham, and B. K. Panigrahi, “Exploratory power of the harmony search algorithm: Analysis and improvements for
global numerical optimization,” IEEE Trans. Syst., Man, Cybern. B, Cybern, vol. 41, no. 1, pp. 89-106, 2011.
[16] M. E. Baran and F. Wu, “Network reconfiguration in distribution system for loss reduction and load balancing,” IEEE Trans. Power Del., vol. 4, no. 2, pp.
1401–1407, Apr. 1989.
[17] P. Agalgaonkar, S. V. Kulkarni, S. A. Khaparde, and S. A. Soman, “placement and penetration of distributed generation under standard market design,” Int. J.