1782
REAL-TIME RELIABILITY PREDICTION FOR THE MINE
LOGISTICS TRANSPORTATION SYSTEM BASED ON
MULTI-PERFORMANCE PARAMETERS DEGENERATION
1BAI XIAO-PING, 2QIAN TING
1
Assoc. Prof, School of Management, Xi’an University of architecture technology, Xi’an, 710055, China
2Master candidate, School of Management, Xi’an University of architecture technology, Xi’an, 710055,
China
E-mail: [email protected], [email protected]
ABSTRACT
The real-time reliability prediction problem of the mine logistics transportation system by applying multi-performance parameter degeneration method was studied. According to monitoring data, by analyzing performance degradation cases and correlation among some performance parameters of the studied system, this paper establishes a new reliability model about time-varying performance degeneration, analyzed in detail this model by the practical example, and gets some practical conclusions. Presented detailed methods and steps can offer the reference for real-time reliability prediction researches of the mine logistics transportation system.
Keywords: Reliability, Real Time Systems, Mine, Transportation, Logistics, Parameter Degeneration
1. INTRODUCTION
With the development of mining industry in our country, the mine bulk logistics transportation system which plays an important role in its developed process also obtained the considerable development and progress. At present, the researches of the mine bulk logistics transportation system mainly focus on logistics distribution and transportation path optimization of the system, and etc, but the reliability research of mine bulk logistics transportation is lack of study. Even if it is researched, the overwhelming majority only carries on the analysis by using the traditional reliability method and only considers the reliability effect of the system operating parameters without considering the effect of the degeneration of system components and equipment performance. The reliability refers to the ability of finishing stipulated function in stipulated conditions and time. The system reliability can be defined as the probability of the successful operation according to the design requirements under the condition of given time interval and environment. Successful operation should not only guarantee that system can work correctly and meet the functional requirements, but also guarantee that the performance of the certain service level.
2. THE DETAILED ANALYSIS OF SOME RELATED REFERENCES
1783 SVM in liaison with PSO is then applied to tackle reliability prediction problems based on time series data of engineered components [4]. The reference [5] proposes an enhanced parenting process, which consists of rigorous mathematical formulations and provides statistical inference on the failure rate of the new product [5]. The reference [6] describes the project to improve the reliability of remotely operated Water Hydraulic Manipulator (WHMAN) utilizing probabilistic methods, this work was done on an FMECA (Failure Methods, Effects and Criticality Analysis) performed on the WHMAN prior to starting this project. Furthermore, additional considerations regarding maintenance regime derived from the results of this project are presented [6]. The reference [7] introduces a probabilistic framework for fatigue life reliability analysis that addresses uncertainties that appear in the mechanical properties, service loads in terms of response-time history signal of a Belgian pave were replicated on a multi-axial spindle-coupled road simulator, a fatigue life probabilistic model of a stub axle was developed using Monte Carlo simulation where the stress range intercept and slope of the fatigue life curve were selected as random variables [7]. In [8], an enhanced Probabilistic Neural Network (PNN) algorithm is proposed where the Gaussian at each labeled point are not assumed to be spherical. Each of the Gaussians has a 'full' covariance matrix instead of simply assuming the Gaussian with a 'spherical' covariance matrix [8]. In [9], a neural network-based model for forecasting reliability was developed; a genetic algorithm was applied for selecting neural network parameters like learning rate (η) and momentum (μ), the input variables of the neural network model were selected by maximizing the mean entropy value [9]. In [10], the formal statement of the problem of constructing a real-time computing system that has a minimum number of processors is presented, a method for its solution using an iterative scheduling algorithm based on the method of simulated annealing is proposed, and an experimental study of the proposed algorithm is conducted [10]. In [11], a new method was proposed to evaluate reliability and predict lifetime using accelerated degradation data for high-reliability and long-life products, a general modeling approach based on time series for degradation path was analyzed [11].
By detailed analyzing these references, we find that the special studies aiming to real-time reliability prediction for the mine logistics transportation system are scarce. The basic idea of some related references is that the reliabilityofthe
new equipment is stable.However, the aging, wear or tear of the equipment will occur when it has been used for a long time, so the reliability of equipment and systems will gradually decline. Therefore, the real-time assessment and prediction of reliability is very important. In addition, as the time lengthening, the performance of the system continues to degenerate, this process is not only one of the performance parameters of the degradation, but there is more than one performance to occur degradation. In this article, we analyze the performance parameters degradation of the mine bulk logistics transportation system. According to the degradation process of the equipment and system, we analyze the reliability of the system to establish the reliability model based on multi-parameter degradation.
3. ESTABLISHING THE NEW
RELIABILITY MODEL ABOUT PARAMETER DEGENERATION
The degraded phenomenon due to intrinsic properties is called as performance degradation. At present the research about system reliability method based on the performance degradation often assumes that the system has single parameter degradation. In fact, there are often many performance parameters occurring degradation.
It is assumed that
y
i(
t
)
(
i
=
1
,
2
,
,
n
)
are nmonitored performance parameters in a mine transportation system, y (t) is the detected performance time-varying function. For studying the system reliability based on multiple performance parameter degradation, firstly we should distinguish whether these performance parameters are independent of each other or not. If they are, so we can look the system as a series system, its reliability R (t) is
{
}
}
)
(
{
}
)
(
{
}
)
(
{
)
(
,
,
)
(
,
)
(
)
(
2 2
1 1
, 2 2
1 1
n n
n n
D
t
y
P
D
t
y
P
D
t
y
P
D
t
y
D
t
y
D
t
y
P
t
R
≤
≤
≤
=
≤
≤
≤
=
(1)
Where
y
i(
t
)(
i
=
1
,
2
,
,
n
)
are the detectedperformance time-varying functions;
)
,
2
,
1
(
i
n
1784
)
(
))
(
),
(
),
(
(
}
)
(
{
}
)
(
{
}
)
(
{
)
(
0 0 0
2 1 2 2 1 1 2 1
t
dy
t
y
t
y
t
y
f
D
t
y
P
D
t
y
P
D
t
y
P
t
R
n D D Dn n n n
∫ ∫ ∫
=
≤
≤
≤
=
(2) The following matrix is used to judge whether the performance parameters are related or not. )) ( var( )) ( ), ( cov( )) ( ), ( cov( )) ( ), ( cov( )) ( var( )) ( ), ( cov( )) ( ), ( cov( )) ( ), ( cov( )) ( var( 2 1 2 2 1 2 1 2 1 1 t y t y t y t y t y t y t y t y t y t y t y t y t y t y t y n n n n n (3)
Where
cov(
y
i(
t
),
y
j(
t
))
is the covariance ofthe time-varying function, If
))
(
),
(
cov(
y
it
y
jt
=0, then the i performanceparameter and the j performance parameter are not related, else they are related.
In general case, we hypothesizes that the n degradation parameters obeys normal distribution.
The joint probability density function can be expressed as )] ( ) ( 2 1 exp[ ) 2 ( )
( 2 1
1
2
µ
µ
π
π Σ − − Σ −= − − − X X x f T (4) The system reliability can be shown as
) ( ) ( ) ( )) ( ), ( ), ( ( } ) ( { } ) ( { } ) ( { ) ( 2 1
0 0 0
2 1 2 2 1 1 2 1 t dy t dy t dy t y t y t y f D t y P D t y P D t y P t R n
D D D
n n n n
∫ ∫ ∫
= ≤ ≤ ≤ = (5)4. CASE STUDY
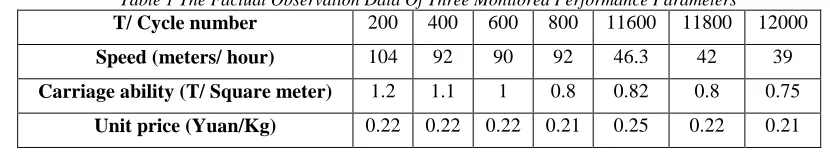
[image:3.612.100.515.356.432.2]This paper chooses the belt conveyor system in a real open pit mine as the research object; we selected three monitored performance parameters including speed, carriage ability, and unit price to be used to predict the real-time reliability, shown as the following table 1.
Table 1 The Factual Observation Data Of Three Monitored Performance Parameters
T/ Cycle number 200 400 600 800 11600 11800 12000
Speed (meters/ hour) 104 92 90 92 46.3 42 39
Carriage ability (T/ Square meter) 1.2 1.1 1 0.8 0.82 0.8 0.75
Unit price (Yuan/Kg) 0.22 0.22 0.22 0.21 0.25 0.22 0.21
[image:3.612.102.528.436.727.2]In order to look for the distribution regularity of above parameters, firstly, we find out the maximum and the minimum value in actual statistical data, divide data into some equal width intervals, and then calculate the frequency number and frequency of data falling into each interval. Take the transportation capacity as an example for distribution analysis, shown as table 2.
Table 2 The Calculated Frequency Number And Frequency In Each Interval
Class limits Frequency number fi
Frequency fi/n
0.7——0.75 3 0.05
0.75——0.8 4 0.0667
0.8——0.85 7 0.1167
0.85——0.9 9 0.15
0.9——0.95 14 0.2333
0.95——1.0 9 0.15
1.0——1.05 5 0.0167
1.05——1.1 4 0.0667
1.1——1.15 3 0.05
1.15——1.2 2 0.0333
Then, we can use Excel to draw the histogram distribution diagram. The function of the normal distribution histogram can be assumed as N
(
µ
,
σ
2) from the histogram, Then the probabilitydensity function is
2 2/2
) (
2
1
)
,
;
(
µ σσ
π
σ
µ
=
−x−e
x
f
(6)The Likelihood function is
∑
=
− ( − )2/2 22 1
)
2
1
(
)
,
;
,
,
,
(
µ σσ
π
σ
µ
n xin
e
x
x
x
L
(7)The Logarithmic function is
2
2
(
)
ln
ln 2
ln
2
2
i
x
n
L
π
n
σ
µ
σ
−
−
=
−
−
∑
(8)The Likelihood equations are
0
ln
=
∂
∂
µ
L
(
)
0
2
=
−
∑
σ
µ
ix
(9)0
ln
=
∂
∂
σ
L
(
)
0
3 2
=
−
+
−
∑
σ
µ
σ
ix
1785
∑
−∧
=
=
x
i/
n
x
µ
,
∑
− ∧
−
=
(
x
ix
)
2/
n
σ
=
µ
0.92,σ
=
0
.
11
(11)Then the performance parameters follow a
normal distribution: N(0.92,0.112).
Similarly, the distribution of the other parameters is respectively the Normal Distribution
N(78,222), N (0.22,0.012).
We can obtain the covariance matrix of three performance parameters by the MATLAB software, and also obtain the function curve of performance reliability of this mine transportation system by formula (5) shown as Figure.1.
Figure.1 The Function Curve Of Performance Reliability Of The Real Mine Transportation Systems
5. CONCLUSIONS
(1) According to detailed process and method presented in this paper, by the Figure 1 and MATLAB software, we can predict the real-time reliability degree is 0.98 when the operation cycle number is 9200; its value is 0.97 when the operation cycle number is 10800.
(2) It is shown from the data that with the increase of cycle number, its real-time reliability will decrease according to the certain rule. Therefore, we can flexibly adjust the bulk transportation plan to avoid affecting the normal production work. Presented detailed methods and steps can offer the reference for real-time reliability prediction researches of the mine logistics transportation system.
6. ACKNOWLEDGMENT
This work was supported in part by NSFC (59874019), Shanxi Province Education Department Research Project (12JK0803), Shanxi Province Key Discipline Construction Special
Fund Subsidized Project (E08001), Shanxi Province Natural Science Basic Foundation (2010JM7004).
REFRENCES:
[1] Venturini, Mauro ; Puggina, Nicola, “Prediction reliability of a statistical methodology for gas turbine prognostics”, Journal of Engineering for Gas Turbines and Power, v 134, n 10, 2012, 101601 ,pp.1-9.
[2] Zio, Enrico; Broggi, Matteo; Golea, Lucia R.; Pedroni, Nicola, “Failure and reliability predictions by infinite impulse response locally recurrent neural networks”, Chemical Engineering Transactions, v 26, 2012, pp. 117-122.
[3] Hao, Qing-Bo; Yang, Zhao-Jun; Chen, Chuan-Hai; Chen, Fei; Li, Guo-Fa, “Reliability prediction for NC machine tool based on interval AHP”, Journal of Jilin University (Engineering and Technology Edition), v 42, n 4, 2012, pp. 845-850.
[4] Lins, Isis Didier ; Moura, Morcio Das Chagas; Zio, Enrico; Droguett, Enrique Lopez, “A particle swarm-optimized support vector machine for reliability prediction”, Quality and Reliability Engineering International, v 28, n 2, , 2012, pp. 141-158
[5] Sanchez, Luis Mejia; Pan, Rong, “An enhanced parenting process: Predicting reliability in product's design phase”, Quality Engineering, v 23, n 4, 2012, pp. 378-387.
[6] Vayrynen, J. ; Mattila, J.; Vilenius, M.; Ali, M.; Valkama, P.; Siuko, M.; Semeraro, L. “Predicting the runtime reliability of ITER Remote Handling maintenance equipment ”, Fusion Engineering and Design, v 86, n 9-11, 2011, pp. 2012-2015.
[7] Asri, Y.M. ; Azrulhisham, E.A.; Dzuraidah, A.W.; Shahrir, A.; Shahrum, A.; Azami, Z. “Fatigue life reliability prediction of a stub axle using Monte Carlo simulation”, International Journal of Automotive Technology, v 12, n 5, 2011, pp. 713-719.
[8] Patel, Jiten ; Choi, Seung-Kyum, “An enhanced classification approach for reliability estimation of structural systems”, Journal of Intelligent Manufacturing, 2012, pp. 1-15 [9] Chatterjee, Snehamoy; Bandopadhyay,
1786 machine”, Expert Systems with Applications, v 39, n 12, 2012, pp. 10943-10951.
[10] Zorin, D.A. ; Kostenko, V.A. “Algorithm for synthesis of real-time systems under reliability constraints”, Journal of Computer and Systems Sciences International, v 51, n 3, 2012, pp. 410-417.