CHARACTERISTIC ANALYSIS OF CURRENT SPECTRUM
ON SHEARER CUTTING LOAD
ZHIPENG XU
Jiangsu Jianzhu Institute, College of Mining and Transportation Engineering, Xuzhou, China
E-mail: xuzhipeng1984@163.com
ABSTRACT
According to the disadvantages of former shearer cutting load measuring method and its low anti-interference ability, this paper proposes a new shearer cutting load measuring method based on the current spectrum. On the basis of load analysis of shearer cutting unit drive system, the theoretical models are established between cutting load and cutting motor current. Simulated load test to the electric haulage coal shearer on the motor load simulation test bed in Xi'an Coal Mining Machinery Co. Ltd Electrical Branch, and using the wavelet analysis theory to do wavelet decomposition and reconstruction on the test data. On load analog signal and the current reconstruction signal performed a time-frequency analysis. The results show that: (1) Cutting current signal in the time domain lags behind the cutting load change. In the frequency domain the two are corresponding relationship and has a very strong correlation. The correlation coefficient is 0.8853. (2) Current RMS signal reflect the cutting load change that mainly concentrated in the t frequency band less than 10Hz. Hence, it is not easy to be interfered by the power fluctuations and coal impact. The frequency of MG900/2210-WD is 1.63Hz. (3) The wavelet decomposition can effectively filter the current signal in the high frequency interference. After the reconstruction of wavelet, low frequency current signals can be got easily.
Keywords: Shearer, Current Spectrum, Wavelet Analysis
1. INTRODUCTION
How to accurately inform the cutting load changes in the shearer working process is the important guarantee to prevent mechanical and electrical components of shearer to be damaged, realization of adaptive high and automatic control of shearer and achieve the target of less humanized and unmanned on coal mining face. In the past the domestic and foreign scholars has done a lot of research on the cutting load measurement. The main methods can be divided into: Cutting tooth stress analysis and force analysis of rocker arm cylinder. In the cutting tooth stress analysis, early in the last century 80's , Britain began to study roller height adjustment system based on the stress of cutting teeth (Pick force Steering System). P.E.Issoire proves its feasibility and reliability in his research test in the University of Bath [1]-[3]. Then the U.S. Bureau of Mines researched deeply on the methods, and use adaptive identification algorithm to process data of cutting tooth stress [4]-[6]. But because the strength of cutting teeth is not enough and signal output problems, the system has been in the research stage and has not yet reached the requirements of industrial production. Professor
Section 2 gives a load analysis of the shearer cutting unit. In section 3, we get the relationship between cutting load and cutting current. Section 4 shows the test platform of this paper. Section 5 gives the parameters selection of load simulation. Section 6 analyses the current signal in the time-frequency. Section 7 reconstructs the cutting current signal using wavelet the theory. Section 8 analyses the correlation of the current signal and cutting load. At last, section 5 gives a conclusion to the whole paper.
2. LOAD ANALYSIS OF CUTTING UNIT
As shown in figure 1, its diagram of drive system of shearer cutting unit mainly includes the AC asynchronous motor, coupling, bearing and gear. In addition to the cutting load, the drive system also has the system inertia load and system friction load. The system inertia load includes motor inertia, gear inertia and load inertia. The friction load system includes bearing friction load and reverse electromagnetic force load. Therefore following equation can be achieved:
c f
e T T
dt d J
T = ω+ +
(1)
Where Te is the motor torque; J is the system
inertia; ω is the motor angular velocity; Tf is the
[image:2.612.334.520.213.298.2]system friction torque; Tc is the cutting load torque.
Figure 1: Transmission System of Shearer Cutting Unit
In the case that the motor speed is constant, then
the dω/dt = 0, the equation (1) can be simplified to:
c f
M T T
T = + (2)
3. THE THEORETICAL MODELS OF
CUTTING LOAD AND CURRENT
Firstly, we establish the mathematical model of asynchronous motor. Here make the following assumptions: (1) A stator and rotor three-phase winding are completely symmetrical, the magnetic potential in the gas gap space meet sine
distribution. (2) Not consider the influence of iron core vortex in the stator and rotor, saturated and hysteresis loss. The self-inductance and the mutual inductance of each winding are linear. (3) This paper ignores the effect of frequency and temperature on the motor parameters [9]-[10]. The equivalent circuit of asynchronous motor according to the magnetic field direction of the stator under α-β coordinate is shown in figure 2.
is
Rs Lsl Lrl ir
Rr
us
dt dψs
Lm
dt dψr
r r jωψ
Figure 2: Vector Equivalent Circuit of Asynchronous Motor Under α-β Coordinate
In figure 2, Rs, is, ψs, Lsl, us are the resistance of stator, current, flux, leakage inductance, voltage vector. Rr, ir, ψr, Lrl, urd are resistance, current, flux, leakage inductance, voltage vector which are
converted from the stator. Lm is mutual inductance
of the rotor; ωr is the speed of motor. Flux equation
ofasynchronous motor under α-β coordinate:
= β α β α β α β
ψ
ψ
ψ
ψ
r r s s r m r m m s m s r r s sa i i i i L L L L L L L L 0 0 0 0 0 0 0 0 (3)In this equation, ψsα, ψsβ, ψrα, ψrβ, isα, isβ, irα, irβ, respectively, the stator flux, rotor flux, component of stator current, component of rotor current in the
α- axis and β-axis. Ls is the inductance of the stator
and Lr is the inductance of therotor.
Electromagnetic torque of asynchronous motor is produced by the interactions between current and
magnetic. The stator, rotor flux and the excitation
flux are synthetized by the magnetic field which is
produced by the stator and rotor currents. The same
vector cross product is zero. Therefore, the electromagnetic torque can be represented by cross product of the stator and rotor current:
)
(
2
3
r s m pe
n
L
i
i
T
=
×
(4)In which, np is the number of pole pairs.
[image:2.612.95.301.437.559.2])
(
2
3
β α βα s s r
r m p
e
n
L
i
i
i
i
T
=
−
(5)
Combined with the equation (3), the above equation can be rewrite as follows:
− == − = ) ( 1 ) ( 1 β β β α ψ ψ s s s m r sa s sa m r i L L i i L L i (6)
Put the equation (6) into (5) it can be got as follows: ) ( 2 3 β α α
β
ψ
s sψ
ss p
e n i i
T = − (7)
Combine the (1) with (7) it can be got as follows:
f s s s s p
c
n
i
i
T
T
=
(
−
)
−
2
3
β α α
β
ψ
ψ
(8)
Equation (8) is the relationship between the cutting load and motor current. But the type is got under condition of the motor running at constant speed, and type contains changing flux and friction torque. Therefore, there is a need for further verification on the equation through experiments.
4. TEST PLATFORM
In order to demonstrate the relationship between cutting the load current and cutting, The author conducted a simulation loading test on the motor load simulation test bed in Xi'an Coal Mining Machinery Co. Ltd Electrical Branch, sampled, processed and analyzed the three-phase current cutting motor. To find the relation between the cutting current and the cutting load. Test platform Motor load simulation test table as shown in figure 3.
Figure3: Structure of Motor Load Simulation Test-Bed
In this figure, the solid line is the power lines.
The dotted line is the control circuit. Thick solid
line is the motor connecting shaft. It is can be seen from the figure that simulated load of the cutting motor is provided by the separately excited DC motor. Keep the power of DC motor constant, and
then the motor flux is constant. At this time output
torque and armature current of DC motor is shown as the linear relationship. Armature current of DC motor is provided by the DC exchange device. DSP data processor can get load torque through controlling the output current of DC exchange device.
5. PARAMETERS SELECTION OF LOAD
SIMULATION
In the motor load simulation test, the main parameter is fluctuation frequency of the load. The previous study shows that cutting load fluctuation frequency is mainly concerned with number of helical blade head, blade overlap angle, drum plate pick and the speed of cutting motor. The traction speed of shearer has no effect on the Fluctuation frequency; only affect the amplitude and mean of the wave [11]-[12]. The load fluctuation frequency
f1 (Hz) generated by the number of helical blade
head:
60 1
nN
f = (9)
In the equation above, n is roller speed with the
unit r/min; N is the number of helical blade head.
The load fluctuation frequency f2 (Hz) generated by
the blade overlap angle:
β π β π 30 2 60 2 n n
f = ⋅ = (10)
In the equation above, β is the central angle
between the adjacent blades, and the unit is rad.
The load fluctuation frequency f3 (Hz) generated by
the drum plate pick of the roller:
θ
π
θ
π
30
2
60
3n
n
f
=
⋅
=
(11)In the equation above, θ is the central angle
between the adjacent pick of drum plate, the unit is rad.
Usually, the value of f1 is below 10Hz, as the
low frequency component of cutting load. The value of f2、f3 is greater than f1, but generally is below 100Hz, as the intermediate frequency
component of the cutting load. In addition, because
pick showed as saw tooth wave changes in the process of cutting. Changes of the frequency depend on the sticky brittle of coal, development level of fracture, cutting speed and pick geometry, generally about a few hundred Hz, as the intermediate high component of the cutting load. In the actual work process, low-frequency components are the main part of cutting load. The fluctuation amplitude of intermediate frequency and high frequency components is very small. Therefore, the test only simulated the low and intermediate frequency components of load fluctuations. Take electric haulage coal shearer of MG900/2210-WD of Xi'an Coal Mining Machinery Co., Ltd as
example, (n=24.4 r/min, N=4, β=0.59 rad, θ=0.31
rad, it can get f1 =1.63Hz,f2 =4.31Hz,f3
=8.13Hz.
In this test, put the voltage output signal of the DSP as the control object. Load analog signal contains the frequency 1.63Hz, 4.31Hz, 8.13Hz, corresponds to the amplitude of 5V, 1V, 0.5V sine wave. Time-frequency characteristic of load analog
signal is shown in figure 4. From the figure it can
[image:4.612.102.290.393.696.2]be seen that 1.63Hz low frequency components is the main components of the analog signal.
Figure 4: Time-Frequency Characteristic of Load Simulative Signal
6. THE TIME-FREQUENCY ANALYSIS OF
THE CURRENT SIGNAL
Studies have shown that frequency components of motor single-phase current signal do not include the frequency of the load. Changes of the amplitude of motor current signal show changes of the load [13]. Commonly use root mean square (RMS) of three-phase alternating current to represent the
amplitude changes of individual current. Suppose Iu,
Iv, Iw show U, V, W, three-phase current of AC
motor respectively.
3 / )
( 2 2 2
w v u
rms I I I
I = + + (12)
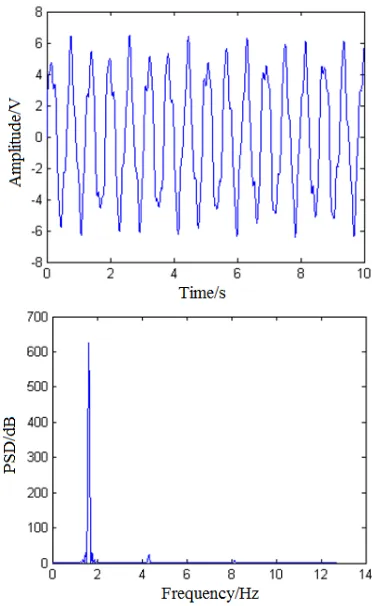
Figure5: Time-Frequency Characteristic of Cutting Motor RMS Current
Time-frequency characteristic of cutting motor RMS current collected by DSP is shown in figure 5. From the power spectrum density can be seen that value of the RMS current contains multiple
frequency components which include the f1 and the
second, third, fourth harmonic; f2 and the second,
fourth harmonic; f3 and its four, eight harmonics.
The load fluctuation frequencyf1 generated by the
current signal to extract corresponding part with the cutting load.
7. WAVELET RECONSTRUCTION OF
CURRENT
The RMS current of the cutting motor not only
includes f1、 f2、f3 and its harmonic components,
but also has noise signal caused by the time-varying nonlinear friction torque. Therefore it requires to
filter and then extract the signal of f1 frequency
band that can reflect the changes of load fluctuation mostly. The traditional low-pass filter can’t distinguish useful high-frequency signal with high frequency caused interference by noise effectively. There will be residual noise and useful signal is filtered off [14]-[15]. Wavelet analysis is that using automatic transform of scale and dimension to analyzes and process the non-stationary signals can save the peak and mutation of useful signals [16]-[17]. So this paper uses wavelet analysis to find signal of RMS current that is correspond with cutting load and extract its features.
Figure 6: Frequency Characteristic of RMS after Wavelet Decomposition
Frequency of signal that can reflect the cutting load fluctuation well is 1.61Hz. Therefore, according to the sampling theorem, set the sampling frequency of signal in the test is 80Hz, and then the Nyquist frequency is 40Hz. In this paper, use db2 wavelet to decompose the RMS current signal for 6-layer, and then get 7 frequency band. It is known that the required 1.61Hz is located on the 5th layer that is 1.25 ~ 2.5Hz bandwidth by calculating.
[image:5.612.322.521.347.503.2]From each layer’s power spectrum density of figure 6, it can be seen that frequency characteristic of the 5th layer signal after wavelet decomposition is the same as the load analog signal. Therefore, use RMS current signal to do wavelet reconstruction by using low-frequency and high frequency part of the 5th layer. The result of reconstruction is shown in Figure 7. As can be seen from Fig, through the wavelet reconstruction RMS current signal can reflect the changes of cutting load well in the time domain.
Figure 7: Corresponding Relationship of Cutting Load Signal and Wavelet Decomposed RMS Current Signal
8. THE CORRELATION ANALYSIS OF
THE CURRENT SIGNAL AND CUTTING LOAD
As shown in figure 7, RMS current signal is the delay signal of cutting load in the time domain. Usually, cross-correlation function is used to describe statistical properties of the two signals in the time domain (mainly lag).Set expression of two
signals as x(t), y(t), then their cross-correlation
coefficient R (x,y) can be expressed as:
) , ( ) , (
) , ( ) , (
y y C x x C
y x C y x
R =
(13)
[image:5.612.103.302.363.683.2]reconstruction and cutting load signal is 0.8853. It shows that two signals are highly correlated.
9. CONCLUSION
This paper establishes theoretical models between cutting load and the cutting motor current based on the analysis of the cutting unit transmission system of the shearer, and the operation of the simulation load test to the electric haulage coal shearer on the motor load simulation test bed in Xi'an Coal Mining Machinery Co., Ltd Electrical Branch. Based on the wavelet analysis theory, the test data is used to do the wavelet decomposition and reconstruction,and based on conducting a correlation analysis of the signal. The analysis result shows that: (1) the cutting current signal lags behind the cutting load change in the time domain. But in the frequency domain, the two have correlation, and have a strong correlation, the correlation coefficient is 0.8853. (2) Cutting RMS current signal can reflect changes of the cutting load, and is concentrated in the low-frequency band less than 10Hz. So it isn’t easy to be interfered by the power fluctuations and coal impact. The frequency of MG900/2210-WD Shearer is 1.63Hz. (3) Wavelet decomposition can filter out the high-frequency interference from current signal effectively; extract the required low-frequency current signal through the wavelet reconstruction.
REFRENCES:
[1] Poepke W. W., Church J. C., “Measuring
in-seam coal cutting forces”, Mining Engineering, Vol. 35, No. 9, 1983, pp. 1281-1286.
[2] Reina Peter, “Using pick forces to steer
shearers could bring autosteering to the U. S.”, Coal Age, Vol. 92, No. 8, 1987, pp. 58-59.
[3] Omar Selim Idriss, “Vibration effects on
pickforce sensing”, Montreal: McGill
University, 1991.
[4] Mowrey G. L., Maksimovic S. D., Pazuchanics
M. J., “Staying in the seam: an overview of coal interface detection and steering”, Engineering and Mining Journal, Vol. 193, No. 8, 1992, pp. 26-29.
[5] Idriss O. S., Dimitrakopoulos R., Edwards J.
B., “The effect of orderly vibration on pickforce sensing”, International journal of surface mining & reclamation, Vol. 9, No. 3, 1995, pp. 83-88.
[6] Darren W. Holman, “Development of an
underground automated thin-seam mining
method”, Virginia: Virginia Polytechnic
Institute and State University, 1999.
[7] CHEN Yan-kang, ZHANG Wei, LIAN
Zi-sheng, LI Wen-ying, “Coal-rock interface detection based on cutting force analysis”, Colliery Mechanical & Electrical Technology, No. 3, 1991, pp. 80-83.
[8] LEI Yu-yong, YIN Zheng-xi; QIAN Hua,
“Study on hydraulic automatic ranging cutting height of shearer”, Journal of Chongqing University, Vol. 17, No. 1, 1994, pp. 52-58.
[9] B. K. Bose, “Modem power electronics and AC
drivers”, Englewood Cliffs NJ: Prentice-Hall, 2001.
[10] Zaid S. A., Mahgoub O. A., El-Metwally K. A.,
“Implementation of a new fast direct torque control algorithm for induction motor drives”,
IET Electric Power Applications, Vol. 4, No. 5, 2010, pp. 305-313.
[11] LIU Chun-sheng, ZHANG Cai; ZHAO
Hong-bei, “Drum axial force analysis and
quantitative estimation of shearer”, Coal Mine
Machinery, No. 6, 1998, pp. 14-17.
[12] LIU Song-yong, DU Chang-long, CUI Xin-xia,
“Research on the cutting force of a pick”,
Mining Science and Technology, Vol. 19, No. 4, 2009, pp. 514-517.
[13] LIU Xiao-sheng, WU Le-nan; MA Yu-lin, et
al., “Study on detection of chatter for milling
based on current signal”, Chinese Journal of
Mechanical Engineering, Vol. 36, No. 4, 2000, pp. 25-29.
[14] Barros J., Diego R. I., “Analysis of harmonics
in power systems using the wavelet-packet
transform”, IEEE Transactions on
Instrumentation and Measurement, Vol. 57, No. 1, 2008, pp. 63-69.
[15] Watson S. J., Xiang J. P., Yang W., Tavner P.
J., et al., “Condition monitoring of the power output of wind turbine generators using
wavelets”, IEEE Transactions on Energy
Conversion, Vol. 25, No. 3, 2010, pp. 715-721.
[16] Eren L., Devaney M. J., “Bearing damage
detection via wavelet packet decomposition of
the stator current”, IEEE Transactions on
Instrumentation and Measurement, Vol. 53, No. 2, 2004, pp. 431-436.
[17] Mandrekar R., Swaminathan M., “Extraction of
noise current signatures using wavelets in
packaged digital systems”, IEEE Transactions