ISSN: 1992-8645 www.jatit.org E-ISSN: 1817-3195
EXPERIMENTAL DESIGN OF CAPACITANCE REQUIRED
FOR SELF-EXCITED INDUCTION GENERATOR
1 V. SANKARDOSS 2 S. P. SABBERWAL 3 K. RAJAMBAL
1Assistant Professor, School of Electrical Engineering, VIT University, Vellore, India.
2
Professor, School of Electrical Engineering, VIT University, Vellore, India.
3
Professor, Electrical and Electronics Engineering Department, Pondicherry Engineering College,
Puducherry, India.
E-mail: [email protected] [email protected] [email protected]
ABSTRACT
This paper presents the no-load practical synchronous speed characteristics of a laboratory model induction machine of 120 W capacity. Critical, minimum and maximum capacitance required for excitation are calculated from the no load curve for voltage buildup, rated voltage and current respectively; at various super synchronous speeds. A realistic model of the machine is presented on Matlab/Simulink. Theoretical and practical results are compared for model validation.
Keywords: Excitation Capacitance, Magnetization Curve, Synchronous Speed Test, Self-Excited Induction Generator, Wind Energy
1. INTRODUCTION
Electrical energy is vital in every aspect of our day-to-day life. Keen interest is taken in all possible sources of energy from which it can be generated. Our industrialized economic system depends heavily on fossil energy sources such as oil, gas, hydro, coal and nuclear. We will exhaust these valuable assets in a matter of few tens of years in case of oil and few hundred years for coal. Unfortunately, both coal and nuclear energy present serious environmental hazards.
In recent times, there has been a considerable upsurge in exploring new ways to supply energy from renewable energy sources. Wind energy is one of the most important and promising sources of renewable energy all over the world. It is non-polluting and economically viable and has very large potential. An upper limit for the utilization of earth’s wind power supply is estimated to be 1.3×10¹³ kW. It is predicted that nearly 10% of the world energy needs could be met by the wind energy by the year 2020 [1].
The wind turbine converts mechanical power into electrical power. This can be accomplished by an electrical generator which can be a DC machine, a synchronous machine, or an induction machine. DC machine was used widely until 1980s, in smaller power installation below 100 kW, because of its extremely easy speed control. The presence of
commutators in DC machines contributes to low reliability and high maintenance costs.
The second kind of electric generators are synchronous generators, suitable for constant speed systems. Requirement of DC field current and reduced wind energy capture of constant speed systems are its disadvantages as compared to variable speed systems.
Another choice for the electric generator is a permanent magnet synchronous generator. But PMSGs suffer from uncontrollable magnetic field decaying over a period of time. Their generated voltage tends to fall steeply with load and is not suitable for isolated operation.
The other alternative is induction machines of wound and squirrel cage rotor type. Wound rotor machine can produce high starting torque and is the preferred choice in grid-connected wind generation schemes. Squirrel cage rotor construction is popular because of its ruggedness, low maintenance requirements, reliability, low cost, simplicity of construction and good transient performance. This is widely used in stand-alone wind power generation schemes [2].
ISSN: 1992-8645 www.jatit.org E-ISSN: 1817-3195
machine is driven by a prime mover, the residual magnetism in the rotor produces a small voltage that causes a capacitive current to flow. The resulting current provides feedback and further increases the voltage. It is eventually limited by the magnetic saturation in the rotor. Variable capacitance is required for self-excited induction generator [3-5]. These machines are available in the ranges of fractional horse power to multi-megawatt capacity.
The steady-state performance of a self-excited induction generator has been modelled; one is the per-phase equivalent circuit model using loop impedance method [6, 7] and nodal admittance method [8, 9]. The second d-q axis equivalent circuit model is based on different reference frames and generalized machine theory [10-12]. The per phase equivalent circuit model is obtained from a steady state condition and can not be used for transient condition.
This paper clearly demonstrates the calculation of the critical, minimum and maximum value of capacitance required for self-excitation of induction generator using synchronous speed test. The dynamic performance of the self-excited induction generator is analyzed with and without load conditions. Experimental results of voltage built-up process obtained from a practical 120 W induction machine are also presented for validation.
2. DESIGN OF EXCITATION CAPACITANCE
2.1. Synchronous Speed Test
The no load saturation curve of the machine is obtained at normal rated frequency. The voltage source is applied to the stator of the induction machine while its rotor is driven by the dc motor at a constant speed corresponding to the synchronous speed of the machine.
[image:2.612.313.522.93.287.2]It is customarily assumed that the magnetizing current is the difference between stator current and rotor current referred to the stator. In the present case the slip is very small (practically zero) which implies that the magnetizing branch current is essentially equal to no load current. The no load test single phase equivalent circuit as shown in Fig. 1.
Fig. 1: No Load Test Single Phase Equivalent Circuit
The rms magnetizing branch voltage is given by
n1 m
1
X
I
E
=
(1)1 1 1
3 /
n n n
Z V
I = (2)
(
1 m)
1 1
n R jX X
Z = + + (3)
(
)
21 2 1 2
1 m
n R X X
Z = + +
(4)
The magnetizing reactance is given by
1 2 1 2
1 )
(Z R X
Xm = n − −
(5)
1 1 2 1 2 1
1 (Zn R ) X In
E = − −
[image:2.612.316.535.345.478.2](6)
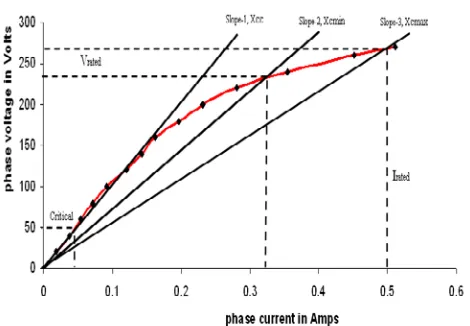
[image:2.612.315.550.506.669.2]Fig. 2 shows circuit details of synchronous speed test. The performance details are presented in Fig.3. The capacitance required to generate voltage is calculated from the slope of the curves.
Fig. 2: Circuit Diagram For Synchronous Speed Test
Fig. 3: No Load Characteristics Of Induction Machine X1
R
Xm In1
E1 Vn1/√
3
[image:2.612.89.303.637.718.2]ISSN: 1992-8645 www.jatit.org E-ISSN: 1817-3195
2.2. Determination Of Excitation Capacitance
2.2.1 Critical capacitance (Ccri)
Xcc is determined by the slope of the linear region. Ω = = ∆ ∆
= 1052.63
019 . 0 20 I V XCC (7) cri fC Xcc π 2 1 = 63 . 1052 * 50 * * 2 1 2 1 π π = = CC cri fX C 6 10 02 .
3 × −
= cri C
F
Ccri ≅3µ
The critical capacitance is the slope-1 of the linear region of no load curve. If the capacitance is chosen below the critical capacitance 3 µF, the voltage will never buildup and excitation fails initially.
2.2.2 Minimum capacitance (Cmin)
It is defined as ratio of rated voltage to corresponding magnetizing current.
Ω = =
= 705.88
34 . 0 240 min I V X rated c (8) 45 . 669 * 50 * * 2 1 2 1 min
min= π = π
c
fX C
6
min 4.5 10
−
× =
C
F Cmin ≅5µ
It is minimum capacitance required to generate the rated voltage. If we choose below this value, the rated voltage will not be generated.
2.2.3 Maximum capacitance (Cmax)
It is defined as ratio of voltage generated at rated current to the current itself.
Ω = = = 540 5 . 0 270 max rated c I V X (9) 540 * 50 * * 2 1 2 1 max
max= π = π
c
fX C
6 max 5.89 10
−
× = C
F
Cmax ≅6µ
The maximum value of capacitance used should not exceed 6 µF. If the capacitance exceeds the maximum value, the current flow will be more than the rated value. This may lead to heating of stator core.
3. MODELING OF SELF-EXCITED INDUCTION GENERATOR
The dynamics of a self-excited induction generator are detailed in many papers [13, 14] and can be expressed by the following electromechanical equations derived in the synchronously rotating q-d reference frame.
dr r m qr r ds r m e qs s
qs Kri KL i K ri KL i
pi =− 1 −(ω + 2 ω) + 2 − 1 ω (10)
ds dr r qr r m ds s qs r m e
ds K L i kri KL i Kri KV
pi =(ω + 2 ω ) − 1 + 1 ω + 2 − 1 (11)
dr e r s qr r r m r ds r s qs s
qr kri KL i r KLr L i KL i
pi = 2 + 2 ω −[( + 2 )/ ] +( 1 ω −ω) (12)
ds dr r r m r qr e r s qs r s ds s
dr kri KL i KL i r KLr L i KV
pi = 2 − 2 ω −( 1 ω−ω) −[( + 2 )/ ] + 2 (13)
m dr ds dr qs m r
r B J P L J i i i i P JT
pω =−( / )ω +(3 2 /8 )( − )+( /2 ) (14)
) / (i C
pVds= dc (15)
where,
)
/( 2
1 Lr LsLr Lm
K = − , /( 2)
2 Lm LsLr Lm
K = −
The above equations are derived assuming that the initial orientation of the q-d synchronously rotating frame is such that d-axis is lagging q-axis and aligned with the stator terminal voltage phasor (i.e. vqs = 0).
Magnetizing inductance is the main factor for voltage buildup and stabilization of generated voltage for the unloaded and load conditions of the induction generator. In self-excited induction generators, the magnitude of the generated air-gap voltage in the steady state equation is given by
Vg =ωeLm im
(16)
where,
) /( ds qc
e=i CV
ω
,
(
)
(
)
2 2
im = iqs+iqr + ids+idr
The magnetizing inductance Lm is not constant but a function of the magnetizing current im is given as
( )
m m
L
=
f
i
(17)
ISSN: 1992-8645 www.jatit.org E-ISSN: 1817-3195
Lm = 0.0898 - 0.0107|im|, |im| ≤ 2 (18)
= 0.0747 – 0.0027|im|, 2 ≤ |im| ≤ 16
= 0.0472 – 0.0010|im|, 16 ≤ |im| ≤ 28
= 0.0189 |im| ≥ 28
The electromagnetic braking torque Te developed by the induction generator is expressed as
Te = -1.5 (P/2) Lm (iqs idr - ids iqr) (19)
The a, b, c variables are obtained from the d, q variables through the inverse of the Park transform defined below: + + − − = 0 1 ) 3 / 2 sin( ) 3 / 2 cos( 1 ) 3 / 2 sin( ) 3 / 2 cos( 1 ) sin( ) cos( V V V V V V d q c b a π θ π θ π θ π θ θ θ (20)
Note that these transformations apply equally well to currents and flux linkages.
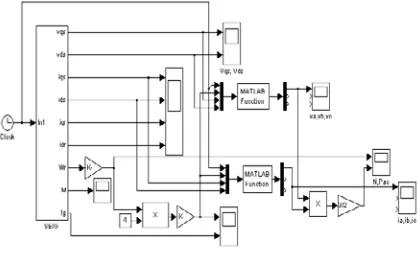
[image:4.612.80.527.82.614.2]Fig. 4 displays the simulink model of the self-excited induction generator represented by equation (10) - (20). Matlab/Simulink is employed to study the dynamic performance of the machine.
Fig. 4: Simulink Model Of Self-Excited Induction Generator
(i) Theoretical kVAr calculation
Ω = ×
= − 530.51
10 6 * 50 * 2 1 6 π C X A Iph 0.452
51 . 530 240 = = 1000 Ph phI V kVAr= 187 . 0 1000 452 . 0 * 240 * 3 = = kVAr
kVAr (21)
4. SELF-EXCITATION EXPERIMENT
The induction machine is coupled with dc motor drive. The capacitance of 6 µF is connected in star and grid supply is given to the stator terminals,
Fig. 5. The dc motor is made to run at speed higher than synchronous. Then grid supply is suddenly disconnected. The voltage across the stator remains same due to self-excitation created by the capacitors.
Fig. 5: Circuit Diagram For Self-Excitation Using
Cmax
(ii) Practical kVAr calculation
1000 Ph phI V kVAr= 168 . 0 1000 413 . 0 * 235 * 3 = = KVAr
kVAr (22)
The calculated kVAr is nearly 10% more than the practical value.
[image:4.612.93.303.385.514.2]5. RESULTS AND DISCUSSION
Fig. 6 exhibits the d-axis stator voltage with respect to time.
Time (s)
Fig. 6: D-Axis Stator Voltage
Fig. 7 presents the self-excitation process initiated at t = 0s without any load at the stator terminals. It is observed that voltage buildup reaches the first steady-state value at t = 6s.
[image:4.612.311.528.417.533.2]Time (s)
Fig. 7: Dynamic Response Of The Induction Generator During Voltage Build-Up Process (No Load
[image:4.612.315.524.604.697.2]ISSN: 1992-8645 www.jatit.org E-ISSN: 1817-3195
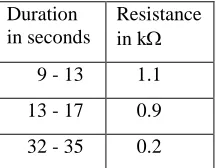
Fig. 8 demonstrates the variation in generated voltage for step changes in the load for a generator speed of 1300 rpm with 6 µF capacitor connected across the stator terminals.
As the load on the generator increases, the stator voltage decreases with an increase in the stator current and required torque. The loads and the corresponding duration are tabulated below.
Duration in seconds
Resistance in kΩ
9 - 13 1.1
13 - 17 0.9
32 - 35 0.2
The generator fails to self-excite for a load resistance of 0.2 kΩ. At t = 17s, a 1.1 kΩ load resistor is applied. The generated voltage rises to a value higher than the no load voltage. The current and toque decrease.
At t = 23s, a load resistor is suddenly removed. The generated voltage quickly reaches its new steady-state value. Similar voltage fluctuations will occur when the load is suddenly switched off. At t = 27s, the capacitance is increased to 8 µF to compensate for the voltage drop. The voltage rises to its no load value resulting in increase of current and torque.
Time (s)
Fig. 8: Stator Voltage, Stator Current And Torque As A Function Of Time
At t = 45s, Fig. 9, the capacitance is suddenly removed, the resistive load causes machine voltage to reach zero level abruptly.
[image:5.612.134.242.197.281.2]Time (s)
Fig. 9: Stator Voltage Disturbance When C Is
Removed.
Dynamic response of voltage variations with time for a load of 1.1 kΩ between 12s and 14s is depicted in Fig.10. It can be observed the machine voltage reaches its steady state value immediately after 14s.
[image:5.612.93.297.443.681.2]Time (s)
Fig. 10: Stator Voltage Disturbance When Pulse
Changed.
6. COMPARISON BETWEEN
ANALYTICAL AND EXPERIMENTAL RESULTS
The values of Xm, Pm, Vs, on no load and IL, VL, PL on load are computed and plotted, Figs. 11 - 16. The corresponding experimental ones are shown for comparison.
0 200 400 600 800 1000 1200 1400
0 0.1 0.2 0.3 0.4 0.5 0.6
Phase current (A)
M
ag
net
iz
in
g
react
an
ce
(Ω
) experimental
simulation
Fig. 11: Xm Vs Iph Characteristics Of Induction
ISSN: 1992-8645 www.jatit.org E-ISSN: 1817-3195
0 20 40 60 80 100 120 140 160
0 50 100 150 200 250 300
Phase voltage (V)
M
a
g
n
e
ti
z
in
g
p
o
w
e
r
(
W
)
experimental
simulation
Fig. 12: Pm Vs Vs Characteristics Of Induction
Machine
During no load condition the speed of the dc motor is reduced in steps until the voltage across the capacitance drops suddenly to zero, Fig. 13. This is called excitation failure stage.
0 100 200 300 400 500 600
0 500 1000 1500 2000
Speed (rpm)
S
ta
to
r
v
o
lta
g
e
(V
) experimental
simulation
Fig. 13: Excitation Failure Without Load By Varying Speed
It is concluded that the excitation fails for a speed of 1160 rpm for a capacitance of 6 µF, point A.
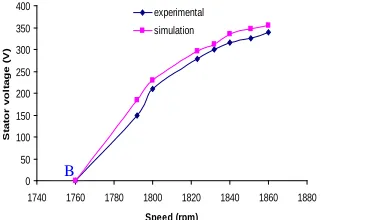
A three phase resistive load is connected across the star connected capacitor bank. Again, the speed of the drive is gradually decreased to obtain zero voltage point, Fig. 14. This is termed excitation failure stage at full load.
0 50 100 150 200 250 300 350 400
1740 1760 1780 1800 1820 1840 1860 1880
Speed (rpm)
S
ta
to
r
v
o
lta
g
e
(V
)
[image:6.612.312.481.293.420.2]experimental simulation
Fig. 14: Excitation Failure With Load By Varying Speed
The excitation failure occurs at 1760 rpm for resistive load of 1.1 kΩ and maximum capacitance
of 6 µF, point B; the corresponding load voltage and power vs load current are shown in Figs. 15 and 16 respectively.
0 100 200 300 400 500 600
0 0.05 0.1 0.15 0.2 0.25
Load current (A)
L
o
a
d
v
o
lt
a
g
e
(
V
)
experimental simulation
Fig. 15: VL Vs IL For RL= 1.1 KΩ, Cmax= 6 Μf.
0 10 20 30 40 50 60
0 0.05 0.1 0.15 0.2 0.25
Load current (A)
L
o
a
d
p
o
w
e
r
(
W
) experimental
[image:6.612.96.267.306.422.2]simulation
Fig. 16: PL Vs IL For RL= 1.1 KΩ, Cmax= 6 Μf.
7. CONCLUSION
The calculation of the critical, minimum and maximum excitation capacitance from no load characteristics of the induction generator is presented.
The modelling of self-excited induction generator is done and corresponding equations are given. The self-excited induction generator is modelled in synchronously rotating reference frame and it is transformed to abc frame by PARK’S transformation. The dynamic response of self-excited induction generator is simulated under varying loads and capacitances.
The voltage buildup process of the self-excited induction generator under varying generator speeds is investigated for a resistive load through simulated and experimental results which are in close agreement.
REFRENCES:
[1] The Global Wind Energy Council, GWEC Latest News (2011, April). China, USA, Germany, Spain and India lead world wind A
[image:6.612.96.284.563.673.2]ISSN: 1992-8645 www.jatit.org E-ISSN: 1817-3195
power market in 2011 [Online]. Available: http://www.gwec.net
[2] J.B. Patton and D. Curtice, “Analysis of utility protection problems associated with small wind turbine interconnections,” IEEE Trans., PAS-101, (10), pp.3957-3966, 1982.
[3] S.S. Murthy, B.P. Singh, C. Nagamani and K.V Sathyanarayana, “Studies on the use of conventional induction motors as self excited induction generators,” IEEE Trans. Energy Conversion, Vol. 3, no.4, pp. 842-848, 1988. [4] E.D. Basset and F.M. Potter, “Capacitive
excitation of induction generators,” Trans. Amer. Inst. Electr. Eng., 54, pp. 540-545, 1935.
[5] G.L.Johnson, “Wind Energy Systems,” Prentice Hall Inc., Englewood Cliffs, New Jercy, 1985.
[6] S.S. Murthy, O.P. Malik and A.K. Tandon, “Analysis of self-excited induction generator,” Proc. Inst. Elect. Eng. C., vol.129, no.6, pp. 260-265, Nov. 1982.
[7] N.H.Malik and A.H.Al-Bahrani, “Influence of the terminal capacitor on the performance characteristics of a self excited induction generator,” Proc. IEE, vol. 137, no.2, 1990, pp. 168-173.
[8] L.Quazene, and G. McPherson, Jr., “Analysis of the isolated induction generator,” IEEE Trans. PAS, vol. 102, no.8, pp. 2793-2798, 1983.
[9] J.M.Elder, J.T.Boys and J.L.Woodward, “Self-excited induction machine as a small low cost generator,” Proc. IEE, Part C, Vol. 131, no.2, 1984, pp. 33-41.
[10]T.F.Chan, “Capacitance requirements of self-excited induction generators,” IEEE Trans. Energy Conversion, vol. 8, no. 2, pp. 304-311, 1993.
[11]C.Grantham, D.Sutanto, and B.Mismail, “Steady-state and transient analysis of self-excited induction generators,” Proc. IEE, Part B, Vol. 136, no.2, 1989, pp. 61-68.
[12]Paul C. Krause, “Analysis of electric machinery,” McGraw-Hill, New York, 1986, P.172.
[13]K.Natarajan, A. Sharaf, S. Sivakumar and S. Nagathan, “Modelling and control design for wind energy power conversion scheme using self excited induction generator,” IEEE Trans. EC, Vol.2, no.3, pp.506-512, Sept.1987.
[14]Li Wang and Jian-Yi Su, “Dynamic
performance of an isolated self excited induction generator under various loading
ISSN: 1992-8645 www.jatit.org E-ISSN: 1817-3195
NOMENCLATURE:
C = Self-excitation capacitance E1 = No load magnetizing voltage ids, iqs = Peak stator d and q axes currents idr, iqr = Peak rotor d and q axes currents idc, iqc = Peak d and q axes capacitor currents im = Peak magnetizing current
In1 = No load current
J, B = Net inertia & friction of rotating parts of the m/c
Lm = Magnetizing inductance Ls, Lr = Stator and rotor inductances P = Number of poles
Pm = Magnetizing power p = Differential operator d/dt rs, rr = Stator and rotor resistance Tm = Mechanical toque (Nm) Te = Electromagnetic torque (Nm) vds, vqs = Peak stator d and q axes voltages vg = Peak magnitude of the air gap voltage vn1 = Phase supply voltage
vL, iL = Load voltage and load current ωr = Shaft speed (rad/sec)
ωe = Electrical frequency (rad/sec) xm = Magnetizing reactance xCC = Critical capacitive reactance
xcmin, xcmax = Minimum and maximum
capacitive reactances
zn1 = No load impedance
APPENDEX
Parameters of induction machine (Squirrel Cage rotor):
Rating : 120 W, 240 V, 0.5 A, 1300 rpm, 4 pole Constants : rs= 36.658 Ω, rr= 36.753 Ω