RISK BASED DECISION SUPPORT SYSTEM FOR
STAKEHOLDER QUANTIFICATION FOR VALUE BASED
SOFTWARE SYSTEMS
1
MUHAMMAD IMRAN BABAR, 2MASITAH GHAZALI, 3DAYANG N.A. JAWAWI
1
Research Scholar, Department of Software Engineering, Universiti Teknologi Malaysia, Skudai, Johor, Malaysia 2
Senior Lecturer, Department of Software Engineering, Universiti Teknologi Malaysia, Skudai, Johor, Malaysia 3
Associate Professor, Department of Software Engineering, Universiti Teknologi Malaysia, Skudai, Johor, Malaysia
Email: 1ibmuhammad2@live.utm.my, 2masitah@utm.my, 3dayang@utm.my
ABSTRACT
Stakeholder identification and quantification (SIQ) is one of the core processes in software requirements engineering (RE). The significance of stakeholders becomes more vital when a software project is a value-based software (VBS) and the value-value-based requirements engineering (VBRE) is involved in it.VBS systems are developed based on business concepts in order to gain market leverage in terms of financial or economic benefits. Different SIQ approaches are presented in literature. However, most of the approaches are partially effective and SIQ process is still immature. The techniques are presented and applied under different conditions in order to monitor the performance of the approach. The presented techniques are vague and difficult to initiate. In this research, a decision support system is presented for stakeholders’ quantification. The proposed system predicts the risk associated with the stakeholders using back-propagation neural network (BPNN).
Keywords: Value-based Software Systems, Stakeholders, Neural Networks, Decision Support System,
Expert System.
1. INTRODUCTION
The importance of requirements elicitation phase (REP) is widely acceptable by the industry professionals due to the criticality of the issues of requirements [1]. Zave (1997) defines that “requirements engineering is the branch of software engineering concerned with the real-world goals for, functions of, and constraints on software systems. It is also concerned with the relationship of these factors to precise specifications of software behavior, and to their evolution over time and across software families” [2]. In this stage all user requirements are gathered in order to realize them in the form of a working system. For realization of the system both functional and non-functional requirements are gathered [3, 4]. Different RE approaches are presented in order to gather highly critical set of requirements which play a vital role in improving quality of the system. In the success and failure of a project the role of key requirements is vital [5]. VBS systems deal with financial matters and innovation is the key aspect of these systems. Innovation is the major cause in the development of these systems and is the result of high complexity. The complexity is the result of
unclear requirements so the development of VBS systems also becomes difficult [6].
budget but also in longer developmental
timeframes [11] and ultimately the abandonment of the project occurs [12]. About software development if there are “different views of quality, different requirements, different desired consequences sought result in conflicts leading to software development” [13]. The problems of stakeholders’ identification process are discussed in detail in [14].
The practices of value-based software engineering (VBSE) are associated with VBS development. Boehm states VBSE as “the explicit concern with value concerns in the application of science and mathematics by which properties of computer software are made useful to the people” [15]. A diverse range of problems are focused in VBSE studies. The major research issues which are focused in VBSE studies are RE, value or profitability, cost and decision making. However, the importance of stakeholders is recognized in some research studies like [16-21] but the stakeholders are not the direct focus of these studies. VBS systems normally deal with finance and this property of VBS systems make them highly sensitive as compared to traditional systems. The financial streams make the VBS systems highly critical and sensitive and this thing is the cause of uncertainty that either the proposed idea will yield the required output or not in terms of finance. The issues of RE and value creation in case of VBS development are associated with stakeholders directly or indirectly. The due consideration is not given to the plight of stakeholders. The current practices of SIQP are not feasible for VBS systems so there is the need to propose an easy and valuable way to identify and quantify the stakeholders of VBS systems. Stakeholders’ analysis is a complex decision based phenomenon and there is almost no decision support in this domain. In this paper a BPNN based an expert decision support system is proposed for stakeholders’ analysis of VBS systems.
Rest of the paper is divided into 7 sections. Section 2 is about background in which a brief discussion of existing SIQ approaches is given and the pros and cons of these approaches are described. Section 3 describes the formulation of problem in the form of a metrics or mathematical equation. In section 4 the operational details of NN. Section 5 is about data collection. Section 6 describes the NN optimization in which training, NN architecture selection and initial results are described briefly. In section 7 the results are
evaluated and the performance of current approach is compared with the existing approaches. Lastly, section 8 is about a brief summary of the research.
2. RESEARCH BACKGROUND
Stakeholders’ analysis is a challenging domain in RE in order to find out a set of critical stakeholders for the intended system. Different SIQ approaches are presented in order to resolve the plight of stakeholders’ identification. The main problem of SIQ is lack of a uniform approach or framework for the stakeholders’ analysis. The stakeholders’ attributes used in existing techniques are very abstract and it is difficult to assess the worth of a stakeholder using these attributes. Currently, there is a lack of SIQ approach that may be adopted as generically. Still there is no uniform framework of process for stakeholders’ identification [22, 23]. The existing SIQ approaches are not state of the art due to the lack of clear guidelines that may be adopted for SIQ process.
Mitchell is considered as a pioneer in presenting a stakeholders’ analysis model. Mitchell has used three main stakeholders’ attributes like power, legitimacy and urgency [24]. Based on these three attributes Mitchell has divided stakeholders into eight classes like discretionary stakeholders, non-stakeholders, dormant stakeholders, demanding stakeholders, dangerous stakeholders, dominant stakeholders, definitive stakeholders and dependent stakeholders. Different research studies have used different stakeholders’ attributes like roles, relationship and influence or power [24-27]. Most of the proposed techniques are difficult to initiate and very complex. The existing techniques present a very abstract picture of the SIQ process and do not provide nano <low level> descriptions.
contribution with respect to SIQ process and the
influence of change is also calculated on the current stakeholders of the system. In a study the stakeholders are divided into three classes like critical, major and minor [33]. The study has divided stakeholders into three major classes without giving process level details that how to initiate the SIQ process. A risk based approach is given which divides the stakeholders into six categories of internal stakeholders, external stakeholders, customers, influencer stakeholders, special interest stakeholders and financial stakeholders [34].
VBS systems are business oriented systems which deals with financial matters. In literature there is no evidence of stakeholders’ quantification. As stated that VBS systems deal with financial streams and this thing makes them different from traditional software systems. There is a high risk in the development of VBS systems due to the innovation of the idea. The current SIQ approaches are not suitable for VBS systems. The current approaches are not feasible for VBS development due to higher time consumptions and higher costs [28, 29]. Most of the research studies are applying existing SIQ approaches instead of proposing the new methods [31, 32]. There are several research studies in the domain of VBS requirement prioritization [35-39]. However, there is the need to focus stakeholders in the VBS perspectives.
[image:3.595.314.504.204.334.2]The current drawbacks of the existing SIQ approaches are the source of motivation for this research. The proposed techniques are highly complex and difficult to initiate due to the lack of in-depth information that how to carry out the SIQ process [31]. It is stated by some researchers that “there is still no Stakeholder Identification Process (SIP) framework or uniform description” [22, 23, 40]. The existing SIQ approaches are not cost effective in terms of time [28-30]. In this research paper a back-propagation neural network (BPNN) based solution is provided in order to solve the plight of software SIQ process for VBS systems. Hence, the current approaches are not only feasible for VBS but they are also not feasible for traditional software systems due to higher time consumptions and higher costs. The existing SIQ approaches are applied in a diverse range of applications. Figure 1 describes the different domains in which these approaches are applied. The existing SIQ approaches focus the domain of information system (IS), generic software practices (GSP), knowledge-based
system (KBS), inter-organisational system (IOS), social networks (SN), recommender systems (RS), ERP and agile software development (ASDP). Hence, there is a dire need to propose a technique for stakeholders’ analysis of VBS systems.
Figure 1. Application domains of SIQ approaches
3. PROBLEM FORMULATION
This section of the technique deals with the problem formulation. The value of a stakeholder is accessed through risk associated with the stakeholder. The value of risk is going to depict the extent of risk after making a stakeholder the part of REP. Risk is inversely proportional to the value of a stakeholder if the risk is higher the worth of stakeholder will be lower and vice versa. Different aspects or attributes of the stakeholders are considered in order to find out the key importance of a stakeholder. The risk factor associated with the stakeholder is denoted by FSR
and the different aspects or attributes of the stakeholders are denoted by T.
The values of aspects or attributes are taken on the ranking scale of 0 to 5. The stakeholder attributes used in the stakeholders’ factor computation are communication (TCM),
interpretation (TIT), decision making (TDM),
cognitive load (TCL), complexity (TCP), language
barriers (TLB), experience (TEX). Communication
is the ability of a stakeholder to describe the needs fluently without any ambiguity. Interpretation deals with explanations of the objectives to the point for a given system. The attribute of decision is about the ability of a stakeholder that either he or she is able to take a decision or not. The aspect of cognitive load explains the ability that at which level the stakeholder is able to manage the stress of the memory. Complexity is associated with the ability of the stakeholder to explain complex needs in a
simple and elaborative way. The language barrier
describes the risk associated due to the difference of the language of the stakeholders. The aspect of experience explains the professional ability of the stakeholder in the domain of value-based business. These seven attributes are chosen with the help of industry professionals after long discussions and can be used to evaluate the risk associated with a stakeholder.
FSR = 0.2(TCM + TIT + TDM + TCL + TCP + TLB + TEX) + 0.2
0.2 0.2 1
The value of FSR is in the range of 0.2 to 7.2
with a geometric progression of 0.2. In equation 1, 0.2 is taken as a weight factor in order to get manageable data in smaller data bounds. The weights lower than 0.2 are the cause of fuzzification, while the weights greater than 0.2 result in higher value which are not easily manageable. Different weights are applied in a range of 0.05 to 1.0 and it is found that 0.2 is a more feasible weight to manage the data. The values to the attributes are assigned by the industry experts on a ranking scale of 0 to 5 where 0 means no risk and 5 means high risk. As there is the involvement of highly expert judgment and it makes the SIQ process more complex and non-linear. The expert judgment also affects the final results in terms of stakeholders’ values. So in order to solve this problem a NN based solution is given. The NN will help to predict the values of the stakeholders based on key inputs and outputs.
4. PROPOSED EXPERT SYSTEM
Artificial neural networks (ANNs) are widely used in different scientific and engineering domains in order to solve complex non-linear problems using backpropagation algorithm. ANN is an approach for prediction and approximation [41]. ANNs are a simulation of biological neural network (BNN). The components of a BNN are soma, dendrite, axon, and synapse while in ANN the components are neuron, input, output and weight. Neurons in ANN perform the duties of Soma, Input signals serves as Dendrites, Output signals serve as Axon and weight adjustment is performed like synapse. The key features which are common in both ANN and BNN are learning and generalization, adaptability, robustness, associative storage of information, massive
parallelism, generalization, and spatiotemporal information processing [42].
In this SIQ approach BPNN is used. The learning method of BPNN is supervised. The input data set is given to input layer or source neurons. BPNN predicts the output of the given input data set and based on error threshold the back-propagation algorithm (BPA) is called each time in order to minimize the Mean Squared Error (MSE) and to optimize the output or result. BPA actually calculates the error gradient [43]. An error is a difference between expected output and predicted output. During call of BPA the adjustment of the weights is carried out to optimize the results or to minimize the error. BPNN training algorithm is comprised of following 4 steps.
1. Initialization 2. Activation
3. Weight Adjustment 4. Iteration/Loop
In initialization all required parameters are initialized based on threshold levels. The weights and threshold values are initialized by a uniform distribution of the random numbers. In activation step of BPNN the application of target inputs and target outputs is carried out. The target inputs and outputs serve as input and output patterns for BPNN. The sigmoid activation function is used in the hidden layer in order to calculate the outputs. The sigmoid activation function is represented as:
. ! " # 2
In sigmoid activation function of hidden layer, n represents the total inputs to neuron j. The word sigmoid is used for sigmoid activation function. For output layer the outputs are calculated using the function:
$ % $ . $ ! "$
&
' 3
In sigmoid activation function of output layer, m represents the total inputs to neuron k.
and hidden layer are calculated. Using error
gradients the weights are corrected and updated at output and hidden layers. Then feed-forward propagation is applied once again to calculate the outputs.
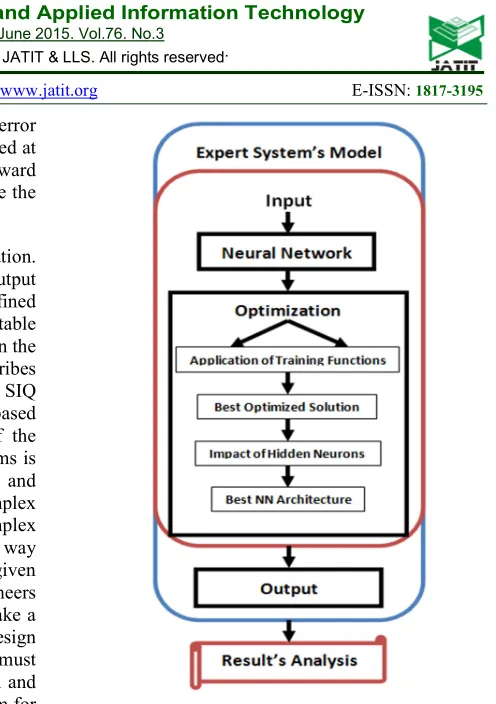
[image:5.595.266.514.70.422.2]The fourth and the last step is the iteration. The iteration or loop is carried out until the output error or MSE is not going to reach the predefined threshold and the expected output is a stable output. An expert system is proposed based on the formulated problem and NN. Figure 2 describes the model of the proposed expert system for SIQ process. The expert systems are knowledge based systems which are based on knowledge of the experts [42]. The application of expert systems is widely accepted in all domains of sciences and engineering in order to resolve the complex problems. The SIQ process is a highly complex process and industry needs a highly reliable way to predict the value of a stakeholder for a given VBS system. Simply, for requirements engineers stakeholders are the only tools which can make a system successful or a collapse. In order to design high quality VBS systems the requirements must be in align with the key needs of the system and users. Hence, in this research an expert system for stakeholders’ analysis is proposed for requirements engineers in order to quantify the stakeholders. The stakeholders have an immense influence not only on the quality of the system but also on the key business values in the market. Currently, the domination on the market leverage is highly essential. The NN is used for prediction of the value of stakeholders in a reliable way.
Figure 2. Expert Decision Support System Model
5. DATA COLLECTION
financial management and comes in the domain
of VBS system. The RMS is a business oriented system that is normally used to provide better services to its customers. The system is normally used to keep track of all the transactions that are related to food sales and room bookings by the customers. Hence, all these case studies are associated with the financial streams of the business so these as taken as VBS systems in this research. During RE phase experts have evaluated the stakeholders based on the key aspects used in FSR by assigning value to each aspect or attribute
in the range of 0 to 5. Experts were also asked to randomly assign an FSR value in the range of 0.2 to 7.2. The input vector P to BPNN is represented as:
P = (p1, p2, p3, …, pn)
The data is gathered about 431 stakeholders of 3 projects and 1 team of 4 persons was assigned to each project. Out of 3 teams 2 of the
teams were from Malaysia while 1 team was from Pakistan. The main purpose to select the teams from 2 countries is to avoid biasness and to generalize the implementation of FSR. For
example, the values assigned to the stakeholders aspects or characteristics by an expert are P = (2, 4, 2, 5, 3, 1, 3) for the seven factors. The input to FSR is 20 and the FSR value is 4.2.The range of
input data P is 0-35 and the range of target data T is 0.2 to 7.2 with geometric progression 0.2. There are a total of 36 data classes. These data classes present all possibilities of the FSR value
for a stakeholder. The sum of 7 stakeholders’ aspects is given as an input to NN and is mapped to the target data. As the aspect value is assigned by expert so it induces a sense of bias which affects the final results of FSR and experts may
[image:6.595.176.420.403.519.2]vary their opinion based on their expert judgment. The use of NN will increase the efficiency of the SIQ process. Table 1 represents the partial sample data.
Table 1: Partial Sample Data
TCM TIT TDM TCL TCP TLB TEX
)*+,
-, .
FSR
2 3 3 3 4 3 1 19 4.0
3 4 2 3 2 3 4 21 4.4
3 3 5 2 2 2 2 19 4.0
0 0 0 0 0 0 0 0 0.2
1 1 1 1 1 1 1 7 1.6
1 2 1 2 1 2 1 10 2.2
2 0 1 4 0 0 1 8 1.8
6. NEURAL NETWORK OPTIMIZATION
The NN is trained to get the optimized results. The training phase is used to feed an implicit knowledge to the NN [45]. For optimization purpose different training functions are used in this approach in order to find out the most optimum results. For optimization the data is normalized and a dataset range of -1 to 1 is obtained. The data normalization helps in even distribution of the data. In hidden layer the hyperbolic tangent function is used in all training functions. Figure 2 describes the optimization process in the proposed expert system’s model. The NN optimization is carried out in three different phases. The main purpose of these phases is to get an optimized solution for the research problem of this study.
6.1 Phase 1: Application of Training
Functions
In this phase the performance of NN is measured by applying different training functions. The main purpose of apply different training functions is to get an optimized NN solution for the focused problem. The different training functions that are applied to simulate the NN are trainlm, trainbfg, traincgf, traingdx, traingdm and
traingd. The performance of the different
Table 2: NN Results
NN Architecture Actual data Trainlm trainbfg traincgf traingdx traingdm traingd
1-15-1 0.2 0.1977 0.1674 0.2178 0.2195 0.2407 0.1331
1-15-1 0.4 0.3953 0.4644 0.4128 0.5419 0.4890 0.3841
1-15-1 0.6 0.5944 0.6552 0.5383 0.6774 0.6047 0.4984
1-15-1 0.8 0.7913 0.7790 0.7780 0.7163 0.7043 0.5995
…
1-15-1 2.6 2.6061 2.4844 2.5908 2.6223 2.8788 2.7186
1-15-1 2.8 2.7978 2.7832 2.8964 2.6620 3.2583 2.7564
1-15-1 3.0 2.9765 3.0545 3.0468 2.8126 3.3216 2.7834
1-15-1 3.2 3.2091 3.1846 3.1449 3.1971 3.3350 2.8658
…
1-15-1 5.4 5.4474 5.3448 5.3909 5.2909 4.8892 5.8541
1-15-1 5.6 5.5934 5.5351 5.6086 5.6697 5.1933 5.9335
1-15-1 5.8 5.7511 5.8052 5.7748 5.9434 5.7862 5.9573
1-15-1 6.0 6.0253 6.0472 5.9438 6.0537 6.3801 6.0174
…
1-15-1 6.6 6.5493 6.5586 6.5667 6.6248 6.8220 6.6201
1-15-1 6.8 6.8534 6.8438 6.7920 6.9486 6.8308 6.6872
1-15-1 7.0 7.0442 7.0382 7.0541 7.0359 6.8333 6.7044
1-15-1 7.2 7.1006 7.1163 7.1481 7.0509 6.8338 6.7028
Table 2 shows the predicted value of FSR
based on different training functions but with same training parameters. Different NN architectures are applied and the best training results are achieved by NN architecture of 1-15-1 which means one input, 15 hidden neurons and 1 output. It is observed that the results of trainlm function are highly optimized than other training functions. The results given in the Table 2 depict that the stakeholders’ problem can be solved by using trainlm function. The MSE of trainlm function is shown in Figure 3.
For assessment of error in BPNN the parameter of MSE is used. The MSE graph helps in validating the NN after every iteration or epoch [46]. When the value of MSE decreases and the number of epochs increases then it ensures the efficient working of NN [46]. The decrease in MSE is highly desirable in BPNN otherwise it is required to retrain the network.
Figure 3. MSE Graph of Trainlm Function
The training results in Table 2 show that the best possible training function for stakeholder quantification problem is trainlm which is also default training function of PBNN. In validation phase different NN architectures are applied in order to achieve the optimized results. The number of hidden units is changed in order to analyse the results of different NN architectures. The change in hidden units helps in measuring the performance of BPNN. However, there is only one hidden layer in all the experiments. The results of validation data are given in Table 3
0 1 2 3 4 5 6
10-4 10-3 10-2 10-1 100 101 102
6 Epochs
T
ra
in
in
g
-B
lu
e
G
o
a
l-B
la
c
k
[image:7.595.103.502.87.458.2] [image:7.595.315.490.362.536.2]Table 3: Validation Data Results
Sr. No. Input Target trainlm Predicted Output Error Difference (Target-Predicted)
1. 16 2.2000 3.4040 -1.2040
2. 5 3.4000 1.1936 2.2064
3. 14 2.8000 3.0068 -0.2068
4. 12 1.6000 2.6004 -1.0004
5. 9 4.4000 2.0200 2.3800
6. 18 3.4000 3.7981 -0.3981
7. 7 0.4000 1.6130 -1.2130
8. 8 1.2000 1.7766 -0.5766
9. 10 0.8000 2.1908 -1.3908
10. 13 2.2000 2.7947 -0.5947
11. 9 1.8000 2.0200 -0.2200
12. 11 0.8000 2.4029 -1.6029
13. 17 1.2000 3.6015 -2.4015
14. 5 2.4000 1.1936 1.2064
15. 16 1.6000 3.4040 -1.8040
16. 24 2.0000 4.9977 -2.9977
17. 19 3.2000 3.9917 -0.7917
18. 8 4.8000 1.7766 3.0234
19. 16 2.6000 3.4040 -0.8040
20. 4 1.4000 0.9899 0.4101
Table 3 describes the results of trainlm training function. Input, target, trainlm predicted output are shown and based on target and predicted output the error difference is calculated. The linear fit of the function trainlm is shown in Figure 4.
Figure 4. Linear Fit for Trainlm
The FSR values of the stakeholders are
mapped with the training data values. The values on X axis are values of stakeholders’ aspects or attributes while values on Y axis are predicted FSR
values of the stakeholders using BPNN. The predicted data values in case of trainlm have lesser deviation from the actual or training data values and the trainlm function is acceptable in order to solve the plight of stakeholders’ quantification. For more optimized results we
have applied different architectures of BPNN. The architectures of BPNN vary based on the hidden nodes in the hidden layers and activation functions.
[image:8.595.128.470.140.366.2]The MSE graph for validation data is shown in Figure 5. The MSE graph shows that the NN is working efficiently for validation data also. As the error reduces with the number of epochs the results achieved are more optimized. The graph shows the achieved performance of the NN.
Figure 5. MSE Graph of Trainlm for Validation Data
6.2 Phase 2: Impact of Hidden Neuron
The selection of an NN is based on the results produced by the NN. For stakeholders’ problems different NN architectures are applied by changing the hidden nodes in the hidden layer.
0 5 10 15 20 25 30 35
0 1 2 3 4 5 6 7 8
Stakeholders' Aspects Values
S
ta
k
e
h
o
ld
e
rs
'
F
S
R
V
a
lu
e
Validation Data Output using Trainlm
Training Data Testing Data Output Data
0 0.2 0.4 0.6 0.8 1 1.2 1.4 1.6 1.8 2
10-4 10-3
10-2 10-1
100 101 102
2 Epochs
T
ra
in
in
g
-B
lu
e
G
o
a
l-B
la
c
k
V
a
lid
a
ti
o
n
-G
re
e
n
[image:8.595.107.264.450.602.2] [image:8.595.319.488.498.649.2]The accuracy of all NN architecture is monitored,
and architecture of 1-16-1 is selected based on the most optimized results in terms of reduced error and high accuracy. Where the first 1 shows a single input, the middle number 16 shows the number of hidden nodes and in the last the 1 represents the final output. The NN architectures with hidden nodes less than 16 are rejected based on increased error. However, the NN architectures
[image:9.595.93.505.250.446.2]with hidden nodes greater than 16 are also rejected due to the problem of over-fitting. The results produced and performance by these NN architectures cannot be generalized due to minor errors. As the number of hidden nodes increases in the hidden layer it results in the problem of over-fitting of training data. The bad performance generalizations are the result of over-fitting of the training data [47].
Table 4: Change of Hidden Nodes and Impact on Results
NN Architecture Hidden Nodes Input Target trainlm Output Error Difference (Target-Predicted)
1-3-1 3 35 7.2000 7.1782 0.0218
1-4-1 4 35 7.2000 7.1817 0.0183
1-5-1 5 35 7.2000 7.1797 0.0203
1-6-1 6 35 7.2000 7.1801 0.0199
1-7-1 7 35 7.2000 7.1851 0.0149
1-8-1 8 35 7.2000 7.1895 0.0105
1-9-1 9 35 7.2000 7.1836 0.0164
1-10-1 10 35 7.2000 7.1970 0.0030
1-11-1 11 35 7.2000 7.1835 0.0165
1-12-1 12 35 7.2000 7.1902 0.0098
1-13-1 13 35 7.2000 7.1961 0.0039
1-14-1 14 35 7.2000 7.1925 0.0075
1-15-1 15 35 7.2000 7.1935 0.0065
1-16-1 16 35 7.2000 7.1994 0.0006
1-17-1 17 35 7.2000 7.1998 0.0002
1-18-1 18 35 7.2000 7.2000 -0.0000
1-19-1 19 35 7.2000 7.2000 -0.0000
1-20-1 20 35 7.2000 7.2000 -0.0000
7. RESULTS AND ANALYSIS
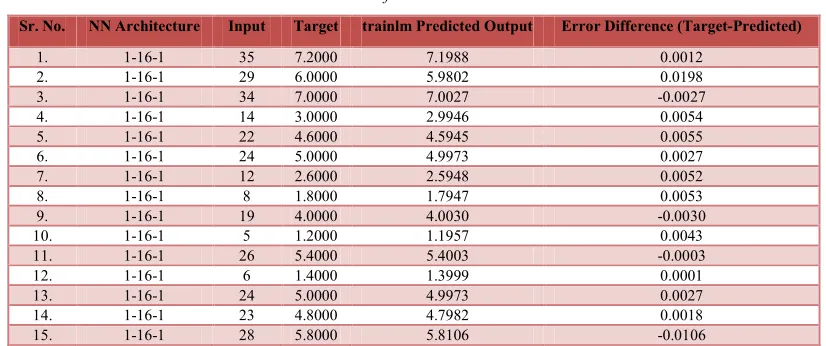
The results produced by selected NN architecture (1-16-1) are shown in Table 5. Stakeholders are considered as key entities in REP. The requirements are gathered from these key entities. This expert system is proposed for quantification of these key entities based on the risk associated with each entity. Higher the value of FSR then higher risk is associated with the
concerned stakeholder and vice versa. From Table 5 the FSR values like 7.1988, 5.9802, 7.0027,
4.5945, 4.9973, 4.0030, 5.4003, 4.9973, 4.7982, and 5.8106 shows the higher risk associated with these stakeholders. The FSR values other than
Table 5: Results of Selected NN Architecture
Sr. No. NN Architecture Input Target trainlm Predicted Output Error Difference (Target-Predicted)
1. 1-16-1 35 7.2000 7.1988 0.0012
2. 1-16-1 29 6.0000 5.9802 0.0198
3. 1-16-1 34 7.0000 7.0027 -0.0027
4. 1-16-1 14 3.0000 2.9946 0.0054
5. 1-16-1 22 4.6000 4.5945 0.0055
6. 1-16-1 24 5.0000 4.9973 0.0027
7. 1-16-1 12 2.6000 2.5948 0.0052
8. 1-16-1 8 1.8000 1.7947 0.0053
9. 1-16-1 19 4.0000 4.0030 -0.0030
10. 1-16-1 5 1.2000 1.1957 0.0043
11. 1-16-1 26 5.4000 5.4003 -0.0003
12. 1-16-1 6 1.4000 1.3999 0.0001
13. 1-16-1 24 5.0000 4.9973 0.0027
14. 1-16-1 23 4.8000 4.7982 0.0018
15. 1-16-1 28 5.8000 5.8106 -0.0106
The different parameters of the selected NN architecture are shown in Figure 6.
Figure 6. NN parameters
The proposed expert system provides a way to software professionals to analyse the stakeholders based on the risk associated with them. The proposed system helps in finding out the FSR value of the stakeholders. Higher the FSR
value higher the stakeholder is highly risky and vice versa. The approach helps in finding key stakeholders for VBS systems’ development. The selected stakeholders will help in elicitation of requirements for VBS system. The requirements given by these key stakeholders will help in gaining market leverage. The proposed expert system helps in removing the problems of the existing approaches. Based on the problem formulation the approach is easy to initiate as compared to other approaches. Other approaches lack in providing any metric however the FSR
equation can be used as a metric in order to evaluate the stakeholders for VBS systems. The proposed intelligent system is also cost effective in terms of time as compared to other SIQ approaches.
8. CONCLUSION
This research paper presents an approach for identification and quantification of stakeholders
of VBS systems. Stakeholders are the key entities in REP in order to get valuable requirements for VBS systems. The proposed approach is easy to initiate the SIQ process and to identify the key stakeholders for VBS systems based on the risk associated with them. This research supports business analysts in analysis of stakeholders and requirements. The current SIQ approaches are not successful hence an intelligent approach is presented in this research which is based on BPNN. The research focuses on an expert system for SIQ process. The proposed FSR metrics proved
useful in predicting the risk associated with a stakeholder. The results show that the proposed expert system helps well in solving the stakeholders’ problem. There are certain validity threats to this approach. The lack of expert judgement in the domain of SIQ process may be the cause of incorrect results. There is a need that the proposed SIQ approach must be initiated by expert domain analysts. Currently the dataset is very limited and the approach is applied in smaller projects with few stakeholders. There is a need to apply the approach in larger projects with hundreds and thousands of stakeholders. For future works some clustering algorithm like k-means, c-means or self-organizing map may be used in order to find out a most critical bunch of stakeholders with lowest risk value. The use of a clustering algorithm will also help in defining the base for inclusion and exclusion of a stakeholder in REP.
ACKNOWLEDGEMENTS
[image:10.595.91.504.141.314.2]research is under way to solve different software
engineering problems. Research is also ongoing into different high profile embedded software applications at the Embedded and Real-Time Software Engineering Laboratory (EReTSEL) Universiti Teknologi Malaysia. The authors give special thanks to Sir, Tom Gilb and all members of the SERG and EReTSEL for their kind support and to the anonymous reviewers for their valuable comments.
REFERENCES:
[1] C. J. Davis, R. M. Fuller, M. C. Tremblay, and D. J. Berndt, "Communication challenges in requirements elicitation and the use of the repertory grid technique," Journal of Computer Information Systems, vol. 46, p. 78, 2006.
[2] P. Zave, "Classification of research efforts in requirements engineering," ACM Computing Surveys (CSUR), vol. 29, pp. 315-321, 1997. [3] K. Wiegers, "First things first: prioritizing
requirements," Software Development, vol. 7, pp. 48-53, 1999.
[4] K. Wiegers, "Software Requirements, Microsoft Press," Redmond, WA, 2003. [5] F. P. Brooks, The mythical man-month:
essays on software engineering: Addison-Wesley, 1995.
[6] M. I. Babar, M. Ramzan, and S. Ghayyur, "Challenges and future trends in software requirements prioritization," in International Conference on Computer Networks and
Information Technology (ICCNIT),
Abbottabad, Pakistan, 2011, pp. 319-324. [7] A. Pouloudi, "Stakeholder analysis as a
front-end to knowledge elicitation," AI & Society, vol. 11, pp. 122-137, 1997.
[8] T. Gilb, Competitive engineering: a
handbook for systems engineering,
requirements engineering, and software engineering using Planguage: Butterworth-Heinemann, 2005.
[9] I. Alexander and S. Robertson, "Understanding project sociology by modeling stakeholders," Software, IEEE, vol. 21, pp. 23-27, 2004.
[10] C. Pacheco and E. Tovar, "Stakeholder identification as an issue in the improvement of software requirements quality," in
Advanced Information Systems Engineering,
2007, pp. 370-380.
[11] M. J. Christensen and R. H. Thayer, The
project manager's guide to software
engineering's best practices: IEEE
Computer Society, 2001.
[12] M. Keil, "Pulling the plug: software project management and the problem of project escalation," MIS Quarterly, pp. 421-447, 1995.
[13] B. Wong, "Understanding Stakeholder Values as a Means of Dealing with Stakeholder Conflicts," Software Quality Journal, vol. 13, pp. 429-445, 2005.
[14] M. I. Babar, M. Ghazali, D. N. Jawawi, and A. Elsafi, "Stakeholder management in value-based software development: systematic review," IET Software, 2014. [15] B. Boehm, "Value-based software
engineering: reinventing," ACM SIGSOFT Software Engineering Notes, vol. 28, p. 3, 2003.
[16] S. Barney, C. Wohlin, G. Hu, and A. Aurum, "Creating software product value in China," IEEE Software, vol. 26, pp. 84-90, 19 June 2009 2009.
[17] S. Barney, A. Aurum, and C. Wohlin, "Quest for a silver bullet: Creating software product value through requirements selection," in 32nd EUROMICRO Conference on Software Engineering and Advanced Applications., Cavtat, Dubrovnik, 2006, pp. 274-281.
[18] B. Boehm and A. Jain, "An initial theory of value-based software engineering," in Value-Based Software Engineering, A. A. Stefan Biffl, Barry Boehm, Hakan Erdogmus, Paul Grunbacher, Ed., ed: Springer Berlin Heidelberg, 2005, pp. 15-37. [19] L. G. Huang and B. Boehm, "How much software quality investment is enough: A value-based approach," IEEE Software, vol. 23, pp. 88-95, 2006.
[20] K. W. Wagner and W. Durr, "A Five-Step Method for Value-Based Planning and Monitoring of Systems Engineering Projects," in 32nd EUROMICRO Conference on Software Engineering and Advanced Applications, 2006, pp. 282-290. [21] J. Gordijn and R. Wieringa, "A
value-oriented approach to e-business process design.," in Advanced Information Systems Engineering., ed: Springer, 2003, pp. 390-403.
Conference on Computer and Information
Science, 2009, pp. 939-942.
[23] C. Pacheco and I. Garcia, "Stakeholder Identification Methods in Software Requirements: Empirical Findings Derived from a Systematic Review," in The Third
International Conference on Software
Engineering Advances, 2008, pp. 472-477. [24] R. K. Mitchell, B. R. Agle, and D. J. Wood,
"Toward a theory of stakeholder identification and salience: Defining the principle of who and what really counts," Academy of management review, pp. 853-886, 1997.
[25] J. McManus, "A stakeholder perspective within software engineering projects," in
IEEE International Engineering
Management Conference, 2004, pp.
880-884.
[26] O. Preiss and A. Wegmann, "Stakeholder discovery and classification based on systems science principles," in Second Asia-Pacific Conference on Quality Software, Hong Kong, 2001, pp. 194-198.
[27] S. M. Young, S. McDonald, H. M. Edwards, and J. B. Thompson, "Quality and people in the development of situationally specific methods," in Second Asia-Pacific
Conference on Quality Software, Hong
Kong, 2001, pp. 199-203.
[28] L. C. Ballejos and J. M. Montagna, "Method for stakeholder identification in interorganizational environments," Requirements engineering, vol. 13, pp. 281-297, 2008a.
[29] L. C. Ballejos, S. M. Gonnet, and J. M. Montagna, "A Stakeholder Model for Interorganizational Information Systems.,"
in Requirements Engineering: Foundation
for Software Quality. vol. 5025/2008, ed Berlin / Heidelberg: Springer, 2008b, pp. 73-87.
[30] L. C. Ballejos and J. M. Montagna, "Stakeholders Selection for Interorganizational Systems: A Systematic Approach," in The Past and Future of
Information Systems: 1976–2006 and
Beyond, S. E. David Avison, John Krogstie, Jan Pries-Heje, Ed., ed: Springer, 2006, pp. 39-50.
[31] J. Davison, J. B. Thompson, D. A. Deeks, and M. Lejk, "PisoSIA® a stakeholder approach to assist change in information systems development projects and aid
process improvement," Software Quality Journal, vol. 14, pp. 25-36, 2006.
[32] A. Boonstra, "Interpreting an ERP-implementation project from a stakeholder perspective," International Journal of Project Management, vol. 24, pp. 38-52, 2006.
[33] M. Glinz and R. J. Wieringa, "Guest Editor's Introduction: Stakeholders in Requirements Engineering," IEEE Software, vol. 24, pp. 18-20, 2007.
[34] R. W. Woolridge, D. J. McManus, and J. E. Hale, "Stakeholder risk assessment: An outcome-based approach," IEEE
SOFTWARE, vol. 24, pp. 36-45, 2007.
[35] M. Ramzan, "Intelligent Requirement Prioritization using Fuzzy Logic," National University, 2010.
[36] M. Ramzan, S. Anwar, and A. A. Shahid, "Need to Redefine “Value” and Case for a New “Software Valuation” Technique: An Analytical Study," in Proceedings of International Conference on Computer Engineering and Applications (ICCEA 2009), 2009.
[37] M. Ramzan, M. A. Jaffar, M. A. Iqbal, S. Anwar, and A. A. Shahid, "Value based fuzzy requirement prioritization and its evaluation framework," in Fourth International Conference on Innovative
Computing, Information and Control
(ICICIC), 2009, pp. 1464-1468.
[38] M. Ramzan, M. A. Jaffar, and A. A. Shahid, "Value based intelligent requirement prioritization (VIRP): expert driven fuzzy logic based prioritization technique,"
International Journal Of Innovative
Computing, Information And Control, vol. 7, 2011.
[39] M. Ramzan, M. Q. Khan, M. A. Iqbal, M. Aasem, A. Jaffar, S. Anwar, et al., "A genetic algorithms based approach for conflicts resolution in requirement," International Journal of the Physical Sciences, vol. 6, pp. 828-836, 2011.
[40] C. Pacheco and I. Garcia, "A systematic literature review of stakeholder identification methods in requirements elicitation," Journal of Systems and Software, vol. 85, pp. 2171-2181, 2012. [41] S. I. Gallant, Neutral network learning and
expert systems: MIT press, 1993.
[43] N. K. Bose and P. Liang, Neural network
fundamentals with graphs, algorithms, and applications: McGraw-Hill, Inc., 1996. [44] A. Ali, M. Elfaki, and D. Norhayati, "Using
Naïve Bayes and Bayesian Networkfor Prediction of Potential Problematic Cases in Tuberculosis," International Journal of Informatics and Communication Technology (IJ-ICT), vol. 1, pp. 63-71, 2012.
[45] D. Pham and P. Pham, "Artificial intelligence in engineering," International Journal of Machine Tools and Manufacture, vol. 39, pp. 937-949, 1999.
[46] M. T. Hagan, H. B. Demuth, and M. Beale, "Neural network design," PWS, Publishing,
Boston, MA, USA, 1996.
[47] M. Hung, M. Hu, M. Shanker, and B. Patuwo, "Estimating posterior probabilities in classification problems with neural networks," International Journal of
Computational Intelligence and