ULTRASONIC ARRAY IMAGING METHOD FOR
CONCRETE MATERIALS
QIUFENG LI, XUEJUAN YANG, PAN HUANG, YIN LIAO
Key Laboratory of NDT (Nanchang Hangkong University), Ministry of Education, 330063, Jiangxi, China
ABSTRACT
Because of the need of rapid detection of internal defects and embedded object in concrete structures, a ultrasonic detecting method with linear array transducers is presented here, which is the high-resolution and efficient imaging technique for concrete materials by combining with synthetic aperture focusing technique (SAFT). At first, simulation data of array detection are processed to be amalgamated B-scan data of concrete materials according to the structural characteristics of linear array transducers. And then the B-scan data collected from numerical simulation are reconstructed in the light of geometrical relation of ultrasonic path and SAFT. And the structural imaging figures are calculated at last. It can be shown from simulation results that the method with array detection is effective, and the embedded object in model can be identified effectively.
Keywords: Concrete Materials, Ultrasonic Array Transducers, SAFT
1. INTRODUCTION
Synthetic Aperture Focusing Technology (SAFT), which uses a series of single small aperture transducers to synthesize a large aperture transducer in order to achieve the focus process point by point within the structures, is an imaging technique which is developed in the 1970s. This method could improve the image resolution of detecting target effectively [1-3]. SAFT breaks through the classic concept of bearing resolution in conventional ultrasound imaging system, and can use the actual primitive small aperture transducers with low working frequency for high-resolution detection and observation at a distance. And the conflicting demands of system design parameters could be solved in direct imaging technology. SAFT has been applied to the ultrasonic detection and non-destructive evaluation of concrete material widely [4-6].
Concrete is a porous composite material of non-uniform by sand, cement and gravel [6,7]. When ultrasound is propagating in concrete materials, its attenuation presents exponentially with increment of frequency. And so the appropriate detecting frequency is usually selected within the range from 50kHz to 500kHz [8,9].
Ultrasonic detection for concrete structures is usually implemented with double-transducers. Several times detection is needed to complete about 1 m, and then the cross section image would be calculated after 10 minutes, which makes less
efficient for large area detection of concrete [10]. Detection with linear array transducers is presented combined with SAFT in this contribution. Conventional SAFT algorithm is also needed to be improved to adapt to the detection method in concrete structures.
2. ALGORITHM PRINCIPLE 2.1 Imaging Theory of SAFT
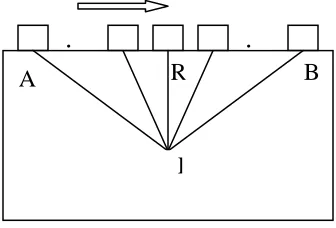
The SAFT algorithm focuses the received signals to any point of the reconstructed image by coherent superposition [10,11]. In this way, a large virtual transducer with variable focus is synthesized, and the schematic diagram of SAFT imaging is showed in Figure 1.
Because of angle of divergence of ultrasonic transducers, each reflective point inside concrete structure can be detected by transducers on different
apertures. In Figure 1, for example, P(xi,yj) is a
random reflective point, and the vertical distance
.
.
P
[image:1.612.336.504.529.643.2]A
R
B
from P to the scanning line is R=yj. P begins to enter into the detecting area while transducer is placed at position A, and P is closest to transducer while the transducer is moved to position O, and when the transducer is moved to position B, P leaves the area gradually. If the aperture number
between A and B is M, the reflection of P occurs in
the mth aperture at distance rm:
M
m
d
R
r
m=
2+
m2,
=
1
,
2
...
(1)Here R is fix value, dm is the transverse distance
from each aperture to P, and rm is expressed as a
curve L in Figure 2. The time of flight (TOF) tm of
reflected echo in each aperture signal is expressed as:
M
m
V
r
t
m=
2
m/
,
=
1
,
2
...
(2)Here V represents the average velocity of
ultrasound propagating in concrete. In fact, SAFT algorithm aims to highlight P through superposition and average of reflected echo from P in each
measured aperture. To the mth aperture measured
signal F(dm,t), the reconstructed process for P can
be expressed as Equation 3:
∑
==
M m m m ii
F
d
t
M
y
x
S
1)
,
(
1
)
,
(
(3)Here F(dm,tm) denotes the echo from P in the mth
aperture, S(xi,yj) is also called the reconstructed
pixel [11,12].
2.2 Array SAFT Algorithm
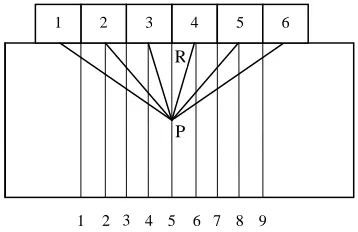
The working mode of linear array transducers is that each probe in linear array is as the transmitter in turn while others are as the receiver, and then the data of each receiver are collected and imported to computer for further processing. When the linear
array includes k transducers, 2k-3 apertures will be
formed after whole scanning for the detected object. Detection schematic of linear array transducers is
shown in Figure 3. Because of divergence angle of the ultrasonic probe beam, assuming the reflective
point P can only be detected by n transducers,
which n≤k. And the vertical distance from P to
the scanning surface is R.
Because the point P can only be detected by the n
transducers, 2n-3 apertures will be obtained after
whole scanning for the detected object. The
distance ri from each probe to P is variable, which
is given as follow:
n
i
d
R
r
i=
2+
i=
1
,
2
...
(4)Here R is fix value, di is the transverse distance
from each probe to P. The ultrasonic path Sm of
detection signal to P in each effective aperture is also variable and described as Equation 5.
−
=
+
=
+
=
+
=
+
=
− −)
3
2
...
5
,
3
,
1
(
2
4
,
)
2
...
4
,
2
,
0
(
2
3
,
2 1n
m
m
i
r
r
n
m
m
i
r
r
S
i i i im (5)
Here Sm varies with different recurrence relations
when m is odd number or even number. Provided P
is located at the odd effective aperture, the trend of
Sm’ shows in Figure 4. And if P is located at the
even effective aperture, the trend of Sm’’ shows in
Figure 5.
Therefore TOF tm of reflected echo in each
aperture signal is also different, and can be calculated by Equation 6.
)
3
2
(
,...,
2
,
1
,
/
=
−
=
S
V
m
n
t
m m (6)Here Sm= Sm’ while P is located at the odd value
effective aperture, or Sm= Sm’’ while P is located at
the even value effective aperture. V represents the
average velocity of ultrasound propagating in concrete.
[image:2.612.318.497.207.323.2]L
Figure 2 The Trend Ofrm
Figure 3: Detection Schematic Of Linear Array
4 5
3 2
1 2 3 4 5 6 7 8 9
P
1 6
[image:2.612.135.250.590.719.2]In the finally image, the reconstructed process for P in linear array transducers can be expressed as follows Equation 7.
∑
− =−
=
2 31
)
(
3
2
1
)
,
(
n
m m
t
F
n
y
x
S
(7)Here F(tm) denotes the echo fromP in the signal
of the mth aperture. S(x,y) is called the
reconstructed pixel for P. Any other reflective point within concrete structure can also be reconstructed according to the array SAFT algorithm of linear array transducers.
3. NUMERICAL SIMULATION 3.1 Simulation of Single Point Reflection
Testing signals of linear array transducers with 20 transducers which are reflected signals from the same point inside model is simulated in MATLAB
circumstance, and divergence angle is 90o. Gaussian
pulse is selected as excitation and the central frequency is 100kHz. The average velocity of
ultrasound in concrete is set as 3100m/s. Each tm of
the echo of each effective aperture could be calculated according to Equation 5, and then simulated signals of single point reflection are
generated by delay adjust with tm.
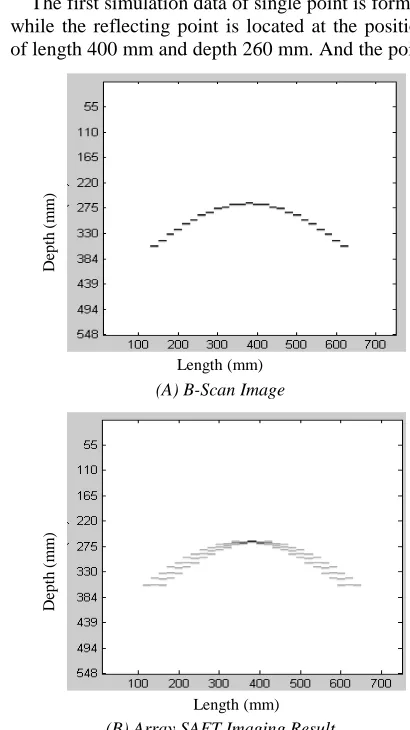
The first simulation data of single point is formed while the reflecting point is located at the position of length 400 mm and depth 260 mm. And the point
is just at the 19th aperture. Imaging results before
and after processed by array SAFT are shown in Figure 6(a) and Figure 6(b) respectively.
The second simulation data of single point is formed while the reflecting point is located at the position of length 340 mm and depth 260 mm. And
the point is just at the 16th aperture. Imaging results
before and after processed by array SAFT are shown in Figure 7(a) and Figure 7(b).
[image:3.612.91.521.69.453.2]From above the imaging results, more imaging data are used to process which lead to obvious focusing effect and to close to real position of the reflecting point after processed by array SAFT algorithm.
Figure 4: The Trend Of Sm’
Figure 5: The Trend of Sm’’
D
ept
h
(
mm)
Length (mm)
(A) B-Scan Image
D
ept
h
(
mm)
Length (mm)
[image:3.612.308.513.98.463.2]3.2 Finite Element Simulation
Finite element simulation of linear array transducers is conducted by using WAVE3000 which is commercial ultrasonic simulation software. The linear array is composed of six transducers, and diameter of each probe is 20 mm. Excitation signal is Gaussian pulse which central frequency is about 100kHz. The volumes of two simulation models are
(160mm×100mm×200mm) in which the same
cylindrical steel bar with the diameter of 20 mm is embedded. Embedded cylindrical steel bar are
located at the 4th scanning aperture and the 5th
scanning aperture respectively. Depth of cylindrical steel bar is 100 mm in both models. Four sides around the model are all set as infinite boundary conditions.
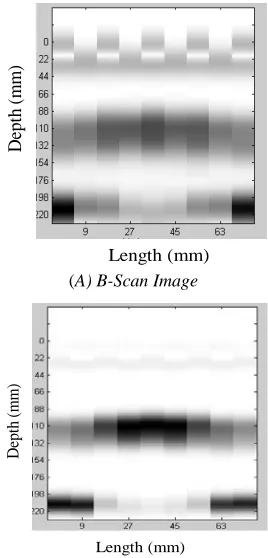
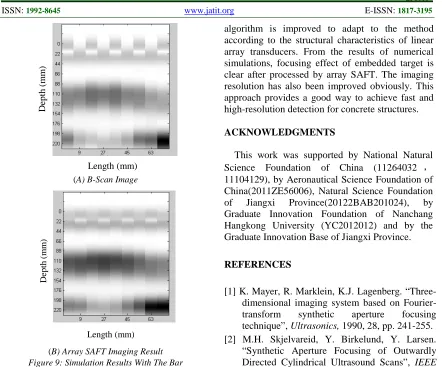
Array simulation data received by WAVE3000 are imported to MATLAB. And then the data are merged and formed original imaging result according to the structural characteristics of linear array, and after the merged data are reconstructed by array SAFT algorithm, last imaging result is calculated. Imaging results before and after processed by array SAFT are shown in Figure 8(a) and Figure 8(b) while the embedded cylindrical steel bar is located at the 5th scanning aperture. And imaging results before and after processed by array SAFT are shown in Figure 9(a) and Figure 9(b) while the embedded cylindrical steel bar is located at the 4th scanning aperture.
D
ept
h
(mm)
Length (mm)
(A) B-Scan Image
D
ept
h
(mm)
Length (mm)
(B) Array SAFT Imaging Result
Figure 7: The Second Simulation Results
D
ept
h
(mm)
Length (mm)
(A) B-Scan Image
D
ept
h
(mm)
Length (mm)
[image:4.612.130.264.405.684.2]The bright stripes at the top of the figures represent the surface direct wave. And the middle bright area is the echo of embedded object. And the bottom bright area is the echo for the bottom of model. The ultrasonic path of the bottom echo in each effective aperture is variable before processed by SAFT as Figure 8(a) and Figure 9(a). The bottom echoes will be corrected to the same level after processed by SAFT in theory, and imaging results after processed by SAFT are consistent with theoretical speculation. It can be shown from Figure 8 and Figure 9, the focusing effect is obvious after processed by SAFT whether embedded target is located at the odd scanning aperture or at the even scanning aperture. The imaging resolution has also been improved.
4. CONCLUSIONS
Ultrasonic SAFT reconstruction has become a high-resolution testing and imaging technology for the inspection of concrete elements. A detection method with linear array transducers is presented for raising working efficiency. Traditional SAFT
algorithm is improved to adapt to the method according to the structural characteristics of linear array transducers. From the results of numerical simulations, focusing effect of embedded target is clear after processed by array SAFT. The imaging resolution has also been improved obviously. This approach provides a good way to achieve fast and high-resolution detection for concrete structures.
ACKNOWLEDGMENTS
This work was supported by National Natural
Science Foundation of China (11264032 ,
11104129), by Aeronautical Science Foundation of China(2011ZE56006), Natural Science Foundation
of Jiangxi Province(20122BAB201024), by
Graduate Innovation Foundation of Nanchang Hangkong University (YC2012012) and by the Graduate Innovation Base of Jiangxi Province.
REFERENCES
[1] K. Mayer, R. Marklein, K.J. Lagenberg. “Three-dimensional imaging system based on Fourier-transform synthetic aperture focusing
technique”, Ultrasonics, 1990, 28, pp. 241-255.
[2] M.H. Skjelvareid, Y. Birkelund, Y. Larsen. “Synthetic Aperture Focusing of Outwardly
Directed Cylindrical Ultrasound Scans”, IEEE
Transactions on ultrasonics ferroelectrics and frequency control, 2012, Vol.59, No.11, pp. 2460-2469.
[3] S. Martin, R. Hans. “Synthetic aperture focusing of ultrasonic inspection data to enhance the probability of detection of defects in strongly
attenuating materials”, NDT and E
International, 2010, Vol.43, No.5, pp. 425-431.
[4] Q.F. Li, Y. Liao, M. Zhao. “Study on Improving Time-domain Resolution on Detecting Concrete
Structures”, Proc. Of International Conference
on Measuring Technology and Mechatronics Automation,Shanghai,2011,pp. 487-490. [5] Z. Hosseini, M. Momayez, F. Hassani, and D.
Lévesque, “Detection of inclined cracks inside concrete structures by ultrasonic SAFT”,
Review of Progress in Quantitative Nondestructive Evaluation, 2008, No.27, pp. 1298-1304.
[6] M.Schickert. “Ultrasonic NDE of Concrete”,
Proc. of 2002 IEEE Ultrasonics Symposium, München, 2002, NY: Institute of Electrical and Electronics Engineers (IEEE), 2002, pp. 718-727.
D
ept
h
(
mm)
Length (mm)
(A) B-Scan Image
D
ept
h
(
mm)
Length (mm)
[image:5.612.89.531.71.438.2](B) Array SAFT Imaging Result
[7] M. Krause, B. Milmann, F. Mielentz. “Ultrasonic Imaging Methods for Investigation of Post-tensioned Concrete Structures: A Study of Interfaces at Artificial Grouting Faults and Its
Verification”, Journal of Nondestructive
Evaluation, Special Issue on Acoustic and Electromag. Nondestr. Eval. of Concrete Structures, 2008, No.27, pp. 67–82.
[8] J.F. Chaix, V. Garnier, G. Corneloup.
“Ultrasonic Wave Propagation in
Heterogeneous Solid Media: Theoretical
Analysis and Experimental Validation”,
Ultrasonics, 2006, Vol.44, No.2, pp. 200-210. [9] P. P. Delsanto, S. Hirsekorn, “A Unified
Treatment of Nonclassical Nonlinear Effects in the Propagation of Ultrasound in Heterogeneous
Media”, Ultrasonics, 2004, Vol.42, No.1, pp.
1005-1010.
[10] M. Schickert, M. Krause, W. Müller, “Ultrasonic Imaging of Concrete Elements Using Reconstruction by Synthetic Aperture
Focusing Technique”, Journal of Materials in
Civil Engineering, 2003, No.15, pp. 235–246。 [11] Q.F. Li, L.H. Shi, D.K. Liang. “Research on
SAFT imaging of concrete structures base on
WDT”, Journal of Information and
Computational Science, Vol.5, No.2, 2008, pp. 911-918.
[12] Jianhua Tong, Chinlung Chiu, Chungyue Wang, “Improved synthetic aperture focusing technique by HHT for imaging defects inside a
concrete structure”, IEEE Transactions on