Munich Personal RePEc Archive
Tax decentralization and public deficits
in OECD countries
Baskaran, Thushyanthan
University of Gothenburg, Gothenburg Centre of Globalization and
Development
2011
1
Tax decentralization and public deficits in OECD countries
Thushyanthan Baskaran University of Gothenburg
& Gothenburg Centre of Globalization and Development
Keywords: Tax decentralization, Public deficits, Fiscal instability
Abstract
This article explores the effect of sub-national tax autonomy and sub-national
control over shared taxes on primary deficits with panel data for 23 OECD
countries over the 1975-2000 period. The results suggest that sub-national tax
autonomy has a U-shaped effect on primary deficits. We find that the “average”
country in the sample could increase the fiscal stability of its public sector by
reducing sub-national tax autonomy. There is also some indication that
subnational control over shared taxes increases fiscal stability, but we obtain this
result only if Belgium and Spain are included in the sample.
2
Introduction
Anecdotal evidence suggests that sub-national fiscal autonomy may cause budget imbalances and
macroeconomic instability. In Brazil, for example, sub-national governments borrowed heavily from
state-owned banks and then defaulted on repayment, thereby forcing the federal government to bail out
the banks to forestall financial chaos (Samuels 2003). In 1992 the German constitutional court
compelled the federal government to grant bailout transfers to two states after they had accumulated
such high levels of public debt that they found it difficult to provide a basic level of public services to
their citizens (Seitz 1999). In Argentina, the structure of the intergovernmental transfer scheme
aggravated macroeconomic difficulties by providing sub-national governments with incentives to
over-spend and over-borrow (Tomassi et al. 2001).
These developments have drawn scholarly attention to the relationship between fiscal decentralization
(i.e. subnational tax and/or expenditure autonomy) and public finances. One strand of the literature,
exemplified by contributions such as Wildasin (1997), Wibbels (2000), or Goodspeed (2002), suggests
that sub-national fiscal autonomy may indeed cause fiscal policy distortions and inefficiently high
levels of public debt because of soft budget constraints or coordination failures. However, there is a
different and well established strand of the literature which claims that fiscal decentralization ensures
allocative efficiency (Oates 1972) and prevents inefficient government intervention (Brennan and
Buchanan 1980). Consequently, this strand of the literature indicates that fiscal decentralization will
increase the fiscal stability of the public sector.
Since the relationship between fiscal decentralization and fiscal outcomes is theoretically ambiguous,
we examine in this article empirically whether fiscal decentralization improves or endangers public
3 the existing literature on this question in two ways.
The first contribution of this article is that two new measures for the extent of tax decentralization are
used to empirically operationalize the concept of fiscal decentralization. These new measures are
provided by Stegarescu (2005) and are constructed according to a classification proposed by the OECD
(OECD 1999). The Stegarescu (2005) measures constitute an improvement over the “revenue
decentralization” measures that are traditionally used in the fiscal federalism literature because they
attempt to capture the “true” fiscal autonomy of sub-national governments. That is, the traditional
measures of tax decentralization, which are usually based on IMF GFS data, do not distinguish between
revenues obtained by sub-national governments through taxes over which they may decide
autonomously, and revenues obtained through taxes over which they have no control (Ebel and Yilmaz
2002). The Stegarescu (2005) measures, on the other hand, take the autonomous taxing power of
subnational governments into account. In particular, they capture over-time changes in the tax
autonomy of subnational governments.1
The second contribution of this article is that non- linearities in the relationship between subnational
tax autonomy and public deficits are explicitly modeled. Most studies on the relationship between
fiscal decentralization and public finances use a linear specification (De Mello 2000, Freitag and Vatter
2008, Baskaran 2010).2 By doing so, they implicitly assume that the effect of an additional increase in
fiscal decentralization on public deficits is the same irrespective of its currently prevailing level. This is
a strong assumption. It is more likely that the effect of an increase in fiscal decentralization on public
deficits depends on its currently prevailing level. For example, an additional increase in fiscal
decentralization might improve the fiscal stability of the public sector if a country is highly centralized
4
decentralized, then an additional increase might exacerbate coordination problems and lead to worse
fiscal outcomes. Yet, it is also possible that either a completely centralized or decentralized public
sector is preferable to an intermediate system, as intermediate systems might suffer from a blurring of
responsibilities and an inefficient overlap of government activities. Consequently, we estimate in this
article empirical models that allow for the possibility of a non-linear relationship between our measures
for tax decentralization and public deficits.
The remainder of this article is organized as follows. The next section provides some theoretical
considerations on the relationship between fiscal decentralization and public finances and a short
literature review. The data used in the empirical analysis and the econometric model are described in
the following section. We then present the results and end with some concluding remarks.
The link between tax decentralization and public deficits
There are a number of reasons why fiscal decentralization might endanger the fiscal stability of the
public sector: First, if the fiscal constitution and/or the political reality in a country is such that the
federal government is held responsible for the fiscal well-being of sub-national governments, then the
latter might expect to receive a bailout in times of fiscal crisis. This expectation will render the budget
of sub-national governments “soft” and induce them to increase expenditures and/or decrease taxes,
which in turn will lead to higher public deficits (Wildasin 1997, Goodspeed 2002).
A second argument is that fiscal decentralization might lead to larger deficits if it is used by the central
government to impose new or additional spending responsibilities on subnational governments without
giving them sufficient revenue raising capabilities. Decentralization processes might be characterized
5
eyes of the population (Rodirguez-Pose and Gill 2003). Consequently, a correlation between some
measures of fiscal decentralization, in particular tax decentralization, and public deficits might emerge.
Yet, it is also possible that fiscal decentralization increases deficits if subnational governments are too
powerful. In this case, they can force the federal government to assume any debt that they have
acquired in exchange for political support. Granting additional fiscal autonomy to subnational
governments in such circumstances might then lead to more fiscal instability. Rodriguez-Pose and Gill
(2004) illustrate this problem with the example of Brazil. Because Brazilian states have traditionally
been politically powerful, they over-borrowed assuming that they could eventually force the federal
government to take over their debt.
Third, if the fiscal constitution is characterized by extensive tax sharing arrangements and horizontal
equalization, incentives for efficient and growth-enhancing activities are likely to be diminished since
these institutional features are in effect a tax on sound fiscal policies. Even though these inefficiencies
must not necessarily lead to higher deficits, a positive correlation between the receipts from tax sharing
arrangements or horizontal transfer schemes and the accumulation of debt is often observed
empirically. Rodden (2005), for example, finds that the speed of fiscal consolidation of German States
after negative fiscal shocks is inversely related to the amount of transfers received during horizontal
equalization.
Furthermore, decentralization and the related concept of federalism increases the number of
veto-players by providing additional institutional channels, such as a second chamber of parliament, through
which opponents of reforms can voice their opposition (Tsebelis 1995). Since a larger number of
political actors have to agree to fiscal decisions in decentralized systems, budget consolidations by
6
of obstruction, the cohesion of national fiscal policies becomes more difficult to maintain when every
individual jurisdiction may act independently of the federal and other sub-national governments
(Wibbels 2000).3
However, there are also a number of theoretical arguments why fiscal decentralization should decrease
public deficits. Decentralization of fiscal authority will in all likelihood induce competition for mobile
tax payers by sub-national governments (Tiebout 1956, Brennan and Buchanan 1980). By analogy to
private markets, competition might force local governments to implement optimal policies both in
terms of technical and allocative efficiency. Increases in the efficiency of the public sector might then
lead to lower deficits if they imply, for example, that a given amount of public goods can be provided
with fewer resources. Furthermore, under fiscal competition, jurisdictions which maximize the
inter-temporal revenue flow should choose low levels of debt in order to motivate citizens to move into their
jurisdictions, as low levels of indebtedness signal, ceteris paribus, low future taxes.
Fiscal decentralization may also be interpreted as a means to use dispersed information efficiently
(Hayek 1945). Lower-level governments are likely to be better informed about local circumstances, and
are capable to take these into account when implementing policies. For example, the better knowledge
of local geographical conditions that sub-national officials possess might be helpful in avoiding
situations where ex-post costs of infrastructure projects turn out to be higher than initially projected.
Under a decentralized public sector, jurisdictions can also experiment with new policies as suggested
by the literature on laboratory federalism (Oates 1999). Institutional arrangements which ensure sound
fiscal policies can be developed gradually in individual jurisdictions and, if they turn out to be
7
mechanisms which were intended to arrest the growth of public debt, in particular the so called “debt
brake”, have been initially introduced in a small number of sub-national jurisdictions, but gradually
extended to a larger number of cantons and eventually even adopted at the federal level (Feld and
Kirchgaessner 2007).
Overall, the theoretical literature on whether decentralization improves or endangers the fiscal stability
of the public sector is somewhat ambiguous. Therefore, this question is essentially an empirical one.
The empirical literature on this topic uses different approaches. First, case studies have been conducted
that focus on the systems of fiscal federalism prevailing in individual countries. For example, Rodden
et al. (2003) discuss the presence of soft budget constraints in various countries, and find that if
intergovernmental transfer schemes are ill-designed, fiscal decentralization might endanger public
finances. Von Hagen et al. (2000) discuss bailout episodes in four OECD countries: Australia,
Germany, Italy, and Sweden. They show that the likelihood of fiscal profligacy is related to both
idiosyncratic characteristics of sub-national jurisdictions and the political goals of the federal
government. They argue furthermore that unsustainable policies by sub-national jurisdictions must not
necessarily lead to a worsening of sub-national finances if the federal government, in anticipation of the
fiscal woes of lower-level jurisdictions, quietly increases vertical transfers. Finally, Kirchgaessner
(2005) argues, on the basis of the Swiss experience, that federal countries are more capable to limit
fiscal profligacy than unitary states.
Compared to the extensive number of case studies, empirical contributions that explicitly address the
relationship between fiscal decentralization and public deficits with econometric methods are relatively
rare. They have been conducted at the sub-national level within individual countries and at the
8
There are several notable examples for single country studies. Freitag and Vatter (2008) find that in
Switzerland, decentralized cantons are more likely to run balanced budgets in times of economic crisis.
Schaltegger and Feld (2008) discuss the propensity of Swiss cantons toward budget consolidations and
reach the conclusion that decentralization improves a canton’s ability to consolidate its budget. Rattso
(2004) finds for Norway that the specific system of decentralization in this country leads to a
smoothing of local budgets by the central government.
Even though studies based on data at the sub-national level within a country have important advantages
such as dealing with a relatively stable and comparable cultural and historical environment – a fact
which makes ceteris paribus conclusions more convincing– they also have some disadvantages. In
particular, the fiscal policies of the central government are usually neglected. This, however, is
problematic because the central government is, in many countries, responsible for the social security
system and provides large amounts of intergovernmental grants.
Despite the ability of cross-country studies to paint a more comprehensive picture, their number is
relatively small. De Mello (2000) explores the impact of decentralization on the deficit of both the
federal and sub-national governments separately with a sample consisting of thirty countries. He uses
sub-national tax autonomy as measured by the IMF’s GFS data as a proxy for decentralization and
concludes that it generally leads to an increase of sub-national deficits, suggesting that fiscal
decentralization might aggravate soft budget constraints and coordination failures. Fornsari et al.
(2000) find in a study with thirty-two developing and industrial countries that expenditure
decentralization contributes to a larger government sector, but that sub-national deficits have no impact
9
revenues is used, decentralization seems to decrease central government deficits. Thornton and Mati
(2008) examine whether fiscal decentralization impedes a coordinated national fiscal policy in OECD
countries. They find that changes in the fiscal balances of federal and sub-national governments tend to
be strongly correlated, and conclude on the basis of this evidence that decentralization does not
complicate fiscal stabilization policies. Baskaran (2010) finds that expenditure decentralization is
negatively related to public debt for a panel of seventeen OECD countries. Tax decentralization and
vertical fiscal imbalances, on the other hand, seem to have no (linear) effect on public debt. Finally,
Neyapti (2010) finds that both expenditure and revenue decentralization reduce, in general, budget
deficits, but that that the strength of this effect varies according to a number of country-specific factors
such as the size of the population or whether local elections are held.
Furthermore, some studies on public deficits which are not primarily concerned with fiscal
decentralization nonetheless include a variable in order to control for its degree. Singh and Plekhanov
(2005), for example, include a measure of expenditure decentralization in their regressions, even
though they are actually interested in the impact of borrowing restrictions on sub-national deficits.
They find that decentralization increases deficits once they control for the presence of country fixed
effects. Rodden (2002) studies the effect of intergovernmental transfer schemes, and in particular the
effect of vertical grants, on the fiscal stance of sub-national and central governments. The implicit
assumption is that grants reduce sub-national revenue autonomy and thereby increase the vertical fiscal
imbalance. He finds that vertical fiscal imbalances do not generally increase deficits, thereby indirectly
suggesting that revenue and/or expenditure autonomy have no significant effect on fiscal outcomes.
Data and empirical model
We use panel data on twenty-three high-income OECD countries4 for the 1975-2000 period to estimate
10
Yit = ai+ct+ β1 DECit+ β2 DECit × DECit+δXit+εit. (1)
The dependent variable, Yit is the general government primary deficit to GDP ratio. On the right hand
side, we include country fixed effects, ai, year fixed effects, ct, measures for the extent of fiscal
decentralization, DECit, their quadratic transformations, DECit ×DECit , and a vector of additional
control variables, Xit. All variables used in the analysis are explained and their sources are listed in
Table 1. Summary statistics can be found in Table 1 in the Data Appendix (Supplementary Data).
[Table 1 about here]
We use as dependent variable the general government primary deficit to GDP ratio because fiscal
profligacy at the sub-national level must not necessarily lead to increases in sub-national deficits. For if
the federal government borrows in place of sub-national governments and passes these additional
revenues quietly to the latter by means of intergovernmental transfers, the federal budget might display
a deficit while sub-national budgets remain balanced (Rodriguez-Pose and Gill 2003). Thus, it is
necessary to consider the fiscal stance of all tiers of government simultaneously when discussing the
effects of fiscal decentralization on public deficits.
The choice of the right-hand side variables is derived from theoretical reasoning and econometric tests.
Country fixed effects are included to control for both unobserved heterogeneity and for rarely
time-varying institutional features such as the political (presidential vs. parliamentary) or electoral
(proportional vs. majoritarian) system5; year fixed effects are included to control for common shocks.
Because tests indicate the presence of both heteroscedasticity and autocorrelation, we use robust
11
All regressions control for the population size, GDP growth, the unemployment rate, the inflation rate,
an urbanity index, the share of the working population, a measure of openness, and the interest rate on
government bonds. These measures are likely to be important economic or socio-demographic
determinants of public deficits. They are mostly obtained from OECD databases. The only exception is
the urbanity index, which is obtained from the UN’s World Urbanization Prospects database.
Since there might be ideological differences in the attitude towards fiscal stability, we also control for
the ideology of the federal government by using an index provided by Armingeon et al. (2008). In
addition, we control in all regressions for the political authority of subnational governments by
including the regional authority index by Hooghe et al. (2010) because politically powerful subnational
governments may have a better resource base than powerless ones and therefore may be able to run
sounder fiscal policies. On the other hand, central governments might find it difficult to impose hard
budget constraints if subnational governments are too powerful.
Finally, we also include in some regressions the total government revenue to GDP ratio and the
subnational tax revenue to GDP ratio to control for the expenditure capacity of subnational
governments. We desist from including these variables in all models because they might suffer from
endogeneity problems when central or subnational governments deliberately raise revenues because
they plan to spend more or expect higher deficits.6 These variables are obtained from OECD databases.
(See Table 1 for the specific sources).
We apply two different measures of fiscal decentralization, one pertaining to the ability of sub-national
12
revenues accrue exclusively to sub-national governments, OTD), and one pertaining to sub-national
control over the revenue split for taxes that are shared with the federal government (STD).
The OTD and STD measures are obtained from Stegarescu (2005). He constructs these measures
according to a classification proposed by OECD (1999). OECD (1999) classifies individual taxes
within a country into three main categories: i) Taxes whose revenue accrue to subnational governments
and for which subnational government can either determine rates and/or bases independently, ii) taxes
that are shared between the central and subnational governments and for which, at the very least, the
revenue split cannot be changed without the consent of subnational governments, and iii) all other
taxes. The OTD measure is defined as the sum of the revenues from the taxes belonging to the first
category divided by total general government tax revenues. The STD7 measure is defined as the sum of
the revenues from taxes belonging to the second category divided by total general government tax
revenues.8
Many countries have experienced significant variability with respect to the level of tax decentralization.
See Figure 1 in the Data Appendix (Supplementary Data) for plots of the evolution of the OTD
measure in all countries included in the sample. Countries such as Belgium, Portugal, and Spain have
considerably expanded the extent of subnational tax autonomy. On the other hand, the United Kingdom
has become more centralized during the sample period. Other countries, e.g. Sweden and Norway,
exhibit both phases of distinct centralization and decentralization, but no overall trend. Finally, there
are also some countries that have exhibited relatively constant levels of fiscal decentralization, in
particular such archetypical federations as Canada, Switzerland, and the United States.
13
decentralization measure (STD) during the sample period. Only five countries - Austria, Belgium,
Germany, Spain, and Switzerland – exhibit positive values for this variable, and therefore only these
five countries are included in the figure. The other countries in the sample consistently exhibit a value
of 0. In fact, only Belgium and Spain display significant over-time variation in this variable.
Except perhaps for the inclusion of the quadratic transformation, the specification in Equation (1)
follows most of the existing literature. The quadratic transformations, i.e. OTD × OTX and STD ×
STD, respectively, are included to take possible non-linearities in the relationship between tax
decentralization and public deficits into account. In other words, by including these transformations, we
allow for the possibility that the effect of an increase in fiscal decentralization depends on its currently
prevailing level. If the estimated coefficients for these quadratic transformations are significant, we can
conclude that the OTD and STD variables have a non-linear (or more precisely a quadratic) effect on
public deficits.
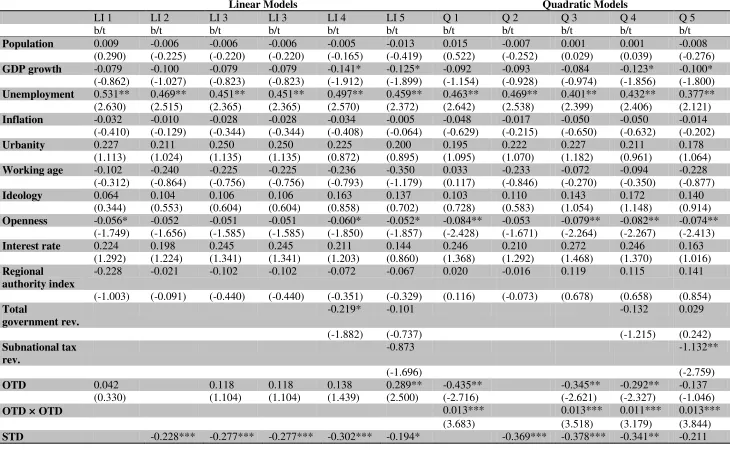
Baseline results
We first estimate five models without the quadratic terms in order to “replicate” the studies that assume
a linear relationship between fiscal decentralization and fiscal outcomes; thereafter, we re-estimate the
same models with the quadratic terms included in order to explore non-linear effects.
[Table 2 about here]
The results are collected in Table 2. The first two models in both sets of regressions include each of the
14
jointly; in the fourth model, we additionally include the government revenue to GDP variable. In the
fifth model, we expand the fourth model by including the subnational tax revenue to GDP ratio.
In the linear models, the estimated coefficient for the OTD variable is insignificant, whereas that for the
STD variable is significantly negative. These results suggest that sub-national control over the revenue
split for shared taxes leads to lower primary deficits. Prima facie, they also indicate that sub-national
tax autonomy is irrelevant for fiscal outcomes.
The non-linear models, however, compel us to re-evaluate this particular conclusion. The highly
significant coefficient for the quadratic transformation of the OTD variable indicates that sub-national
tax autonomy has a non-linear effect on primary deficits. Since the “base” effect is negative and the
quadratic transformation is positive, we conclude that the aggregate marginal effect of sub-national tax
autonomy on primary deficits is U-shaped: A marginal increase leads to smaller primary deficits at low
levels of sub-national tax autonomy, and to larger primary deficits at higher levels. Depending on the
particular model, the optimal (i. e., “deficit-minimizing”) level for our measure for sub-national tax
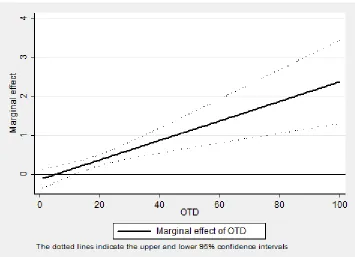
autonomy is between 5.3 percent and 16.7 percent. We plot the marginal effect of this variable at
different values of OTD in Figure 1. The plot is based on the estimates in model Q 5 which we consider
as our preferred model because it has the most complete specification. This plot illustrates once more
that at low levels of OTD, a further increase leads to lower deficits. However, the effect turns positive
from some point onwards.
[Figure 1 about here]
15
confirm the findings from the linear models and suggest that sub-national control over shared taxes
leads “linearly” to lower primary deficits. Yet, this conclusion should be viewed with caution given
that it is based on variation in at most only five countries.
Finally, we also calculate the marginal effect of the decentralization variables at the sample averages.
These marginal effects are collected in the lower part of Table 2. They suggest that the “average”
OECD country in our sample could reduce primary deficits by lowering sub-national tax autonomy and
increasing sub-national control of shared taxes.
The remaining control variables perform reasonably. The unemployment rate, for example, has a
consistently significant and positive effect on deficits, which suggests that high unemployment rates
tend to destabilize public budgets by requiring the government to increase spending. Openness, on the
other hand, displays negative coefficient estimates. This suggests that increasing openness leads to
more balanced budgets. Finally, both subnational tax revenues and total government revenues tend to
reduce public deficits.
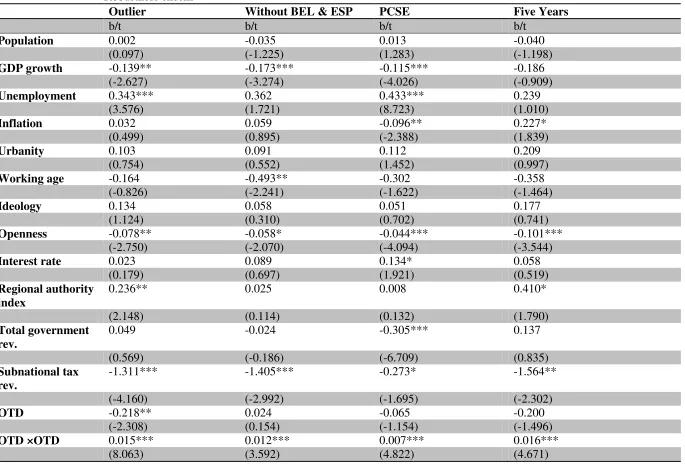
Robustness checks
In this section, we investigate the robustness of the baseline results. We conduct four robustness checks
on the basis of Model Q 5 in Table 2 (our preferred model). The results are collected in Table 3.
[Table 3 about here]
We study first whether our results from the previous section are sensitive to outliers by means of two
different tests. In the column entitled Outlier, we drop all observations for which the absolute value of
16
Dropping these outliers, however, does not change the main conclusions from the baseline models. The
OTD variable continues to display a U-shaped relationship with primary deficits; and the marginal
effect at the sample average remains positive. At the same time, the STD variable turns insignificant,
but continues to display a negative (albeit insignificant) coefficient at the sample average.
In the column entitled Without BEL & ESP, we drop Belgium and Spain from the sample. These two
countries might influence the estimates for the decentralization variables disproportionately because
they have experienced in the last two decades a rapid move toward decentralization. Since the relevant
reforms were deliberately implemented for political reasons, it is conceivable that the decision makers
have taken special care to ensure the fiscal stability of sub-national governments.
Dropping Belgium and Spain indeed suggests different conclusions– but only with respect to the STD
variable. When these two countries are not included, the STD variable displays an inversely U-shaped
relationship, and its marginal effect at the sample average is positive. This indicates that sub-national
control over shared taxes leads in general to higher fiscal imbalances; only in Belgium and Spain, it
seems to have had a positive effect on the fiscal stability of the public sector. That is, once only
countries with a long tradition of shared taxes are included, in particular Austria and Germany, tax
sharing appears to increase deficits.
The conclusions with respect to the OTD variable, however, are not affected by the exclusion of
Belgium and Spain. This decentralization variable displays a U-shaped relationship; and its effect at the
17
In the column entitled PCSE, we collect the results from a model where hypothesis tests are conducted
on the basis of Panel Corrected Standard Errors. The standard errors are also robust to AR 1
autocorrelation. The results with respect to the decentralization variables, however, are essentially the
same as in the baseline models.
In the column entitled Five Years, we collect the results from estimating our preferred model in five
year averages in order to control for short-term variability in the dependent and control variables. This
model includes five-year period instead of year fixed effects; standard errors continue to be clustered at
the country level. The results are once again in line with the baseline results.
Overall, these robustness checks confirm the baseline results for the OTD variable. With regard to the
STD variable, however, they indicate that the results are sensitive to the in- or exclusion of Belgium
and Spain.
Conclusion
In this article, we have explored whether fiscal decentralization, when measured by the extent of
national control over tax revenues, has an effect on primary deficits. Our results indicate that
sub-national control over shared taxes is negatively and linearly related to primary deficits. This conclusion,
however, is mainly driven by developments in Belgium and Spain. While suggestive, this particular
finding should therefore be viewed with caution. Sub-national tax autonomy (i.e., control over own
taxes), on the other hand, has a non-linear effect. The estimates indicate that an increase in subnational
tax autonomy results in more fiscal stability in countries where the prevailing level of tax autonomy is
low. Yet, they also suggest that tax autonomy has a detrimental effect for fiscal stability from some
18
Given the widespread trend towards more decentralized government, the question of how to organize
and manage decentralization processes has acquired added importance (Rodden 2006). The findings in
this study should therefore be of interest to policy makers in both developed and developing nations as
they provide answers to one important challenge for fiscal decentralization initiatives: how to ensure
the stability of the fiscal sector when responsibility for fiscal policy is shared among various units of
government.
In summary, these regressions appear to indicate that granting too much tax autonomy to subnational
jurisdictions can be problematic. That fiscal decentralization can begin to be detrimental at relatively
low levels is an unexpected finding, especially because the theoretical literature reviewed in Section 2
points to a number of reasons why decentralization should lead to more sustainable fiscal policies.
One explanation for this unexpected finding might lie in how the countries that were studied in this
article have managed their decentralization processes. Bahl (1999) lists a set of criteria, or
implementation rules, which should be fulfilled for decentralization to unfold its beneficial
implications. Most notably, he argues that the political authority of subnational governments should
match their fiscal authority and that they should have sufficient revenue sources. It is possible that at
least some of the countries in our sample have breached these rules. In particular, decentralization
could have been initiated by the central government as a stratagem to divest itself from its
responsibilities. Central governments may have imposed new tasks on subnational governments while
not increasing their funding sources sufficiently. In other words, subnational governments may have
had too little political power to effectively defend themselves against unfunded mandates. While such
19
public deficits, tax autonomy as such would not be the cause for the increases in public deficits, but
rather insufficient tax autonomy and too little political power.9
One possible implication of the results in this article, therefore, is that subnational fiscal autonomy can
unfold its beneficial consequences only if central governments are truly committed to decentralization.
If, on the other hand, fiscal decentralization is only a convenient means for central governments do deal
with their own fiscal problems, it might have undesirable consequences.
A second explanation for the unfavorable findings regarding subnational tax autonomy is that our
regressions rely on the within-variation only, and such highly decentralized countries as Switzerland
and the United States exhibit only little over-time variation in the tax decentralization variable. That is,
little information on the effects of decentralization on public deficits is used from countries that are
widely considered to be successful federations. This means in turn that the estimates rely to a large
extent on information from countries that have little experience with decentralization. It is therefore
likely that the results are overly pessimistic. In fact, we cannot dismiss the possibility that (even more)
tax autonomy will improve fiscal stability in countries that have sufficient experience with
decentralized policy making, i.e. in countries such as Switzerland and the United States. On the other
hand, subnational tax autonomy seems to be problematic for fiscal stability in countries that have little
experience with decentralization, at least in the short run.
It follows from our results that one challenge for future research on the implications of fiscal
decentralization for fiscal stability is to pay more attention to the details of why processes of
decentralization are initialized and how they are managed. In particular, detailed studies on the
20
insights on how to successfully manage decentralization processes, and to understand what conditions
have to prevail for decentralization to lead to favorable outcomes. Insights gained from such studies
will ensure that countries which decide to increase the extent of subnational autonomy will fully reap
the benefits of decentralization.
Notes
Supplementary data can be found at wwww.publius.oxfordjouranls.org. The author thanks three
anonymous referees for their helpful comments and suggestions.
1. Sorens (2011) notes in a recent contribution that the Stegarescu measures, too, have some shortcomings. He argues that they do not control for unfunded mandates and may consequently give a misleading picture of the true level of fiscal decentralization within a country.
2. However, sometimes interaction effects are included to condition the effect of fiscal decentralization on other variables.
3. As pointed out by Freitag and Vatter (2008), the veto-player argument can also be used in an opposite fashion. That is, it is possible to argue that fiscal decentralization will lead to lower deficits because agreement on additional expenditures funded through debt becomes harder.
4. Australia, Austria, Belgium, Canada, Denmark, Finland, France, Germany, Greece, Iceland, Ireland, Italy, Japan, Luxembourg, Netherlands, New Zealand, Norway, Portugal, Spain, Sweden, Switzerland, United Kingdom, United States.
5. Hausman-test and F-tests on the significance of the country dummies also suggest that the fixed effects model is appropriate.
6. Note, however, that our results change neither qualitatively nor quantitatively between the models that include and those that omit these variables, thereby suggesting that such problems are not affecting our results.
7. Note that the original variable in Stegarescu’s dataset is constructed as the sum of own and shared taxes. In this article, we redefine this variable (by appropriate subtraction) such that it only covers shared taxes.
8. While the Stegarescu (2005) dataset covers the period 1975-2001, observations in 2001 are missing for several countries. Therefore, we restrict the sample in the regressions to the 1975-2000 period. Because of a suggestion by a referee, we attempted to update the database such that it additionally covers the period 2001-2006 by following the methodology in Stegarescu (2005) and OECD (1999)
21
database when the OTD and STD variables are constructed. Since we lacked detailed information on the decisions made in Stegarescu (2005) regarding the classification of the taxes, it was difficult to
ensure complete consistency with Stegarescu’s data. For the time-frame where both our and
Stegarescu’s data were available, the correlation was around 0.9 for the respective OTD and STD measures. (In order to conduct this comparison, we calculated our data from 1995 onwards.) This indicates that both datasets are roughly similar, but it also shows that they are not fully consistent. In addition, there were some notable differences in the levels of the OTD and STD measures for some countries. Nevertheless, the results (available upon request) when using the updated database are in line with those reported in the article.
22
References
Armingeon, Klaus., Marlène Gerber, Philipp Leimgruber, and Michelle Beyeler (2008). Comparative
Political Data Set 1960-2006. Institute of Political Science, University of Berne 2008 (Database).
Bahl, Roy (1999). Implementation rules for fiscal decentralization. International Studies Program
Working Paper (Georgia State University).
Baskaran, Thushyanthan. (2010). On the link between fiscal decentralization and public debt in OECD
countries. Public Choice 145, 351-378.
Brennan, Geoffrey and James M. Buchanan (1980). The power to tax: analytical foundations of a fiscal
constitution. Cambridge: Cambridge University Press.
De Mello, Luiz R. (2000). Fiscal decentralization and intergovernmental fiscal relations: a cross
country analysis. World Development 28(2), 365–380.
Ebel, Robert D. and Serdar Yilmaz (2002). On the measurement and impact of fiscal decentralization.
World Bank Policy Research Working Paper No. 2809.
Feld, Lars P. and Gebhard Kirchgässner (2007). On the effectiveness of debt brakes: the Swiss
experience. In Reinhard Neck and Jan-Egbert Sturm (Eds.), Sustainability of public debt,
23
Fornasari, Francesca., Steven B. Webb, and Heng-Fu Zou (2000). The macroeconomic impact of
decentralized spending and deficits: international evidence. Annals of Economics and Finance 1(2),
403–433.
Freitag, Markus and Adrian Vatter (2008). Decentralization and fiscal discipline in sub-national
governments: evidence from the Swiss federal system. Publius: The Journal of Federalism 38(2), 272–
294.
Goodspeed, Timothy J. (2002). Bailouts in a federation. International Tax and Public Finance 9(4),
409–421.
Hayek, Friedrich A. (1945). The use of knowledge in society. American Economic Review 35(4), 519–
530.
Hooghe, Liesbet, Gary Marks, and Arjan H. Schakel (2010). The rise of regional authority: a
comparative study of 42 democracies (1950-2006). London: Routledge.
Kirchgässner, Gebhard (2005). Sustainable fiscal policy in a federal state: the swiss example. Swiss
Political Science Review 11(4), 19–46.
Neyapti, Bilin (2010). Fiscal decentralization and deficits: international evidence. European Journal of
24
Oates, Wallace E. (1972). Fiscal federalism. New York: Harcourt Brace Jovanovich.
Oates, Wallace E. (1999). An essay on fiscal federalism. Journal of Economic Literature 37(3), 1120–
1149.
OECD (1999). Taxing power of state and local government. OECD Tax Policy Studies 1. Paris:
OECD.
Rattso, Jorn (2004). Fiscal adjustment under centralized federalism: empirical evaluation of the
response to budgetary shocks. FinanzArchiv 60(2), 240–261.
Rodden, Jonathan A. (2002). The dilemma of fiscal federalism: grants and fiscal performance around
the world. American Journal of Political Science 46(3), 670–687.
Rodden, Jonathan A. (2005). And the last shall be first: federalism and soft budget constraints in
Germany. Mimeo (Massachusetts Institute of Technology).
Rodden, Jonathan A. (2006). Hamilton’s Paradox: the promise and perils of fiscal federalism.
Cambridge: Cambridge University Press.
Rodden, Jonathan A., Gunnar S. Eskeland, and Jennie Litvack (2003). Fiscal decentralization and the
challenge of hard budget constraints. Cambridge: MIT Press.
25
implications. Environment and Planning C: Government and Policy 21, 333-351.
Rodriguez-Pose, Andrés and Nicholas Gill (2004). Reassessing relations between the centre and the
states: the challenge for the Brazilian administration.
Samuels, David (2003). Fiscal straightjacket: the politics of macroeconomic reform in Brazil,
1995-2002. Journal of Latin American Studies 35, 545–569.
Schaltegger, Christoph A. and Lars P. Feld (2007). Are fiscal adjustments less successful in
decentralized governments. CESifo Working Paper Series No. 1946.
Seitz, Helmut (1999). Subnational government bailouts in Germany. ZEI Working Paper No. B 20.
Singh, Raju and Alexander Plekhanov (2005). How should subnational government borrowing be
regulated? Some cross-country empirical evidence. IMF Working Paper No. 54.
Sorens, Jason (2011). The Institutions of Fiscal Federalism. Publius: The Journal of Federalism 41 (2),
207–231.
Stegarescu, Dan (2005). Public sector decentralization: measurement concepts and recent international
trends. Fiscal Studies 26(3), 301–333.
Thornton, John and Armine Mati (2008). Fiscal institutions and the relation between central and
26
Tiebout, Charles (1956). A pure theory of local expenditures. Journal of Political Economy 64(5), 416–
424.
Tomassi, Mariano , Sebastián Saiegh, and Pablo Sanguinetti (2001). Fiscal federalism in Argentina:
policies, politics, and institutional reform. Economia: Journal of the Latin American and Caribbean
Economic Association 1, 157–211.
Tsebelis, George (1995). Decision making in political systems: veto players in presidentialism,
parliamentarism, multicameralism and multipartyism. British Journal of Political Science 25(3), 289–
325.
Vinuela, Julio (2000). Fiscal decentralization in Spain. IMF Working Paper.
von Hagen, Jürgen, Massimo Bordignon, Matz Dahlberg, Bhajan S. Grewal, Per Petterson, and
Helmut Seitz (2000). Subnational government bailouts in OECD countries: four case studies.
Inter-American Development Bank Research Network Working paper No. R-399.
Wibbels, Erik (2000). Federalism and the politics of macroeconomic policy and performance.
American Journal of Political Science 44(4), 687–702.
Wildasin, David (1997). Externalities and bailouts: hard and soft budget constraints in
27
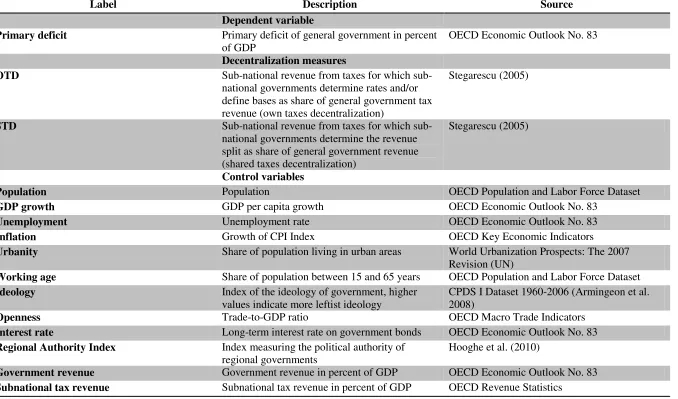
Table 1: Definition and source of variables
Label Description Source
Dependent variable
Primary deficit Primary deficit of general government in percent of GDP
OECD Economic Outlook No. 83
Decentralization measures
OTD Sub-national revenue from taxes for which sub-national governments determine rates and/or define bases as share of general government tax revenue (own taxes decentralization)
Stegarescu (2005)
STD Sub-national revenue from taxes for which sub-national governments determine the revenue split as share of general government revenue (shared taxes decentralization)
Stegarescu (2005)
Control variables
Population Population OECD Population and Labor Force Dataset
GDP growth GDP per capita growth OECD Economic Outlook No. 83
Unemployment Unemployment rate OECD Economic Outlook No. 83
Inflation Growth of CPI Index OECD Key Economic Indicators
Urbanity Share of population living in urban areas World Urbanization Prospects: The 2007 Revision (UN)
Working age Share of population between 15 and 65 years OECD Population and Labor Force Dataset
Ideology Index of the ideology of government, higher values indicate more leftist ideology
CPDS I Dataset 1960-2006 (Armingeon et al. 2008)
Openness Trade-to-GDP ratio OECD Macro Trade Indicators
Interest rate Long-term interest rate on government bonds OECD Economic Outlook No. 83
Regional Authority Index Index measuring the political authority of regional governments
Hooghe et al. (2010)
Government revenue Government revenue in percent of GDP OECD Economic Outlook No. 83
28
Table 2: Regressions of primary deficit to GDP ratio on decentralization measures; 1975-2000; Fixed effects
Linear Models Quadratic Models
LI 1 LI 2 LI 3 LI 3 LI 4 LI 5 Q 1 Q 2 Q 3 Q 4 Q 5
b/t b/t b/t b/t b/t b/t b/t b/t b/t b/t b/t
Population 0.009 -0.006 -0.006 -0.006 -0.005 -0.013 0.015 -0.007 0.001 0.001 -0.008 (0.290) (-0.225) (-0.220) (-0.220) (-0.165) (-0.419) (0.522) (-0.252) (0.029) (0.039) (-0.276)
GDP growth -0.079 -0.100 -0.079 -0.079 -0.141* -0.125* -0.092 -0.093 -0.084 -0.123* -0.100* (-0.862) (-1.027) (-0.823) (-0.823) (-1.912) (-1.899) (-1.154) (-0.928) (-0.974) (-1.856) (-1.800)
Unemployment 0.531** 0.469** 0.451** 0.451** 0.497** 0.459** 0.463** 0.469** 0.401** 0.432** 0.377** (2.630) (2.515) (2.365) (2.365) (2.570) (2.372) (2.642) (2.538) (2.399) (2.406) (2.121)
Inflation -0.032 -0.010 -0.028 -0.028 -0.034 -0.005 -0.048 -0.017 -0.050 -0.050 -0.014 (-0.410) (-0.129) (-0.344) (-0.344) (-0.408) (-0.064) (-0.629) (-0.215) (-0.650) (-0.632) (-0.202)
Urbanity 0.227 0.211 0.250 0.250 0.225 0.200 0.195 0.222 0.227 0.211 0.178 (1.113) (1.024) (1.135) (1.135) (0.872) (0.895) (1.095) (1.070) (1.182) (0.961) (1.064)
Working age -0.102 -0.240 -0.225 -0.225 -0.236 -0.350 0.033 -0.233 -0.072 -0.094 -0.228 (-0.312) (-0.864) (-0.756) (-0.756) (-0.793) (-1.179) (0.117) (-0.846) (-0.270) (-0.350) (-0.877)
Ideology 0.064 0.104 0.106 0.106 0.163 0.137 0.103 0.110 0.143 0.172 0.140 (0.344) (0.553) (0.604) (0.604) (0.858) (0.702) (0.728) (0.583) (1.054) (1.148) (0.914)
Openness -0.056* -0.052 -0.051 -0.051 -0.060* -0.052* -0.084** -0.053 -0.079** -0.082** -0.074** (-1.749) (-1.656) (-1.585) (-1.585) (-1.850) (-1.857) (-2.428) (-1.671) (-2.264) (-2.267) (-2.413)
Interest rate 0.224 0.198 0.245 0.245 0.211 0.144 0.246 0.210 0.272 0.246 0.163 (1.292) (1.224) (1.341) (1.341) (1.203) (0.860) (1.368) (1.292) (1.468) (1.370) (1.016)
Regional authority index
-0.228 -0.021 -0.102 -0.102 -0.072 -0.067 0.020 -0.016 0.119 0.115 0.141
(-1.003) (-0.091) (-0.440) (-0.440) (-0.351) (-0.329) (0.116) (-0.073) (0.678) (0.658) (0.854)
Total
government rev.
-0.219* -0.101 -0.132 0.029
(-1.882) (-0.737) (-1.215) (0.242)
Subnational tax rev.
-0.873 -1.132**
(-1.696) (-2.759)
OTD 0.042 0.118 0.118 0.138 0.289** -0.435** -0.345** -0.292** -0.137 (0.330) (1.104) (1.104) (1.439) (2.500) (-2.716) (-2.621) (-2.327) (-1.046)
OTD × OTD 0.013*** 0.013*** 0.011*** 0.013***
(3.683) (3.518) (3.179) (3.844)
29
(-3.431) (-3.244) (-3.244) (-3.495) (-1.781) (-2.820) (-3.201) (-2.386) (-1.213)
STD × STD 0.007 0.007 0.004 0.005
(1.170) (1.377) (0.700) (0.621)
Mean OTD 0.089 0.148** 0.158** 0.356***
Mean STD -0.310*** -0.317*** -0.304*** -0.168
N 494 494 494 494 494 494 494 494 494 494 494
Countries 23 23 23 23 23 23 23 23 23 23 23
R2 0.421 0.447 0.456 0.456 0.480 0.494 0.501 0.448 0.527 0.534 0.558
RMS error 2.268 2.216 2.198 2.198 2.149 2.119 2.105 2.215 2.051 2.035 1.981
Table 3: Regressions of Primary Deficit to GDP ratio on decentralization measures; 1975 to 2000, Robustness checks
Outlier Without BEL & ESP PCSE Five Years
b/t b/t b/t b/t
Population 0.002 -0.035 0.013 -0.040
(0.097) (-1.225) (1.283) (-1.198)
GDP growth -0.139** -0.173*** -0.115*** -0.186
(-2.627) (-3.274) (-4.026) (-0.909)
Unemployment 0.343*** 0.362 0.433*** 0.239
(3.576) (1.721) (8.723) (1.010)
Inflation 0.032 0.059 -0.096** 0.227*
(0.499) (0.895) (-2.388) (1.839)
Urbanity 0.103 0.091 0.112 0.209
(0.754) (0.552) (1.452) (0.997)
Working age -0.164 -0.493** -0.302 -0.358
(-0.826) (-2.241) (-1.622) (-1.464)
Ideology 0.134 0.058 0.051 0.177
(1.124) (0.310) (0.702) (0.741)
Openness -0.078** -0.058* -0.044*** -0.101***
(-2.750) (-2.070) (-4.094) (-3.544)
Interest rate 0.023 0.089 0.134* 0.058
(0.179) (0.697) (1.921) (0.519)
Regional authority index
0.236** 0.025 0.008 0.410*
(2.148) (0.114) (0.132) (1.790)
Total government rev.
0.049 -0.024 -0.305*** 0.137
(0.569) (-0.186) (-6.709) (0.835)
Subnational tax rev.
-1.311*** -1.405*** -0.273* -1.564**
(-4.160) (-2.992) (-1.695) (-2.302)
OTD -0.218** 0.024 -0.065 -0.200
(-2.308) (0.154) (-1.154) (-1.496)
OTD ×OTD 0.015*** 0.012*** 0.007*** 0.016***
31
STD -0.137 3.864*** -0.154** -0.228
(-1.070) (4.301) (-2.176) (-0.872)
STD × STD 0.004 -0.058*** 0.001 0.005
(0.602) (-3.898) (0.546) (0.471)
Mean OTD 0.358*** 0.495*** 0.200*** 0.416***
Mean STD -0.102 3.393*** -0.142** -0.189
N 463 446 494 98
Countries 23 21 23 23
R2 0.651 0.523 0.587
RMS error 1.598 2.031 1.343 1.581
32