Email: [email protected]
Received June 5,2013; revised July 7, 2013; accepted August 3, 2013
Copyright © 2013 Khaled Alatawi et al. This is an open access article distributed under the Creative Commons Attribution License, which permits unrestricted use, distribution, and reproduction in any medium, provided the original work is properly cited.
ABSTRACT
This paper investigates the architecture of Tbits/s Wavelength Division Multiplexing (WDM) system by using a Co-herent Optical Orthogonal Frequency Division Multiplexing (CO-OFDM) with 4-QAM for long haul transmissions of 1800 Km SM. A simulation of 20 WDM channels spaced at 50 GHz, and 20 OFDM signals each with 50 Gbits/s bitrate to produce data rate of 1 Tbits/s is built. The system performance is studied by observing the constellation diagram of the signal and the relationship of BER and OSNR with regard to transmission distance. The results show that the BER increases as the transmission distance increases. Also, as the transmission distance increases, the OSNR needs to be increased to maintain BER in less than 10−3.
Keywords: WDM; QAM; CO-OFDM; BER; OSNR
1. Introduction
The demand for high data rate and high capacity in the optical communications field has motivated researchers to try different modulation formats that can support this demand. Among this was Coherent Optical OFDM which got special attention due to its tolerance to Chro- matic Dispersion (CD) and Polarization Mode Dispersion (PMD) [1]. In addition, CO-OFDM has a great potential when it comes to receive sensitivity and spectral effi- ciency. Tbits/s transmission rate is available through the WDM (Wavelength Division Multiplexing) transmission system; but, this system has a low spectral efficiency due to wavelength spacing [2-4]. However, integrating WDM with CO-OFDM will produce a system with high spectral efficiency; better tolerance to PMD and CD; and, sig- nificantly high data rate. Because of the great potential of CO-OFDM, it is considered the solution to upgrade to- days’ 10 Gbits/s transmission rate to over 100 Gbits/s [5-8].
This paper demonstrates the architecture of Tbits/s WDM-CO-OFDM system. In this experiment, we stud-ied a WDM system by using CO-OFDM with 4-QAM (Quadrature Amplitude Modulation). 20 WDM channels are used with a 50 GHz wavelength space and 20 OFDM signals, each with 50 Gbits/s to produce a net data rate of 1 Tbits/s. To study the performance of the system, we focused on the constellation diagram of the system and
the relationship of the BER (Bit Error Rate) and the OSNR (Optical Signal to Noise Ratio) with regard to transmission distance.
2. System Design
The WDM CO-OFDM system is simulated and studied using an OptiSystem V.11 simulation tool. The simula- tion diagram is shown in Figure 1. The design consists
of three main parts: CO-OFDM Tx (Transmitter), optical fiber link and CO-OFDM Rx (Receiver). In the WDM system, 20 channels with 50 GHz channel spacing are used to support 20 OFDM bands, each with a 50 Gbits/s bitrate to reach 1 Tbits/s data rate. Important simulation parameters are shown in Table 1.
2.1. CO-OFDM Tx Design
Figure 2 shows the CO-OFDM transmitter design; the bit
[image:1.595.315.537.673.736.2]stream is generated by a PRBS generator and mapped by a4-QAM encoder. The resulting signal is modulated by an
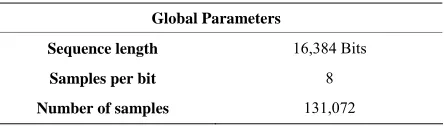
Table 1. Simulation global parameters.
Global Parameters
Sequence length 16,384 Bits
Samples per bit 8
Number of samples 131,072
Figure 1. WDM CO-OFDM system design.
Figure 2. CO-OFDM transmitter design.
OFDM modulator; the parameters are shown in Table 2.
After that, the resulting electrical signal is modulated to the optical signal using a pair of Mach-Zehnder modula- tors (MZM). Figure 3 shows the in-phase and quadrature
parts of the OFDM signal, where Figure 4 shows the
signal after the two MZMs which will be fed to the optical link. The laser source has a line width of 0.15 MHz and launch power of −5 dBm [9,10].
2.2. Optical Fiber Link
The optical link consists of 15 spans of 100 Km SMF, with a dispersion coefficient of 16 ps/nm/Km, nonlinear- ity coefficient of 2.6 × 10⁻²⁰;and, attenuation of 0.2
dB/Km. SMF parameters are shown in Table 3. Fiber
dispersion is compensated by the Dispersion Compensa- tion Fiber (DCF) of 20 Km with a -80 ps/nm/Km coeffi- cient in each span; DCF parameters are shown in Table 4.
The attenuation of SMF and DCF are balanced by optical amplifiers with 4 dB noise figure in each span.
2.3. CO-OFDM Rx Design
Figure 5 shows the CO-OFDM receiver design; to re-
cover the I/Q component of the OFDM signal, two pairs of balanced PIN photodetectors and LO (Local Oscillator) lasers are used. The balanced detectors perform the I/Q optical to electrical detection and help perform the noise cancellation. Electrical amplifiers are used to adjust the signal intensity [11,12]. After the balanced detectors the
Table 2. OFDM parameters.
OFDM Modulator
Number of subcarrier 512
IFFT 1024
guard interval 1/8
Table 3. SMF parameters.
SMF
Dispersion 16 ps/nm/km
Dispersion Slope 0.08 ps/nm2/km
PMD Coefficient 0.2 ps/km
Effective area 80 um2
Nonlinearity Coefficient 2.6 × 10⁻²⁰
Attenuation 0.2 dB/km
Table 4. DCF parameters.
DCF
Dispersion −80 ps/nm/km
Dispersion Slope −0.45 ps/nm2/km
PMD Coefficient 0.2 ps/km
Effective area 30 um2
Nonlinearity Coefficient 2.6 × 10 - 20
Figure 3. OFDM I/Q spectrum.
Figure 4. OFDM Signal after the two MZMs.
resulting signal is demodulated using the OFDM de- modulator with similar parameters as the OFDM modu- lator, the guard interval is removed. After that the signal is fed into a 4-QAM decoder, and the BER is calculated at the end [12-16].
3. Results and Discussion
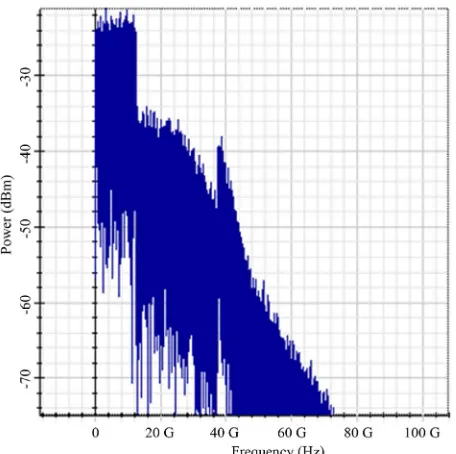
Figure 6 shows the RF spectrum of the signal at the
transmitter side, where the power of the RF is approxi- mately −12 dBm. Figure 7 shows the RF spectrum at the
receiver side after 1800 Km SMF. The power of the RF is decreased to −22 dBm, this decrease in power is because of the increase in fiber length which increases the at- tenuation.
Figure 8 shows the spectrum 20 OFDM signal after the
WDM multiplexer. 20 WDM channels start from 193.05 THz to 194 THz with 50 GHz of channel space.
The constellation visualizer is an important tool to find if the signal is recovered correctly. The constellation dia- gram can determine the interference and distortion that happened to the signal. Figure 9 shows the electrical
constellation diagram of the 4-QAM digital modulator at the transmitter side.
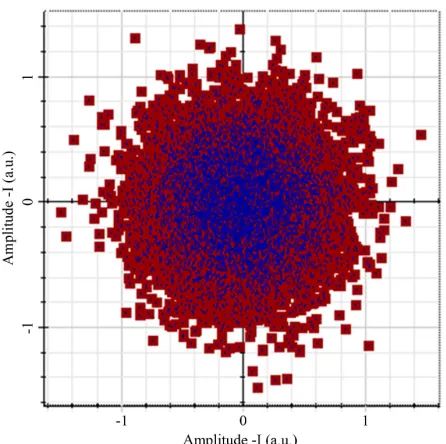
Figure 10 shows the constellation diagram after 1800
SMF and before using the DCF. It is clear that the chro- matic dispersion and the nonlinearity impairments affect the system. So, to improve the signal and remove chro- matic dispersion that occurs because of the increase in transmission distance and the data rate, DCF is used.
Figure 11 shows the constellation diagram of the signal
after using the DCF.
To study the performance of the system for the high data rate, the relationship of the BER and the OSNR with regard to the transmission distance is studied. Figure 12
shows the relationship of the BER and the transmission distance. As can be seen, the BER of short distances is good. However, the BER increases as the transmission distance increases. This happens because of the fiber dispersion which causes the optical pulse to be broadened and produces Intersymbol Interference.
Figure 13 shows the relationship of the BER and the
Figure 6. RF spectrum of the signal at the transmitter side.
[image:4.595.311.538.242.701.2]Figure 7. RF spectrum of the signal at the receiver side.
Figure 8. 20 WDM CO-OFDM channels.
[image:4.595.60.288.485.712.2]Figure 10. Constellation diagram after 1800 Km before using the DCF.
Figure 11. Constellation diagram after 1800 Km after using the DCF.
from the figure, as the transmission distance increases, larger OSNR is required to maintain a BER of less than 10−3. However, increasing the OSNR will increase the
nonlinearity effects in the fiber which will make the sys- tem worse.
4. Conclusion
In this paper, the architecture of Tb/s WDM systems is studied by using Co-OFDM. The simulation was designed by 20 WDM channels spaced at 50 GHz, and 20 OFDM signals, each with 50 Gbits/s bitrate to produce 1 Tbits/s
[image:5.595.311.537.261.380.2]Figure 12. Constellation diagram after 1800 Km after using the DCF.
Figure 13. The relationship of BER and OSNR for different transmission distance.
data rate. The proposed system gives clear results to prove it to be reliable. The results show that as the transmission distance increases, the BER increases. Also, when the transmission distance increases, larger OSNR is needed to maintain a BER in less than 10−3. However, increasing the
OSNR will increase the nonlinear effects on the fiber. In the future study of the system, higher order modulations such as: 16-QAM and 32-QAM, will be used to improve the system performance.
REFERENCES
[1] X. Yi, N. Fontaine, R. Scott and S. Yoo, “Tb/s Coherent Optical OFDM systems Enabled by Optical Frequency Combs,” Journal of Lightwave Technology,Vol. 28, No. 14, 2010, pp. 2054-2061. doi:10.1364/OE.16.000841 [2] W. Shieh, H. Bao and Y. Tang, “Coherent Optical OFDM:
Theory and Design,” Optics Express, Vol. 16, No. 2, 2008, pp. 841-859.
[3] Z. Wang, X. Xie, J. Zhao, Z. Tong and X. Yang, “Per- formance Analysis of Different Modulation Schemes For Coherent Optical OFDM System,” 2010 International Conference on Communications and Mobile Computing (CMC), Shenzhen, 12-14 April 2010, pp. 23-25.
[image:5.595.62.283.339.559.2][8] W. Shieh, X. Yi and Y. Tang, “Transmission Experiment of Multi-Gigabit Coherent Optical OFDM Systems over 1000 km SSMF Fibre,” Electronics Letters, Vol. 43, No. 3, 2007, pp. 183-184. doi:10.1049/el:20073496
[9] Q. Yang, “High-Speed Coherent Optical Orthogonal Fre- quency-Division Multiplexing Design and Implementa- tion,” Ph.D. Dissertation, The University of Melbourne, Melbourne, 2010.
[10]X. Chen, “Theoretical and Experimental Study on High Spectral Efficiency Coherent Optical OFDM Systems,” Ph.D. Dissertation, The University of Melbourne, Mel- bourne, 2012.
Systems,” Journal of Lightwave Technology,Vol. 25, No. 1, 2007, pp. 131-138. doi:10.1109/JLT.2006.888161 [15]Z. Jian and A. Ellis, “Transmission of 4-ASK Optical Fast
OFDM with Chromatic Dispersion Compensation,” Photo- nics Technology Letters, IEEE,Vol. 24, No. 1, 2012, pp. 34-36. doi:10.1109/LPT.2011.2171943