Munich Personal RePEc Archive
Securitization and Bank Intermediation
Function
Zagonov, Maxim
Toulouse Business School, Université de Toulouse
September 2011
Online at
https://mpra.ub.uni-muenchen.de/34961/
Securitisation
and
Bank Intermediation Function
Maxim Zagonov
ySeptember 2011
Abstract
The move from the originate-to-hold to originate-to-distribute model of lend-ing profoundly transformed the functionlend-ing of credit markets and weakened the natural asset transformation function performed by …nancial intermedi-aries for centuries. This shift also compromised the role of banks in channeling monetary policy initiatives, and undermined the importance of traditional asset-liability practices of interest rate risk management. The question is, therefore, whether securitisation is conducive to the optimal hedging of bank interest rate risk. The empirical results reported in this work suggest that banks resorting to securitisation do not, on average, achieve an unambiguous reduction in their exposure to the term structure ‡uctuations. Against this background, banks with very high involvement in the originate-to-distribute market enjoy lower interest rate risk. This however by no means implies su-perior risk management practices in these institutions but is merely a result of disintermediation.
JEL classi…cation: G21; G28; E52; C23
Keywords: Financial institutions; Interest rate risk; Securitisation
The author would like to thank Hippokrates A. Hadjiilias, Aneel Keswani, Ian W. Marsh, David Stolin, Elyas Elyasiani, Santiago Carbó Valverde and Ning Gong for their valuable suggestions that helped to greatly improve this work. Further, the author is greatful to the seminar participants at the annual meetings of the Australasian Banking and Finance 2010, Midwest Finance Association 2011, Southwestern Finance Association 2011 and Financial Management Association 2011. The …ndings and conclusions expressed in the paper are entirely those of the author.
1
Introduction
The recent …nancial crisis prompted by the US subprime mortgage meltdown has demonstrated the detrimental impact a troubled banking sector has on the wider economy both domestically and internationally. The …nancial markets worldwide su¤ered disastrous losses, with massive declines in portfolio values of various, in-cluding highly rated, securities. The crisis also led to a severe liquidity shortfall that adversely a¤ected all economic agents. As credit tightened, the myriad of for-mally prosperous businesses were forced to …le for bankruptcy, resulting in soaring unemployment and unprecedented decline in international trade.
Securitisation is generally regarded as the key culprit in the subprime debacle, thus provoking copious discussions on possible remedies for the market for securi-tised assets. Recently, a plethora of contributions addressed these issues both
em-pirically and analytically1. Together these works suggest that the root causes of the
crisis are by no means exogenous, and reside in managers’ opportunistic behaviour, propensity to short-termism, and concomitant regulatory policies that abetted these trends. Beyond this point of agreement, the issue remains an ongoing debate among academics, practitioners, and policymakers with many of the underlying causes yet to be fully understood.
Interestingly, none of the aforementioned causes is new, and they have all been acknowledged as the primary determinants of the major …nancial crises in the past. Three common causes are particularly emphasised: moral hazard and information asymmetries; global imbalances; and a poorly designed multi-layered regulatory framework which further aggravated an already present misalignment of incentives. However, what makes the current crisis di¤erent is a contagion which was man-ifested due to highly developed inter-linkages between international …nancial cor-porations, their complexity, multi-sector involvement, and a speedy transmission of news and investment ‡ows. What started as a relatively isolated US subprime mortgage episode was then propagated to the rest of the …nancial sector worldwide, a¤ecting all major asset classes. In response, a great deal of research has focused on examining the market mechanism by which the …nancial contagion is prolifer-ated, proposing even more solutions to contain the shock spill-overs in the future (Brunnermeier, 2009; Longsta¤, 2010).
Further contributions have also addressed the role of rating agencies, condemn-ing their inability to properly rate the securitised products (Skreta and Veldkamp, 2009). Agencies’ incentives, and con‡ict of interest are also emphasised (Bolton,
Freixas, and Shapiro, 2011). The design of the compensation structure, with man-agers’ rewards being tied to short-term mark-to-market pro…ts rather than the long-term pro…tability and solvency of created positions, has also been acknowledged for contributing to the crisis (Erkens, Hung, and Matos, 2009). In a similar vein, the regulatory architecture which allowed, and in some instances abetted, such short-termist behaviour has also been denounced (Acharya and Richardson, 2009).
While much has been learnt from these contributions, they have predominantly concentrated on the underlying causes of the current events, not the risks facing the …nancial system in the aftermath of the crisis. For instance, none has explicitly addressed the issue of bank interest rate exposure, the importance of which was reasserted by recent developments in the monetary environment.
Following an unprecedented reduction in the nominal interest rates, today the concern exists that banks have relaxed their asset-liability management practices and
are less protected than ever against rising interest rates2. This concern is re‡ected
in the speech of then Vice Chairman of the Board of Governors of the Federal Reserve System, Donald L. Kohn at the Federal Deposit Insurance Corporation’s Symposium on Interest Rate Risk Management in January 2010. In his speech, Dr. Kohn stressed that "... interest rate risk is inherent in the business of banking..." and "... it is especially important now for institutions to have in place sound practices to measure, monitor, and control this risk". He further cautioned that as the economy recovers, it is reasonable to expect a tightening in monetary policy, with associated developments in the entire shape of the term structure being hard to predict. In this respect, the unprecedentedly high issuance of government debt worldwide, coupled with increasing in‡ationary pressure, may trigger sharp changes in the interest rate environment. As suggested by Dr. Kohn, it is highly unlikely that the interest rate volatilities will "...return to their previous quiescent state", thereby posing further concerns for the stability of the …nancial sector. The shape of the term structure is also likely to undergo signi…cant changes. As the investors return to higher risk leveraged positions, the yields o¤ered on sovereign instruments will have to be revisited in order to successfully …nance the …scal de…cit. Furthermore, due to the crisis-induced liquidity constraints, many institutions were forced to shorten the
maturity of their liabilities and are accordingly exposed to greater re…nancing risk3.
2Over the last two years, the US yield curve has experienced a considerable steepening, with the interest rate spread widening to a multi-decade level high. This steepening poses a signi…cant challenge to the asset-liability managers, particularly in addressing possible non-parallel shifts in the term structure. The empirical evidence on the adverse impacts of low interest rates on bank risk is provided in Altunbas, Gambacorta, and Marqués-Ibáñez (2010).
And while the prudently managed companies will presumably access the required funds, the increased competition for credit may escalate its cost. On the asset side, as many households …nd the value of their debt exceeding the value of the underlying equity, the rate of defaults is likely to peak with interest rates.
Such economic conditions raise the fundamental question of what are the most e¤ective and suitable ways to hedge against unanticipated developments in the yield curve. In this respect, the theoretical bene…ts of securitisation for e¢cient manage-ment of bank interest rate risk are unambiguous. On the one hand, securitisation serves as a channel to transfer interest rate risk from the …nancial intermediary to parties better equipped to bear and manage this exposure. On the other hand, it provides an opportunity to align the duration of interest rate sensitive assets and li-abilities, thereby reducing the balance sheet duration gap and concomitant exposure to interest rate movements. Further, securitisation income o¤ers the potential to improve revenue diversi…cation, thus reducing bank reliance on interest-generating
activities4. Despite these sound theoretical grounds, no empirical account of the
impact of securitisation on bank interest rate risk has hitherto been conducted. Accordingly, the objective of the work reported here is to circumvent the afore-mentioned issues in addressing the impact of securitisation on bank interest rate risk. In particular, the paper o¤ers three major contributions to the literature.
First, utilising an extensive sample of publically traded US bank holding compa-nies, this work empirically veri…es the importance of interest rate exposure for the majority of analysed institutions over the 2001 to 2009 period. Nearly 95 percent of analysed …nancial intermediaries are adversely a¤ected by yield curve shocks at one time or another, with the yield curve slope being the most signi…cant source of risk. The banks resorting to asset securitisation are a¤ected to a higher degree by term-structure movements than their non-securitising counterparts.
Second, this is the …rst study which explicitly relates the level of bank securiti-sation activities to its interest rate exposure. While the empirical evidence to date suggests that securitisation a¤ects the level of bank credit risk, its solvency, and e¢ciency, no empirical test to assert its impact on bank interest rate risk has been conducted. The results reported here o¤er a valuable insight to both managers and
the US thrifts to their total assets was at the level of 40.6%, while the corresponding proportion of all adjustable-rate mortgage loans to total assets was at only 22.3%. The e¤ective duration gap in the thrift industry also remained positive, highlighting the …rms’ susceptibility to rising interest rates.
regulators looking into securitisation to curb bank interest rate risk. This is partic-ularly important in the aftermath of the global …nancial crisis, with the monetary policy decisions creating a unique environment for interest rate exposure.
Third, the current research also studies whether the securitisation of assets with di¤erent maturities and risk characteristics impacts di¤erently on bank interest rate exposure. The empirical tests suggest that interest rate risk generally increases with the maturity of assets securitised. To decouple the e¤ect of securitisation from other factors, I consider further channels that may have a¤ected bank risk. These include numerous bank-speci…c characteristics and the macroeconomic envi-ronment in which banks operate. Further, the research covers both pre-crisis and crisis episodes, thereby o¤ering an opportunity to compare the e¤ectiveness of se-curitisation in curbing bank interest rate risk between the two periods. I …nd that banks resorting to asset securitisation are subject to greater interest rate exposure in the second, crisis sub-period.
The remainder of the paper is organised as follows: Section 2 provides a brief review of the literature and outlines a set of testable hypotheses. Section 3 presents a theoretical model of …nancial intermediary risk-taking behaviour, while Section 4 continues by outlining the supporting empirical framework. The description of the data sample follows in Section 5. Empirical results are discussed in Section 6, while Section 7 concludes the paper.
2
Literature review and hypotheses formulation
Securitisation is a relatively straightforward process of transforming a pool of illiquid assets into marketable securities via cash ‡ow repackaging; yet it has sub-stantially reshaped the credit markets in recent decades. While originally con…ned to the US residential mortgages, today, securitisation is applied to a wide range of asset classes, including credit card, commercial and industrial, automobile, and home equity loans, among others. Since its inception in the late 1960s, the issuance of securitised assets in the US has been growing steadily to amount to nearly US
$2.11 trillion as of the year end 20095.
On the theoretical front, access to the market for securitised products may sub-stantially bene…t the originator by (a) allowing to e¢ciently diversify its credit portfolio; (b) improving asset-liability management; (c) reducing the cost of …nan-cial intermediation; and (d) providing an opportunity to pro…t by spe…nan-cialising in
operations in which it enjoys a comparative advantage6. As suggested by Loutskina
and Strahan (2009), securitisation eases the in‡uence of bank …nancial conditions and local funding shocks on credit supply. As a result, it increases liquidity and facilitates the reduction of funding and therefore banks’ intermediation costs. Fur-ther, securitisation provides a means to e¢ciently transfer the risk from the banks’ balance sheet to other economic players better equipped to bear it, thereby removing the impediment to further growth implied by capital and balance sheet constraints. In terms of bank interest rate risk, securitisation o¤ers an opportunity e¤ectively to tailor the balance sheet duration gap induced by the banks’ asset transformation function. Thanks to heterogeneity in the maturity of assets admissible for secu-ritisation, the duration of rate sensitive assets can be perfectly matched to that of corresponding liabilities. Further, by securitising assets with embedded prepay-ment provisions, the lender, in e¤ect, resells the position held in these options and therefore hedges its exposure to unanticipated increases in interest rate volatility.
Despite the unambiguous theoretical bene…ts o¤ered by securitisation, the em-pirical evidence and the state of market predicament to date suggest that …nancial institutions may have been unable fully to enjoy such advantages. With many …rms moving from an "originate-to-hold" to "originate-to-distribute" business model, the agency problems become ever more apparent and a vast literature analyses this issue in depth (Berndt and Gupta, 2009; Drucker and Puri, 2009). In particular, due to the separation of asset ownership and control functions, the loan originator lacks the incentive to exert enough e¤ort in monitoring the credit quality of any pursued projects. Provided with a channel to alleviate its credit exposure, the intermediary is more concerned with the fees it extracts from the new loan origination rather than the underlying quality of these loans. As demonstrated by Keys et al. (2010), the likelihood of originating sub-quality loans increases with the probability of the loans being sold. Furthermore, the funds released from asset shifts are commonly used to …nance more pro…table, yet riskier avenues (Cebenoyan and Strahan, 2004; Purnanandam, 2011). And while various mechanisms were introduced to minimise moral hazard and to better align the interests of bankers and investors (Gorton and Pennacchi, 1995), ine¢cient contractual environment and misplaced regulatory
and 2009 (source: US Census Bureau, http://www.census.gov).
e¤orts precluded a complete resolution of these problems.
Besides, under poorly designed regulatory capital charges, banks have an incen-tive to securitise safer, low-yield assets while retaining riskier and more pro…table ones. As demonstrated by Ambrose, Lacour-Little and Sanders (2005), intermedi-aries commonly securitise safer mortgages and retain the more risky ones on the balance sheet. An extensive scope of works provides further empirical evidence to support this "regulatory arbitrage hypothesis" for asset securitisation. Many also agree that even with no capital distortion, the banks are likely to shift safer as-sets, owed to excessive costs involved in distribution of riskier instruments due to the "lemons" problem (Akerlof, 1970). Additionally, despite the fact that under the FASB140 rule (Financial Accounting Standards Board) securitisation is clas-si…ed as an asset sale, in practice, this transaction resembles a typical …nancing arrangement with securitisers commonly retaining their credit exposure by provid-ing various credit enhancements and guarantees. For this reason, the o¤-balance sheet treatment of such transactions has been greatly criticised in the literature.
Moreover, with the increased popularity of securitised products, a myriad of non-depository market players entered the lending business directly to compete with tra-ditional intermediaries. This translated into increased market competition, forcing many …nancial institutions to accept higher risks to remain competitive. From this perspective, securitisation is unlikely to be utilised as a risk-transfer mechanism, but is rather motivated by the desire for greater pro…tability.
On the basis of the discussion so far, and following the recent events in global …nancial markets, the possibility of banks utilising securitisation to curb interest rate risk seems rather elusive. This view is re‡ected in the …rst testable hypothesis:
Hypothesis1: Banks resorting to asset securitisation face greater interest rate
ex-posure. The extent of this exposure varies with the duration of assets securitised.
after origination.
In the same vein, many have argued that in the last decade banks have moved from a traditional spread generating strategy to a new equity-maximisation fees-generating strategy. By assertively strengthening its involvement in the "originate-to-distribute" market, many intermediaries, in e¤ect, function as brokers who ex-tract the fees for joining borrowers and lenders. And while the asset repackaging and sale is costly to the originator, the costs associated with joining the complemen-tary transactions between borrowers and securitised-debt investors are considerably reduced through the standardisation of securitised products. Besides, the company achieves economies of scale by specialising in structured …nance transactions. It also enjoys increasing returns to scale in evaluating the borrowers’ credit quality due to lax monitoring. Furthermore, the active players in the securitisation market enjoy better access to derivative instruments which, as demonstrated by Purnanandam (2007), enable these companies to preserve the extent of loan origination even as monetary conditions tighten.
With this business model, the importance of interest generating revenues declines, and so does the e¤ective duration of assets held on the balance sheet. Accordingly, the duration gap remains at minimal levels, and the intermediary is less exposed to the risk of changing interest rates. On the basis of this argument, the following hypothesis is added into the analysis:
Hypothesis2: The relationship between bank interest rate risk and asset
securitisa-tion is non-linear. The risk initially increases with the value of assets securitised, but declines with bank "disintermediation".
3
Theoretical background
formalise the practical applications of the proposed theory can be traced to the work of Redington (1952) who introduces the so-called "immunisation rule". Under this simpli…ed rule, the agent chooses to always hedge against interest rate shocks by matching the durations of rate sensitive assets and liabilities.
Second, when the rates earned on the underlying assets are not perfectly corre-lated with the rates paid on the liabilities, the bank’s earnings are exposed to interest rate ‡uctuation. This is referred to as the interest rate margin risk. Following the Federal Reserve’s decision to reduce the interest rates to unprecedentedly low levels, the bankers have enjoyed a substantial increase in the interest rate margins. These conditions may substantially change as the monetary policy tightens, with many banks …nding it di¢cult to re…nance some of their …xed rate assets with variable rate liabilities. Finally, the third source of interest rate risk arises from optionality embedded in some assets and liabilities (e.g. prepayment options). This asymmetric source of interest rate risk gained its prominence in recent decades.
To theoretically formalise the aforementioned sources of interest rate risk, and to see how securitisation may be used in curtailing these exposures, this section presents the model of bank intermediation and describes its key attributes. For sim-plicity, the model concentrates on the banks’ duration transformation function and discounts any other claim attributes and risks. Formally, I assume that the interests of shareholders and managers are aligned in their combined utility maximisation
(A.1). Accordingly, the bank pursues the strategy of maximising its after-tax
prof-its. The credit market is perfectly competitive à la Besanko and Thakor (1987), with the credit contracts designed to maximise the expected utility of borrowers.
At each planning date t the manager can choose the amount to be invested in
assets and liabilities of di¤erent maturities, conditional on her choices in
preced-ing periods. The maturity of available projects is limited by T, which represents
the manager’s investment horizon. Some divergences from the target asset mix are inevitable in the short-run, though the bank’s choice of principal specialisa-tion determines the market condispecialisa-tion it faces and its ability to promptly adjust the composition of the asset portfolio. Bank liabilities are subject to similar con-straints, with relatively stable, manager controlled federal funds, though volatile deposit base. The latter contracts represent a relatively stable funding source in the
presence of a deposit insurance guarantee. Assuming further that t is continuously
de…ned on the closed interval[0; T], the bank’s asset and liability streams over the
investment horizon areA(t) and L(t)respectively. The interest rates are stochastic
and independent of the banks’ choice of balance sheet structure, with the function
interme-diary can nonetheless negotiate favourable rate conditions on its assets and liability contracts (e.g., spreads over index rates such as LIBOR) owing to its market power.
The BHC’s equity value Q is therefore simply the di¤erence between the present
values of its asset and liability streams:
Q= Z T
0
A(t)e R(t)tdt Z T
0
L(t)e R(t)tdt=A L (1)
where the present values of asset and liability streams are denoted by A and L
respectively.
In a similar manner, the BHC’s net income8t >0 is de…ned as:
I =Ra(t)A(t) Rl(t)L(t) (2)
whereRa(t)andRl(t)are interest rates charged on assets and liabilities respectively.
For convenience, the regulatory capital charges, as well as the operational costs of servicing the asset and liability portfolios are assumed away in this speci…cation.
Accordingly, following Assumption 1 (A.1) above, the bank shareholders are
concerned with maximising the value of bank pro…ts:
(t) = Ra(t)A(t) Rl(t)L(t) +4Q (3)
Note that the equity valueQis una¤ected if the yield curve remains unchanged over
the period; and the bank pro…ts are driven by the net interest margin.
As, however, the term structure evolves, both the bank interest margin and its equity value would be a¤ected in a number of ways. The exact nature of such response is convoluted due to the direction of rate movements, the occurrence of non-parallel shifts in the term structure, and the relationships between the bank assets and liabilities rates. These considerations unnecessary complicate the model, and a number of simplifying assumptions are introduced as follows:
A.2The shifts in the interest rate yield curve are parallel in nature: given a
contin-uous random variableqwith a probability density function f(q) 0and a q b,
the future yield curve can be described byR(t) +q, 8t2[0; T].
Accordingly, assumingR(t) =Rin (3), the bank interest income remains una¤ected
as long as the adjustment speed of the rates charged on assets and the rates paid on liabilities is the same:
@Ra(t)
@R =
@Rl(t)
Under this condition, the pro…ts are determined by the term-structure driven changes
in the market values of the intermediary’s assets (A) and liabilities (L):
@ @R = @Q @R = Z T 0
A(t)e R(t)tdt RT
0 tA(t)e
R(t)tdt RT
0 A(t)e R(t)tdt
+
+ Z T
0
L(t)e R(t)tdt RT
0 tL(t)e
R(t)tdt RT
0 L(t)e R(t)tdt
(5)
It is easy to see that
RT
0 tA(t)e
R(t)tdt RT
0 A(t)e R(t)tdt
and
RT
0 tL(t)e
R(t)tdt RT
0 L(t)e R(t)tdt
are the weighted average time to maturity, or durations, of assets and liability
streams respectively. Denoting the duration of assets with M DA and the duration
of liabilities withM DL, we get:
@ @R =
@Q
@R =L M DL A M DA (6)
It therefore follows that the manager’s decision problem is to choose theM DL and
M DAthat maximise the value of bank equityQ. Assuming, however, the stochastic
nature of the interest rate movements [E(q)= Rabqf(q)dq], adjusting the durations
is barely an improvement over the immunisation strategy.
Since banks commonly assume a positive asset-liability duration mismatch, to reduce the sensitivity of a company’s value to interest rate ‡uctuation, the risk
manager must either reduce the duration of assets M DA or increase the duration
of liabilities M DL. In this respect, securitisation o¤ers an elegant solution to the
4
Methodological framework
4.1 Yield curve modelling
The standard research methodology of assessing the interest rate exposure pro-poses to use a single interest rate factor (Stone, 1974). Therefore, it fails to recognise the time-varying nature of the yield curve shape.
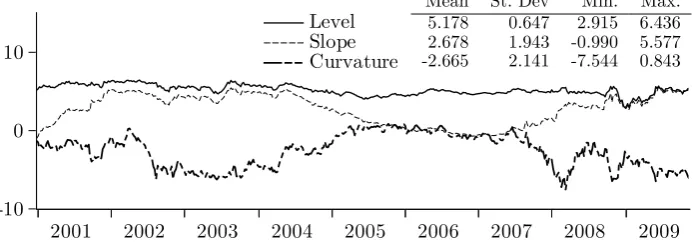
In this study, I account for the sensitivity of BHCs’ stock returns to the changes in the entire shape of the term structure by employing simultaneously the level, slope and curvature of the interest rate yield curve. These measures are calculated via the Diebold and Lee (2006) factorisation of the Nelson and Siegel (1987) model:
yt( ) = 1;t+ 2;t
1 e
+ 1;t
1 e
e (7)
where represents the maturity of the underlying …xed-income security and is a
decay parameter discussed below.
The Nelson-Siegel model uses just a few parameters (compared for example to spline methods) and provides enough ‡exibility to capture a range of monotonic,
S-type and humped shapes typically observed in the yield curve data. It …ts the
term structure using a ‡exible, smooth parametric function based on a Laguerre function. Notably, due to its ability to provide a good …t of the interest rate yield curves the model is advocated by Diebold and Lee (2006), and Czaja, Scholz and Wilkens (2010), and is widely used by central banks and practitioners. The central banks in nine out of thirteen countries members of the Basel Committee of Banking Supervision construct a sovereign zero-coupon yield curve using the Nelson-Siegel class of models.
To estimate the yield curve level, slope and curvature, the series of the sovereign zero-coupon yields of 12 di¤erent maturities ( = 3, 6 and 12 months, and 2, 3, . . . , 10 years) are sourced from the U.S. Federal Reserve Board statistical releases. These series are used as the initial estimates on the left hand side.
Based on the model parameterisation above, the loading on the level ( 1;t)
pa-rameter is 1 and is independent of time-to-maturity. Taking the limit, it is easy
to see that lim !1yt( ) = 1;t and hence the yield curve level can be seen as a
long-term interest rate variable. It also worth noting that an increase in 1;t would
identically a¤ect all yields, thereby shifting the level of yield curve. Similarly, the
loading on the slope parameter 2;tis driven by the exponential function starting at1
parameter would amplify the short-rates more than the long ones. In mathematical
terms, given lim !0yt( ) = 1;t+ 2;t, it is easy to see that yt(1) yt(0) = 2;t.
The loading on the last parameter 3;t (curvature) is also driven by the exponential
function, now starting at zero (with the = 0), increasing for the medium
maturi-ties and decaying back to zero as maturity increases. Accordingly, the yield curve
curvature ( 3;t) can be seen as the medium term interest rate variable.
Following Diebold and Lee (2006), and Czaja, Scholz and Wilkens (2010), to obtain the estimates of the level, slope and curvature, the identi…ed series of zero-coupon yields are regressed on the factor loadings and a constant using the cross-sectional ordinary least squares technique. With this model factorisation the para-meters on the right hand side are calculated assuming the pre…xed value of decay parameter . Consistent with Diebold and Lee, the value of the decay parameter is …xed and is chosen to maximise the loading on the curvature parameter. For
com-parison, the time-varying decay parameter is also employed. In this speci…cation
is chosen to maximise the goodness-of-…t statistics of the underlying model at each
timet. Both speci…cations yield statistically identical results. To avoid introducing
an additional time-varying component in the yield-curve model, I resort to the …xed speci…cation.
Figure 1 plots the estimated level, slope and curvature factors, with the pertinent statistics outlined in the corresponding table.
Compared to the yield curve slope and curvature, the level factor is less volatile. This observation is not surprising since the yield curve level serves as a proxy for the long-term interest rate, with the yields at the long end of the term structure being generally less volatile.
4.2 Interest rate exposure
To address the underlying empirical hypotheses, I follow a two-stage estimation procedure in line with previous literature in the area. In the …rst step, the interest
rate exposure of BHCs’ stock returns is modelled via a four-factor GARCH(n; m)
parameterisation7 of the market model formalised as:
Rit = +X0
it +"it (8)
hit = !0+
n X
i=1
1"2i;t 1+
m X
i=1
2hi;t 1 (9)
"itj t 1 N(0; hit) (10)
whereRit represent the weekly logarithmic returns8 on BHC i(i= 1to304) for the
…rm’s …scal year t; is a scalar, is a K 1 vector of coe¢cients and Xit is the
it-th observation onK explanatory variables: X0= (RM; RLevel; RSlope; RCurvature).
RM is return on the S&P500 market index. RLevel; RSlope; and RCurvature represent
unanticipated changes in the level, slope, and curvature of the domestic sovereign
zero-coupon yield curve at timet respectively. The use of unanticipated changes is
advocated by previous research suggesting that asset values should already incor-porate all the anticipated changes in interest rates. I estimate these unanticipated changes as the di¤erence between the actual changes in the respective factor at time
t and ones forecasted via the appropriate speci…cation of the ARMA (k; l) model9.
"it is the estimated error term from the mean equation of portfolio i, and hit is a
conditional variance of portfolioi over weekt. The order of lags (n; m) ensures the
adequate treatment of serial correlation in squared returns, with the formal Engle
ARCH Lagrange multiplier and Ljung-Box Q-statistics determining the correct lag
structure.
The estimated coe¢cients measure the sensitivity of bank i’s stock returns to
changes in the considered interest rate factor. They are treated as independent variables in the empirical framework to follow.
4.3 Securitization and interest rate risk
In the second step, the estimated measures of interest rate risk are related to proxies of bank securitisation and asset sales activities. I use panel data techniques to fully exploit the potential of the data sample, and to control for unobserved
cross-8To avoid the bias introduced by the Monday or Friday market e¤ects (French, 1980; Pettengill, Wingender and Kohli, 2003), the calculation of returns is based on the Wednesday to Wednesday stock prices. The choice of the weekly sampling interval instead of daily or monthly is determined by two reasons. First, the …ndings of Trzcinka (1986) indicate that the returns calculated at a daily frequency are not well explained by the normal distribution. By using, however, monthly sampling frequency the non-normality of daily observation would be avoided just at the expense of information loss. Second, the use of weekly intervals reduces distortions due to non-trading holidays and noise trading.
sectional and time heterogeneity. The workhorse model speci…cation accounts for both company speci…c …nancial characteristics and the overall economic and business conditions in which these …rms operate:
k
it ='+SEC
0
i;t 1 +Y
0
i;t 1 +G
0
t 1 +T
0
t + i+"it (11)
where, kit represents the interest rate risk measure k in year t for bank i. As
discussed above, these measures represent the BHCs’ equity return sensitivity to
unanticipated changes in the yield curve level, slope, and curvature. is an S 1
vector of coe¢cients andSECit is the it-th observation on S securitisation proxies.
Similarly, is an M 1 and Yit is the it-th observation on M company speci…c
…nancial characteristics; while is an L 1 and Gt is the t-th observation on L
macroeconomic characteristics. Tt is a vector of year - dummies of dimensionT 1,
and the company speci…c e¤ect is measured by i. The model is estimated by either
treating i as …xed (…xed e¤ect model), thus assuming (N + M + L) unknown
coe¢cients, with = ( 1; : : : ; N)0 being company speci…c intercepts; or random
(random e¤ect model). In the random e¤ect speci…cation i IID(0; 2) and
is independent of "i IID(0; 2
"). Further, both i and the disturbance term "i
are independent of (SECit; Yit; Gt) for all i and t. For both model speci…cations
the robust standard errors adjusted for serial correlation and heteroskedasticity are calculated.
In line with Keswani, Marsh, and Zagonov (2011) and Au Yong, Fa¤ and Chalmers (2009), the absolute values of interest rate betas are used as the dependent variable in the second step regressions. This aids an economic interpretation of the estimated results and can be reconciled with the notion that both positive and negative expo-sures to yield curve shocks represent the risk to bank economic value and should be treated accordingly. Further, to facilitate the validation of the proposed hypotheses, various parameterisations of the baseline model are introduced through empirical investigation.
5
Sample selection
requisite dataset is accordingly constructed by merging the income statement and balance sheet data from the Consolidated Financial Statement for Bank Holding Companies (FR Y-9C form) with the equity market data from CRSP on the basis of company name and its geographical location. The equity returns are of weekly frequency, all adjusted for dividend reinvestment and stock splits by CRSP. I further check for the dataset consistency with Compustat using the CUSIP identi…er.
The focus on BHCs instead of their commercial bank subsidiaries is determined by two factors. First, the share price data is commonly available for only the BHC and not individual banks. Second, the decisions concerning the company’s capital and risk management strategies are ordinarily undertaken at the highest level, and are not necessarily directed at a single subsidiary.
The banks with missing data on securitisation and asset sales activities, deriv-ative transactions, total loans and assets, and equity capital are excluded from the sample. The same applies for the acquired entities. Every e¤ort is taken to detect and address any outliers arising as a result of measurement or reporting errors in the underlying datasets. Other non-technical representative outliers, depicting genuine variability in the considered variables, are dealt with accordingly as per the discus-sion to follow. This yields a total of 304 bank holding companies with the required information being continuously available across the entire sample period. The list of analysed banks is in Appendix A, while the considered variables alongside their detailed de…nitions can be found in Appendix B. For each BHC, the annual aggre-gates of the underlying data are used. The average value of total assets for these institutions ranges between $16,524 million in 2001 and $35,682 million in 2009, with the median for two years being $1,017 billion and $2,023 billion respectively.
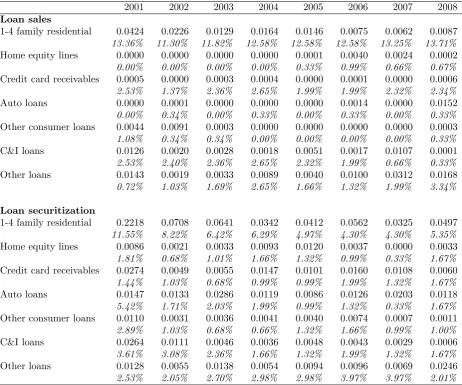
Bank attributes related to securitisation and loan sales activities are from Sched-ule HC-S of FR Y-9C …lings. For each BHC, I measure the aggregate value of assets, by category, securitised and sold, or sold but not securitised, within a given …scal year. Additionally, the value of the outstanding principle balance of assets securi-tised or sold for each bank-year is also considered. The pertinent statistics on these measures, by year, are reported in Table 1, with a detailed de…nition for each vari-able availvari-able in Appendix B. Evidently, the loans secured by 1-4 family residential real estate dominate securitisations and loan sales. This is followed by commercial and industrial, and credit cards receivable loans.
[Insert Table 1 here]
5.1 Bank speci…c control variables
There are six …rm level controls, all constructed using FR Y-9C …lings. First, given the evidence of signi…cant U-shaped relationships between bank capital and interest rate risk (Keswani, Marsh, and Zagonov, 2011), the ratio of equity capital to BHC’s total assets (CAP) is deployed. It should be noted that by facilitating the diminution in regulatory capital requirements, securitisation may render the capital ratios an unreliable approximation of the true bank capital constraints. This, however, should not signi…cantly alter the importance of this factor in explaining the banks’ interest rate sensitivity because the equity capital itself represents not-interest rate sensitive liability. Accordingly, …rms with higher capital levels are expected to be less sensitive to interest rate shocks.
Second, following the rationale outlined in previous works, the measure of bank liquidity (LATA) is also considered. In line with empirical literature, a positive relationship between banks’ liquidity and risk is expected. Care should be taken in interpreting this variable, since securitisation may a¤ect the short-term fund in-‡ows and hence in‡ate the bank liquidity ratios. Third, the ratio of non-performing
loans10 (NPL) is used to measure the quality of the bank asset portfolio. Fourth,
based on the theoretical underpinning outlined in the previous section and in line with Flannery and James (1984), the measure of balance sheet asset-liability mis-match (GAP) is calculated as the di¤erence between interest-earning assets and interest-bearing liabilities maturing or being repriced within one year, scaled by the bank’s total assets. As per the outlined theory, a positive sign on this variable is expected. Fifth, since the originator commonly retains an equity-like interest in the transaction, thus maintaining its exposure to credit and prepayment risks, the bank purchase of credit protection (e.g. credit default swaps) can be seen as an attempt to hedge this exposure. To this end, I calculate the bank’s net credit protection purchase (NECP) as the di¤erence between the credit protection it buys and sells in a given …scal year.
Finally, to control for the e¤ect of bank activity diversi…cation, a set of asset and revenue diversi…cation measures is constructed. In line with Laeven and Levine (2007), the diversi…cation of net operating revenue (ROID) is proxied via a modi…ed speci…cation of a Her…ndahl-Hirschman Index (HHI) as follows:
ROID= 1 Interest income - Non-interest income
Total operating income (12)
This measure assumes values between 0 and 1, with a higher value suggesting greater degree of income diversi…cation.
In addition, the income concentration in both interest and non-interest revenue streams is also captured via a Her…ndahl-Hirschman Index. In particular, I consider a broad eight part breakdown for non-interest revenues (H_NOIR), and a twelve part breakdown for the interest income (H_NITR). In a similar manner, the loan concentration HHI (H_LOAN) is computed considering …ve major categories of loans. These include agricultural, commercial and industrial, consumer, real estate, and other loans. More information on the construction of all variables is given in Appendix B.
To improve the …t of the empirical model, I control for further bank character-istics that may explain the variation in the risk exposures. Namely, the return on assets (ROA) is utilised to proxy the bank operational performance and e¢ciency, while the return on equity (ROE) is discounted in the analysis due to its decep-tiveness for …rms with highly leveraged balance sheet. It may also be argued that the level of bank securitisation, as well as its risk exposure, is determined by the growth rate of its assets base. Accordingly, the asset growth rate (AGR) is added to account for this supposition. Finally, as securitisation alters the value of banks’ on-balance sheet assets, the size indicator becomes less relevant (DeYoung and Rice, 2004) and it is omitted from the analysis.
To this end, Panel A of Table 2 provides key comparative statistics for the outlined measures between securitisers and non-securitisers, while Table 3 presents pairwise correlations for these variables.
[Insert Tables 2 and 3 here]
5.2 Economic environment
In the second group of controls, the overall economic and business conditions are captured by the annual growth rate in the gross domestic product (GDPG), and the Aruoba-Diebold-Scotti Business Conditions Index (ADSI) sourced from the Federal Reserve Bank of Philadelphia database (Aruoba, Diebold, and Scotti, 2009), respectively. The latter measure accounts for the real economic activity at high frequency, on the basis of both high- and low-frequency information on six major economic indicators (i.e. weekly initial jobless claims, monthly payroll employment, industrial production, personal income less transfer payments, manufacturing and trade sales, and quarterly real GDP). This index has an average value of zero, with progressively greater values indicating better than average business conditions and vice versa. The descriptive statistics for both …gures are outlined in Table 2: Panel B.
To get more stable estimates in the empirical model, all considered explanatory
variables ( = Y; G) are treated for outliers via type I winsorization11, with …xed
cut-o¤ points of 4^. Alternatively, the variables are winsorised at the 1 and 99
percentiles, with the results being robust to the variable winsorisation..
6
Empirical Results
The discussion begins with the results obtained in the …rst stage estimation in Section 6.1. The multivariate regression analysis is discussed in section 6.2.
6.1 Bank interest rate sensitivities
The interest rate exposure of the analysed BHCs is assessed via a four-factor
GARCH (n; m) model formalised in Eq. (8). This model is estimated for each bank-year, with Table 4 presenting comparative statistics of estimated interest rate factors for securitisers and their non-securitising peers.
[Insert Table 4 here]
At least 10% of the examined BHCs are signi…cantly a¤ected by the adverse movements in di¤erent components of the interest rate yield curve, thereby indi-cating the inability of risk managers to timely adopt adequate hedging strategies. Notably, while the e¤ect of interest rate shocks on the values of both securitisers
and non-securitisers is similar in its magnitude, the proportion of securitisers signif-icantly a¤ected by these shocks is appreciably higher. This, in a way, supports the …rst empirical hypothesis which argues that securitisation is unlikely to be employed as a risk-transfer mechanism.
The majority of the signi…cant interest rate factors are negative, suggesting that BHCs maintain a positive duration mismatch between their interest sensitive assets and liabilities.
6.2 Securitization and interest rate risk
For the main research hypotheses, the panel model in Eq. (11) is …rst estimated with time- and state-…xed e¤ects applied to the entire sample of BHCs. The sensi-tivities of equity values to unanticipated changes in the yield curve level, slope, and curvature estimated from Eq. (8) are interchangeably used as the endogenous vari-able in this model. The explanatory varivari-ables that control for the company …nancial characteristics, and the country economic conditions, are as discussed in previous section. All right-hand side measures are lagged to avoid simultaneity bias. When the economic environment proxies are added into the model, the time-…xed e¤ect is relaxed.
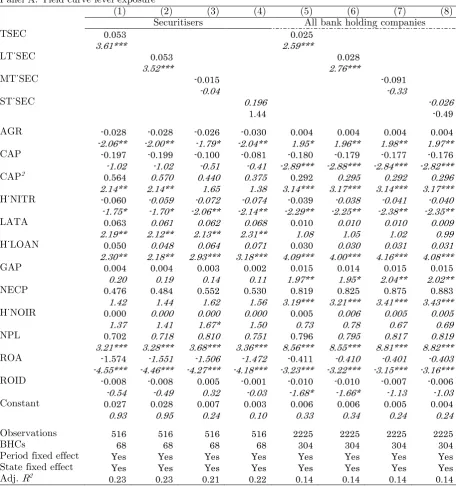
Considering …rst the intermediaries’ exposure to changes in the long end of the yield curve, Table 5: Panel A outlines the empirical results for Hypothesis 1. The proxy for bank securitisation activities (TSEC) enters the table positively and signif-icantly at the one percent level. This implies that BHCs with a greater outstanding value of securitised assets tend to increase interest rate exposure, with this evidence providing additional support for the proposed hypothesis. This is also consistent with the view that securitisation is unlikely to serve as a risk-transfer mechanism, and is instead motivated by the desire for greater pro…tability.
[Insert Table 5 here]
It appears that increases in interest rate exposure are mainly driven by securi-tisation of long-term assets, which are mainly represented by residential mortgages. This is not surprising given that these type of loans dominate securitisations and asset sales, and the funds released from these transactions are likely to be reutilised to extend the loans of similar long-term maturity, yet lower quality. This is in line with the "regulatory arbitrage hypothesis", which suggests that banks commonly securitise safer, low-yield, assets and retain more pro…table, though riskier, ones on the balance sheet. This also is consistent with the empirical …ndings of Ambrose, Lacour-Little and Sanders (2005), and is further supported by the observation of higher proportion of non-performing loans and the asset-liability maturity gap mea-sure for securitising …rms. Besides, the distribution of riskier, opaque, assets would incur a heavy discount due to the "lemons" problem suggested by Akerlof (1970), and would introduce an impediment to the bank’s external funding channel once the market participants learn about the underlying quality of securitised products.
Accordingly, the retained mortgages are subjected to greater interest rate risk, with their credit quality likely to further deteriorate as the interest rate shocks are passed on to customers (Drehmann, Sorensen and Stringa, 2010).
Against this background, it can be argued that banks with high involvement in the originate-to-distribute market function more as brokers, who generate fees by matching the complementary transactions between borrowers and securitised-debt investors, than …nancial intermediaries. Under this "disintermediation" business model, the bank shifts the majority of originated loans, and, therefore, has a com-parative advantage in selecting the projects most suitable for securitisation. Further, given that loans exit the balance sheet soon after origination, the e¤ective duration of assets and liabilities held on the balance sheet is short-term and can be closely matched. Given this background, the active players in securitisation markets are expected to be less exposed to the risk of changing interest rates, with this view being re‡ected in the second research hypothesis.
To test this supposition empirically, I reformulate the model in Eq. (11) in a non-linear form as follows:
k
it ='+ 1T SECi;t 1+ 2T SECi;t2 1+Y
0
i;t 1 +G
0
t 1 +T
0
t + i +"it (13)
where, kit represents the stock return sensitivity of bankito unanticipated changes
in the yield curve level, slope, and curvature at year t. T SECit is the it-th
obser-vation on the company securitisation proxy, and Yit is the it-th observation on M
company speci…c …nancial characteristics. Tt and i are vectors of year- and
Given the model parameterisation, I predict a negative sign on the coe¢cient
estimate for the squared securitisation proxy (T SEC2), and a positive sign onT SEC
variable: 1 >0 and 2 <0.
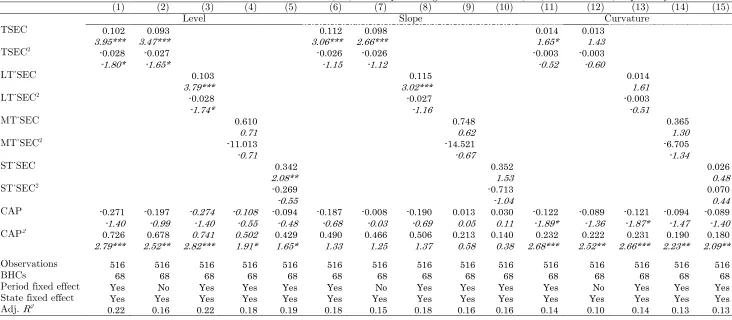
[Insert Table 6 here]
The estimation results in Table 6 support the hypothesised relationship, implying that interest rate risk initially increases with the value of assets securitised, but declines with bank "disintermediation". Once again, the results are driven by the securitisation of long-term assets, with non-linearity being only con…rmed for the long-term interest rates represented by the yield curve level.
In a similar manner, the remaining interest rate factors (yield curve slope and curvature) are evaluated in Table 5: Panels B and C. For all three measures of interest rate risk the results are consistent with the theoretical prediction that banks do not necessarily resort to securitisation to curb their risk exposure. As discussed above the parameter estimate for the securitisation proxy (TSEC) enters all Tables
signi…cantly positive. In this respect, the magnitudes of @IRR/@TSEC suggest a
great economic signi…cance. Thus, a one percent increase in the proportion of total
assets securitised translates into about 0:053 percent increase in BHCs’ exposure
to shocks in the yield curve level. This, in turn, would imply that a typical US
securitiser will incur an additional$1:79million decline in its market value following
a typical shock in the yield curve level. The corresponding values for interest rate
slope and curvature are$4:01 million and$1:17million respectively.
Turning to the remaining bank characteristics in Eq. (11), the majority of co-e¢cients estimates are statistically signi…cant and bear the expected sign. Con-sistent with prior empirical research, the relationship between equity capital and bank risk taking is U-shaped. That is, both undercapitalised and well capitalised intermediaries are generally riskier than banks with intermediate, optimal capital levels. Further, the institutions with higher degree of revenue heterogeneity also enjoy lower risk exposures, and so are the companies with higher asset base growth rate. Not surprisingly, the coe¢cient on the ratio of non-performing loans enters the table negative, owed to the intrinsic link between credit and interest rate risks (Drehmann, Sorensen and Stringa, 2010).
6.3 Robustness checks
and subsamples; the assumption of alternative model speci…cation and distributional properties; and an extensive treatment of endogeneity and simultaneity biases.
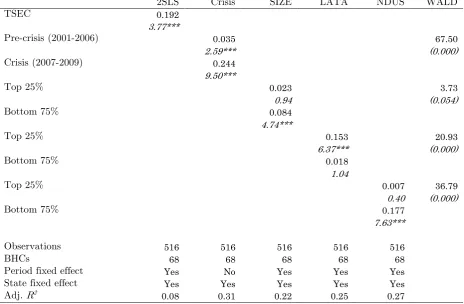
In the context of this study, endogeneity may arise when the BHC’s decision to participate in the market for securitised products does not only in‡uence, but is in‡uenced by its interest rate exposure. In this scenario, the exogenous treatment of securitisation activities would introduce simultaneity bias in the regression esti-mates. Furthermore, additional factors may jointly in‡uence the variability in both measures, biasing the ordinary least squares estimation and making it di¢cult to infer causal relationship. To address these concerns, I detect potential endogeneity via a Hausman test and resort to a two-stage least squares (2SLS) panel estimation procedure by introducing a set of instruments for the BHCs’ securitisation activi-ties as appropriate. To identify suitable instruments, I address the bank’s decision to securitise by analysing its …nancial characteristics in the probit framework (not reported). The results remain robust to the choice of estimation technique. Col-umn 1 of Table 7 details the empirical output for the 2SLS regression assuming the BHCs’ exposure to the shocks in the yield curve level as an endogenous variable. Al-though not reported, the results for the remaining interest rate proxies also remain statistically unchanged.
[Insert Table 7 here]
Furthermore, caution should also be taken in isolating the risk management mo-tives of asset securitisation from auxiliary inducements. In particular, the incentive to securitise may be circumscribed by the level of loan demand and current economic conditions. Faced with unusually high demand for loans, banks would resort to asset sales to extract higher loan origination rents, and to satisfy the existing customer demand for funds. On the other hand, weaker loan demand conditions following the economic downturn make it di¢cult for an intermediary to successfully perform the securitisation transaction. This is due to low liquidity and demand for ABS, and higher credit risk of the underlying asset mix resulting in market mispricing. Such economic conditions would also a¤ect the level of bank interest rate exposure.
In this respect, the analysed sample period provides a unique opportunity to explicitly test this supposition by separating the time horizon into pre-crisis and crisis episodes. This also provides a comparison of the e¤ectiveness of securitisation in curbing interest rate risk between the two periods. In addition, the sample of companies is separated into a number of sub-samples on the basis of ranking by the bank’s (1) size, (2) liquidity, and (3) net derivative usage (hedging - trading).
Selected are the top 25% and the bottom 75% of values in each category, with a
The pertinent results for these tests are also reported in Table 7. The coe¢-cient estimates on the bank securitisation proxy remain robust to the considered time horizon, thus recon…rming the …ndings in the previous section. Not surpris-ingly, it appears that BHCs are subjected to greater risk exposure in the second crisis-episode. Turning to the measure of bank size, the estimate on the securi-tisation proxy remains signi…cant only for the smaller companies. This might be explained by the fact that larger BHCs are better equipped to weather the yield curve shocks owed to better diversi…ed portfolios and unrestricted access to the markets for derivative products. On the other hand, these …rms might also pursue the "disintermediation" business model, therefore reducing the balance sheet du-ration gap and concomitant exposure to interest rate movements. Once the bank liquidity and derivative activities are considered the estimation suggests that the risk exposure is greater for the companies retaining higher liquidity bu¤ers and for BHCs which are the net traders of derivative instruments. The intermediary is clas-si…ed as the net-trader if the notional amount of all derivative instruments held for trading exceeds that of instruments held for hedging.
7
Concluding remarks
The recent turmoil in global …nancial markets, prompted by the US subprime mortgage meltdown, has once again accentuated the importance of banking sector prudency for overall economic stability worldwide. Securitisation is consensually regarded as the key culprit in the subprime debacle, with a plethora of works ad-dressing possible remedies for the market for securitised assets. These contributions, however, are largely concerned with the underlying causes of the current events, not the risks facing the …nancial system in the aftermath of the crisis. None has explic-itly addressed the issue of bank interest rate risk, the importance of which becomes increasingly apparent in the current monetary environment. This concern has been recently ‡agged by regulatory authorities both in the US and in Europe, with super-visors emphasising the necessity of establishing robust practices to measure, monitor, and control bank interest rate exposures.
optimal hedging of bank interest rate risk, or is merely a funding source enabling these companies to pursue more pro…table, yet riskier, projects
The empirical results reported in this work suggest that banks resorting to asset securitisation do not, on average, achieve an unambiguous reduction in their expo-sure to the term structure developments. It appears that interest rate risk generally increases with the maturity of assets securitised, with securitisation of long-term assets driving the results.
References
[1] Acharya,V.V., Richardson, M., 2009. Restoring …nancial stability: How to re-pair a failed system. Wiley.
[2] Akerlof, G.A., 1970. The market for “lemons”: Quality uncertainty and the market mechanism. Quarterly Journal of Economics 84, 488-500.
[3] Altunbas, Y., Gambacorta, L., Marqués-Ibáñez, D., 2010. Does monetary policy a¤ect bank risk-taking? European Central Bank, Working paper series No 1166.
[4] Ambrose, B. W., Lacour-Little, M., Sanders, A.B., 2005. Does regulatory capi-tal arbitrage, reputation, or asymmetric information drive securitization? Jour-nal of Financial Services Research 28, 113-133.
[5] Aruoba, S.B., Diebold, F.X., Scotti, C., 2009. Real-time measurement of busi-ness conditions. Journal of Busibusi-ness and Economic Statistics 27, 417-427.
[6] Au Yong, H.H., Fa¤, R., Chalmers, K., 2009. Derivative activities and Asia-Paci…c banks’ interest rate and exchange rate exposures. Journal of Interna-tional Financial Markets, Institutions and Money 19, 16-32.
[7] Berndt, A., Gupta, A., 2009. Moral hazard and adverse selection in the originate-to-distribute model of bank credit. Journal of Monetary Economics 56, 725-743.
[8] Besanko, D., Thakor, A.V., 1987. Competitive equilibrium in the credit market under asymmetric information. Journal of Economic Theory 42, 167-182.
[9] Bolton, P. Freixas, X., Shapiro, J., 2011. The credit ratings game. Journal of Finance, forthcoming.
[10] Brunnermeier, M.K., 2009. Deciphering the liquidity and credit crunch 2007-2008. Journal of Economic Perspectives 23, 77–100.
[11] Cebenoyan, S.A., Strahan, P.E., 2004. Risk management, capital structure and lending at banks. Journal of Banking and Finance 28, 19-43.
[12] Chiorazzo, V., Milani, C., Salvini, F., 2008. Income diversi…cation and bank performance: Evidence from Italian banks. Journal of Financial Services Re-search 33, 181-203.
[13] Czaja, M., Scholz, H., Wilkens, M., 2010. Interest rate risk rewards in stock returns of …nancial corporations: evidence from Germany. European Financial Management 16, 124-154.
[15] DeYoung, R., Rice, T., 2004. How do banks make money? The fallacies of fee income. Economic Perspectives, Federal Reserve Bank of Chicago fourth quarter, 34-51.
[16] Diebold, F.X., Lee, C., 2006. Forecasting the term structure of government bond yields. Journal of Econometrics 130, 337-264.
[17] Drehmann, M., Sorensen, S., Stringa, M., 2010. The integrated impact of credit and interest rate risk on banks: A dynamic framework and stress testing appli-cation. Journal of Banking and Finance 34, 713-729.
[18] Drucker, S., Puri, M., 2009. On loan sales, loan contracting and lending rela-tionships. Review of Financial Studies 22, 2835-2872.
[19] Elyasiani, E., Mansur, I., 1998. Sensitivity of the bank stock returns distribution to changes in the level and volatility of interest rate: a GARCH-M model. Journal of Banking and Finance 22, 535-563.
[20] Erkens, D., Hung, M., Matos, P., 2009. Corporate governance in the recent …nancial crisis: evidence from …nancial institutions worldwide. University of Southern California, Marshall School of Business, Working paper series.
[21] Flannery, M.J., James, C.M., 1984. Market evidence on the e¤ective maturity of bank assets and liabilities. Journal of Money, Credit and Banking 16, 435-445.
[22] Flannery, M.J., Hameed, A.S.,Harjes, R.H., 1997. Asset pricing, time-varying risk premia and interest rate risk. Journal of Banking and Finance 21, 315–335.
[23] French, K.R., 1980. Stock returns and the weekend e¤ect. Journal of Financial Economics 8, 55–69.
[24] Gorton, G.B., Pennacchi, G.G., 1995. Banks and loan sales: Marketing non-marketable assets. Journal of Monetary Economics 35, 389-411.
[25] Greenbaum, S.I., Thakor, A.V., 1987. Bank funding modes: Securitization ver-sus deposits. Journal of Banking and Finance 11, 379-401.
[26] Hicks, J.R., 1946. Value and capital. Oxford: Clarendon Press.
[27] Keswani, A., Marsh, I.W., Zagonov, M., 2011. Bank regulations and inter-est rate risk: an international perspective. Cass Business School and Toulouse Business School, Working paper series.
[28] Keys, B.J., Mukherjee, T.K., Seru, A., Vig, V., 2010. Did securitization lead to lax screening? Evidence from subprime loans. Quarterly Journal of Economics 125, 307-362.
[29] Laeven, L., Levine, R., 2007. Is there a diversi…cation discount in …nancial conglomerates? Journal of Financial Economics 85, 331-367.
[31] Loutskina, E., Strahan, P.E., 2009. Securitization and the declining impact of bank …nance on loan supply: evidence from mortgage originations. Journal of Finance 64, 861-889.
[32] Mian, A.R., Su…, A., 2009. The consequences of mortgage credit expansion: Evidence from the U.S. mortgage default crisis. Quarterly Journal of Economics 124, 1449–1496.
[33] Nelson, C.R., Siegel, A.F., 1987. Parsimonious modeling of yield curve. Journal of Business 60, 473-489
[34] Pettengill, G.N., Wingender, J.R. , Kohli, R., 2003. Arbitrage, institutional investors, and the Monday e¤ect. Quarterly Journal of Business and Economics 42, 49-63.
[35] Purnanandam, A.K., 2007. Interest rate derivatives at commercial banks: An empirical investigation. Journal of Monetary Economics 54, 1769-1808
[36] Purnanandam, A.K., 2011. Originate-to-distribute model and the subprime mortgage crisis. Review of Financial Studies 24, 1881-1915.
[37] Redington, F.M., 1952. Review of the principles of life o¢ce valuations. Journal of the Institute of Actuaries 78, 286-340.
[38] Samuelson, P., 1945. The e¤ects of interest rate increases on the banking system. American Economic Review 35, 16-27.
[39] Skreta, V., Veldkamp, L., 2009. Ratings shopping and asset complexity: A theory of ratings in‡ation. Journal of Monetary Economics 56, 678-695.
[40] Smith, R., Staikouras, C., Wood, G., 2003. Non-interest income and total in-come stability. Bank of England, Working paper series No 198.
[41] Stone, B.K., 1974. Systematic interest rate risk in a two-index model of returns. Journal of Financial and Quantitative Analysis 9, 709-721.
Figure 1. US zero-coupon yield curve level, slope and curvature
This figure depicts time-series plots of the Nelson and Siegel (1978) zero-coupon yield curve factors for the US over the 2001 to 2009 period. Shown are the estimates of the interest rate yield curve level (β1), slope (β2) and curvature (β3).
-10 0 10
2001 2002 2003 2004 2005 2006 2007 2008 2009 Level
Slope Curvature
Table 1: Bank loan sales and securitization activities by year
This table presents the summary statistics of the US publically traded bank holding companies (BHCs) securitization and assets sales activities by year. Reported are the average values of assets by category, expressed as a proportion of BHCs’ total assets, securitized or sold within a given year, and the percentage of BHCs (in italics) involved in issuance of new securitization and loan sales transactions in the same year. The respective data are compiled from Schedule HC-S of the Federal Reserve System’s FY-9C …lings for a sample of 304 …nancial intermediaries analysed in this study.
2001 2002 2003 2004 2005 2006 2007 2008
Loan sales
1-4 family residential 0.0424 0.0226 0.0129 0.0164 0.0146 0.0075 0.0062 0.0087
13.36% 11.30% 11.82% 12.58% 12.58% 12.58% 13.25% 13.71%
Home equity lines 0.0000 0.0000 0.0000 0.0000 0.0001 0.0040 0.0024 0.0002
0.00% 0.00% 0.00% 0.00% 0.33% 0.99% 0.66% 0.67%
Credit card receivables 0.0005 0.0000 0.0003 0.0004 0.0000 0.0001 0.0000 0.0006
2.53% 1.37% 2.36% 2.65% 1.99% 1.99% 2.32% 2.34%
Auto loans 0.0000 0.0001 0.0000 0.0000 0.0000 0.0014 0.0000 0.0152
0.00% 0.34% 0.00% 0.33% 0.00% 0.33% 0.00% 0.33%
Other consumer loans 0.0044 0.0091 0.0003 0.0000 0.0000 0.0000 0.0000 0.0003
1.08% 0.34% 0.34% 0.00% 0.00% 0.00% 0.00% 0.33%
C&I loans 0.0126 0.0020 0.0028 0.0018 0.0051 0.0017 0.0107 0.0001
2.53% 2.40% 2.36% 2.65% 2.32% 1.99% 0.66% 0.33%
Other loans 0.0143 0.0019 0.0033 0.0089 0.0040 0.0100 0.0312 0.0168
0.72% 1.03% 1.69% 2.65% 1.66% 1.32% 1.99% 3.34%
Loan securitization
1-4 family residential 0.2218 0.0708 0.0641 0.0342 0.0412 0.0562 0.0325 0.0497
11.55% 8.22% 6.42% 6.29% 4.97% 4.30% 4.30% 5.35%
Home equity lines 0.0086 0.0021 0.0033 0.0093 0.0120 0.0037 0.0000 0.0033
1.81% 0.68% 1.01% 1.66% 1.32% 0.99% 0.33% 1.67%
Credit card receivables 0.0274 0.0049 0.0055 0.0147 0.0101 0.0160 0.0108 0.0060
1.44% 1.03% 0.68% 0.99% 0.99% 1.99% 1.32% 1.67%
Auto loans 0.0147 0.0133 0.0286 0.0119 0.0086 0.0126 0.0203 0.0118
5.42% 1.71% 2.03% 1.99% 0.99% 1.32% 0.33% 1.67%
Other consumer loans 0.0110 0.0031 0.0036 0.0041 0.0040 0.0074 0.0007 0.0011
2.89% 1.03% 0.68% 0.66% 1.32% 1.66% 0.99% 1.00%
C&I loans 0.0264 0.0111 0.0046 0.0036 0.0048 0.0043 0.0029 0.0006
3.61% 3.08% 2.36% 1.66% 1.32% 1.99% 1.32% 1.67%
Other loans 0.0128 0.0055 0.0138 0.0054 0.0094 0.0096 0.0069 0.0246
Table 2: Selected characteristics of bank holding companies
This table provides a comparison of selected …nancial characteristics for securitisers and non-securitisers over the 2001 to 2009 period. A bank holding company (BHC) is de…ned as securitiser if it reports at least one securitisation transaction over the analysed period in Schedule HC-S of the Federal Reserve System’s FY-9C …lings. Reported are the mean [median] values of the considered accounting variables. This includes an institution’s asset growth rate (AGR); equity capital (CAP) calculated as the ratio of BHC’s book value of equity capital to its total assets; the Her…ndahl-Hirschman (non)interest revenue concentration index H_NITR(H_NOIR) calculated on the basis of twelve (eight) part breakdown of the (non)interest income; the proportion of total assets that are liquid (LATA); the Her…ndahl-Hirschman loan concentration index (H_LOAN) computed considering …ve loan categories; the bank’s provision for loan and lease losses scaled by total loans (LLP); maturity gap (GAP) calculated as the di¤erence between interest-earning assets and interest-bearing liabilities maturing or being repriced within one year, scaled by the bank’s total assets; the net credit protection (protection bought minus sold) NECP purchased by a bank; the ratio of non-performing loans to total loans is NPL; return on assets (ROA); the measure of bank revenue diversi…cation (ROID); and the ratio of the institution’s risk-weighted to total assets (TRA). The economic environment is proxied by the annual growth rate in the gross domestic product (GDPG), and the Aruoba-Diebold-Scotti Business Conditions Index (ADSI). ***, **, and * denote statistical signi…cance at the 1%, 5%, and 10% level respectively for an appropriate mean [median] equality test.
Variable Securitizers Non-securitizers All BHCs Equality test mean/[median] mean/[median] mean/[median] mean/[median] Panel A: BHC …nancial characteristics
Asset growth rate 0.101 0.126 0.121 1.04
AGR [0.077] [0.091] [0.088] [3.03***]
Capitalisation 0.098 0.091 0.093 -3.20***
CAP [0.088] [0.088] [0.088] [0.34]
Interest income HHI 0.076 0.064 0.067 -1.96*
H_NITR [0.019] [0.016] [0.017] [4.54***]
Liquidity 0.264 0.261 0.262 -0.45
LATA [0.242] [0.238] [0.239] [0.37]
Loan HHI 0.530 0.608 0.590 10.51***
H_LOAN [0.530] [0.601] [0.582] [10.34***]
Loan loss provision 0.006 0.004 0.005 -5.66***
LLP [0.004] [0.003] [0.003] [6.34***]
Maturity gap 0.177 0.160 0.164 -2.56**
GAP [0.141] [0.130] [0.132] [2.09**]
Net credit protection 6.54E-04 1.38E-05 1.61E-04 -3.66***
NECP [0.000] [0.000] [0.000] [0.48]
Non-interest income HHI 0.177 0.213 0.205 5.02***
H_NOIR [0.142] [0.191] [0.177] [6.72***]
Non-performing loans 0.012 0.010 0.010 -4.16***
NPL [0.008] [0.006] [0.006] [7.77***]
Return on assets 0.012 0.009 0.009 -4.78***
ROA [0.011] [0.010] [0.010] [3.59***]
Revenue Diversi…cation 0.427 0.330 0.352 -10.56***
ROID [0.409] [0.300] [0.315] [9.94***]
Total risk adjusted assets 0.749 0.740 0.742 -1.37
TRA [0.758] [0.748] [0.750] [1.58]
Panel B: Economic environment characteristics
GDP growth 0.017 0.023 0.021 13.93***
GDPG [0.020] [0.025] [0.025] [14.21***]