N A N O E X P R E S S
Open Access
Analysis of oxygen vacancy in Co-doped ZnO
using the electron density distribution obtained
using MEM
Ji Hun Park
1†, Yeong Ju Lee
1,2†, Jong-Seong Bae
3, Bum-Su Kim
1, Yong Chan Cho
4, Chikako Moriyoshi
5,
Yoshihiro Kuroiwa
5, Seunghun Lee
6,7*and Se-Young Jeong
1*Abstract
Oxygen vacancy (VO) strongly affects the properties of oxides. In this study, we used X-ray diffraction (XRD) to study changes in the VOconcentration as a function of the Co-doping level of ZnO. Rietveld refinement yielded a different result from that determined via X-ray photoelectron spectroscopy (XPS), but additional maximum entropy method (MEM) analysis led it to compensate for the difference. VOtended to gradually decrease with increased Co doping, and ferromagnetic behavior was not observed regardless of the Co-doping concentration. MEM analysis demonstrated that reliable information related to the defects in the ZnO-based system can be obtained using X-ray diffraction alone.
Keywords:ZnO; Rietveld refinement; Maximum entropy method; Oxygen vacancy; Co-doped ZnO
Background
Oxygen vacancy (VO), one of the representative native
defects in oxides, has received much attention because of the important role played thereby in determining the physical properties of materials [1-3]. Various tools have been used for the qualitative and quantitative analysis of VO. These include photoluminescence [4],
ultraviolet-visible (UV-vis) [5], Raman [5], and X-ray photoelectron spectroscopic (XPS) techniques [6]. Quantitative ana-lyses of VO have been successfully performed via
Rutherford backscattering spectroscopy [7] or X-ray ab-sorption spectroscopy using synchrotron radiation [8]. Additionally, X-ray diffraction (XRD) is a simple and useful tool for analysis of VObecause it reveals the
crys-tal structure and the electron density distribution of periodic arrays of atoms [9].
Fitting of X-ray diffraction data using the Rietveld re-finement has been attempted for the quantitative ana-lyses of VO in terms of oxygen site occupancy [10,11].
However, additional corrections and the use of neutron or synchrotron X-rays were required [11-13]. Electron density profiling using the maximum entropy method (MEM) is also a suitable tool for analysis of VObecause
it uses the more precise Rietveld refinement that resolves summation-terminated errors and affords a better structural model [14,15]. Furthermore, MEM in-troduces negligible modeling errors via least-biased electronic reconstruction of X-ray diffraction patterns in real space [15].
We sought to confirm whether MEM analysis could be used for analysis of VO. In this study, we applied such
analysis to VO that changed as a function of the
Co-doping concentration in ZnO. Co-doped ZnO is a good candidate room-temperature magnetic semiconductor and has been intensively studied in terms of intrinsic ferromagnetism. However, the origin of such ferromag-netism remains controversial, and the presence thereof limits applications of the semiconductor. VO was
regarded, until recently, to explain the ferromagnetism and was reported to be affected by Co-doping concen-tration [8]. Herein, we analyzed the change in VOas a
function of Co-doping concentration and compared the results with XPS data. A method of analysis of VO is
proposed, using conventional XRD and MEM techniques. * Correspondence:[email protected];[email protected]
†Equal contributors
6
The Institute of Basic Science, Korea University, Seoul 136-713, Republic of Korea
1
Department of Cogno-Mechatronics Engineering, Pusan National University, Miryang 627-706, South Korea
Full list of author information is available at the end of the article
Methods
ZnO and Co-doped ZnO (Zn1−xCoxO, x= 0.01, 0.05,
0.1) powder samples were fabricated by sol-gel methods [16,17]. Zinc acetate dihydrate (Sigma-Aldrich, St. Louis, MO, USA) and cobalt acetate tetrahydrate (Sigma-Aldrich, St. Louis, MO, USA), used as starting materials, were dissolved in 2-methoxyethanol (Sigma-Aldrich, St. Louis, MO, USA) and stabilized by monoethanolamine (Sigma-Aldrich, St. Louis, MO, USA). To exclude the possibility of external contamination, the dissolution and drying processes were performed under a pure argon gas (99.999% purity) atmosphere, and under vac-uum, each for 10 h, respectively. The organic residuals in samples were completely removed via an intermedi-ate heat treatment at 300°C and a subsequent final heat treatment at 800°C under vacuum for 10 h [16]. The samples used in this study were characterized using XRD, and we found a high degree of crystallinity, which was comparable to that of commercially available high-quality powder samples (ZnO; CAS 1314-13-2, Sigma-Aldrich, St. Louis, MO, USA). We also characterized the samples using synchrotron radiation, and we found high sample quality. A characterization study using synchro-tron radiation will be submitted to a specialized journal soon. XRD (Empyrean Series 2, PANalytical) experi-ments were performed to analyze the crystal structures and electron density distributions of the powder sam-ples. The Rietveld and MEM analyses were performed using a published technique [18]. The MEM calculation was performed using ENIGMA software [19] with 66 × 66 × 104 pixels. The electron density distribution was reconstructed using the VESTA visualization program [20]. An X-ray photoelectron spectrometer (model: Theta Probe (Thermo Electron Co., Waltham, MA, USA), Korean Basic Science Institute, Busan Center) was used for atomic composition analysis. Magnetic-field-dependent magnetization was measured using a vi-brating sample magnetometer (VSM) equipped with a physical property measurement system (PPMS; Model 6000, Quantum Design, San Diego, CA, USA).
Results and discussion
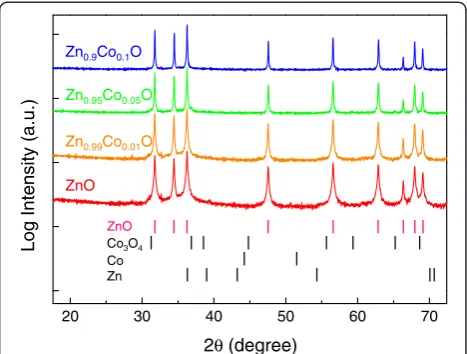
Figure 1 shows the XRD patterns of the ZnO and ZnCoO powder samples. The Bragg peaks correspond to the wurtzite ZnO structure and other possible second-ary species [16,21]. The diffraction intensity of each sample is presented logarithmically to better observe the background levels. Figure 1 shows that the XRD pat-terns of all samples had pronounced diffraction peaks that corresponded to wurtzite ZnO, with no additional peaks corresponding to secondary phases (at least within the detection limits). This indicates that the Co2+ ions were well-substituted during doping into Zn sites, without creation of secondary species [16,22]. Doping
Co into ZnO tended to decrease the full-width at half-maximum (FWHM) values of XRD peaks. To quantita-tively analyze this trend, the grain sizes of each powder sample were calculated using the Scherrer equation [23]. These sizes were estimated to be 93, 107, 115, and 143 nm for ZnO, Zn0.99Co0.01O, Zn0.95Co0.05O, and
Zn0.9Co0.1O, respectively. Co doping thus improved the
crystallinity of the samples, in proportional to the Co-doping concentration, in our experimental range [24]. The crystallinity of ZnO can be greatly affected by lat-tice strain [25] or native defects such as VO[26-28] and
interstitial zinc (Zni) [27,28]. The contribution of lattice
strain (resulting from the Co-doping concentration) to differences in crystallinity was assumed to be negligible because all powder samples were post-annealed at both 300°C and 800°C [17,29], which would relieve any lattice strain. Co doping was thought to induce insignificant amounts of lattice strain that might result from a differ-ence in ionic radii, because the ionic radius of Zn2+ (74 pm) is similar to that of Co2+(72 pm) [30]. Conse-quently, the observed enhancement in the crystallinity of the samples was attributed to a decrease in the dens-ity of crystal defects caused by Co doping. A quantita-tive analysis of VO and Zni was performed to explore
this hypothesis; we refined the XRD patterns of the samples.
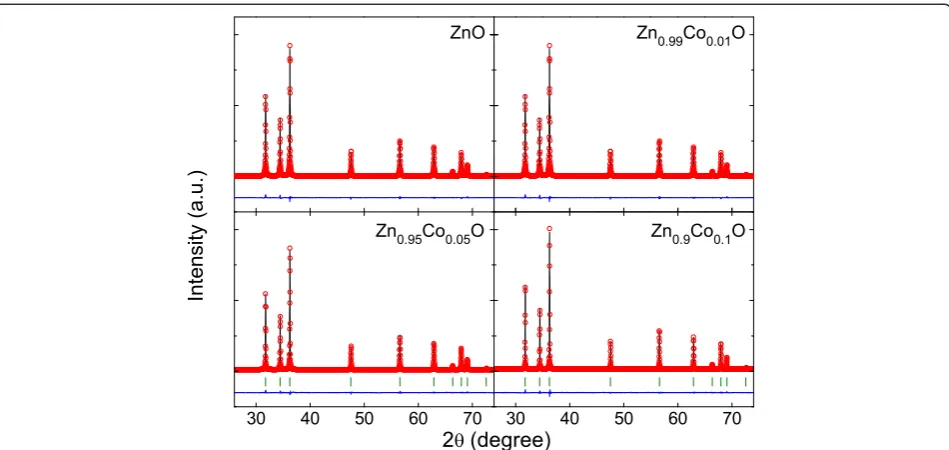
Figure 2 shows the Rietveld refinement results for the ZnO and ZnCoO samples performed using single-phase wurtzite ZnO. The reliability factors based on the Bragg intensity (RI) and structure factor (RF) were below 1.5% and 0.8%, respectively, for all samples (Table 1). The refinement results revealed that the lattice constants steadily increased with increasing Co-doping level. It is known that formation of Zni
leads to an increase in lattice constants [31], while
20 30 40 50 60 70
Co
2θ(degree)
Log
Intensity
(a.u.)
Co3O4
Zn
ZnO
ZnO Zn0.99Co0.01O
Zn0.95Co0.05O
[image:2.595.305.539.89.266.2]Zn0.9Co0.1O
Figure 1XRD patterns of ZnO and Zn1−xCoxO (x= 0.01, 0.05, 0.1)
formation of VOinduces a decrease in lattice constants
[32]. The observed reduction of internal defects, and the increased lattice constants with increasing Co-doping level, indicated that the main defects embed-ded in the ZnO sample were VO, and hence, their
density decreased as the Co-doping concentration increased.
An additional Rietveld refinement of the oxygen occu-pancies in each finalized Rietveld refinement was performed to examine the validity of this concept. Table 1 also lists the change in the oxygen occupancy [ΔgO= (gO(ZnO)−gO(ZnCoO))/gO(ZnO)] for each sam-ple, wheregO refers to oxygen site occupancy. The oxy-gen occupancy increased for Zn0.99Co0.01O (i.e., negative
ΔgO was obtained) but decreased for Zn0.95Co0.05O and
Zn0.9Co0.1O. Also, the oxygen vacancy was greater for
Zn0.95Co0.05O than for Zn0.9Co0.1O. MEM analysis was
used to further examine this trend.
It was expected that the presence of VO in ZnO and
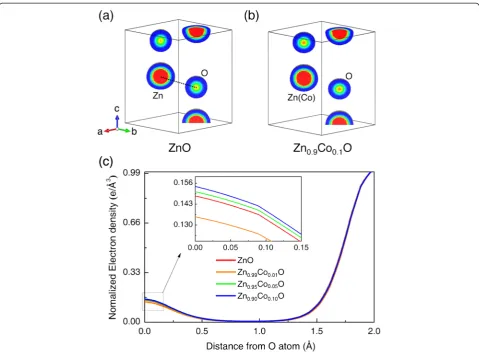
ZnCoO would induce changes in the electron density distributions of the oxygen atoms. Hence, the electron densities of the oxygen atoms as a function of Co-doping concentration were investigated via MEM/Riet-veld analysis [18]. Figure 3a,b show electron density maps of the ZnO and Zn0.9Co0.1O samples in the (110)
plane, respectively. The Zn sites of the ZnO sample and the Zn(Co) sites of the Zn0.9Co0.1O sample did not
noticeably differ in electron density. This is because of the low-dopant concentration used, and because Zn and Co exhibited similar electron density distributions, as Zn2+ and Co2+ have similar total numbers of electrons [33,34]. However, the electron densities at the central O atoms of ZnO and Zn0.9Co0.1O were clearly
differ-ent, thus, 20.65 and 21.91 e/A3, respectively. This indi-cated that the oxygen sites in the wurtzite ZnO structure became increasingly occupied by oxygen atoms after Co doping. Thus, Co doping decreased the VOcontent.
Figure 3c shows the electron density line profiles along the direction of the O-Zn bond. These profiles en-able precise analysis of oxygen occupancy as a function of the Co content. The lines were normalized to the electron density at the Zn(Co) atomic position to allow comparison of VO with Zn occupancy. The electron
[image:3.595.62.537.88.313.2]density at the O atomic position increased in the order
Figure 2Powder XRD patterns and Rietveld refinement results. Powder XRD patterns (black lines) and Rietveld refinement results (red circles) of ZnO, Zn0.99Co0.01O, Zn0.95Co0.05O, and Zn0.9Co0.1O samples. The differences between the XRD patterns and Rietveld refinement results are
[image:3.595.57.289.629.701.2]indicated by the lower blue lines. The green bars provide the calculated Bragg peak positions.
Table 1 Reliability factors of ZnO and ZnCoO samples
Sample RI(%) RF(%) a(Å) ΔgO(%)
ZnO 1.473 0.731 3.24989
-Zn0.99Co0.01O 1.066 0.605 3.25084 −0.39
Zn0.95Co0.05O 0.942 0.509 3.25120 2.03
Zn0.9Co0.1O 0.776 0.414 3.25235 3.48
Zn0.99Co0.01O < ZnO < Zn0.95Co0.05O < Zn0.9Co0.1O, in
agreement with the Rietveld refinement results. The sample with 1% Co doping exhibited significantly lower oxygen electron density, which did not agree with the Rietveld refinement data.
XPS was used to rationalize the conflicting VOresults.
Figure 4 shows the percentage change in oxygen occu-pancy as a function of Co concentration as determined by the Rietveld refinement, MEM, and XPS techniques. The MEM data were calculated from the integrals of the electron density profiles of the Zn(Co) and O atom posi-tions shown in Figure 3c and the ratio of the oxygen electron density area to the Zn(Co) electron density area. The change in oxygen occupancy revealed by XPS was obtained from the integrals of the areas of the Zn 2p, Co 2p, and the O 1s peaks. The calculation of change in oxygen occupancy was performed on the basis of a pure ZnO sample without Co dopant, as per the data of Table 1. The MEM and XPS results both showed that the sample with 1 mol% Co doping exhibited an abrupt
drop in oxygen content; the samples with more doping had increased oxygen contents, in agreement with both the Rietveld refinement and the MEM results. Conse-quently, the XPS profile results were in better agreement with the MEM results than with the data from the Riet-veld refinement. This indicated that MEM analysis, via repeated error correction, provided more accurate struc-tural information. These findings suggest that reliable defect analysis may be possible using easily accessed la-boratory X-ray data.
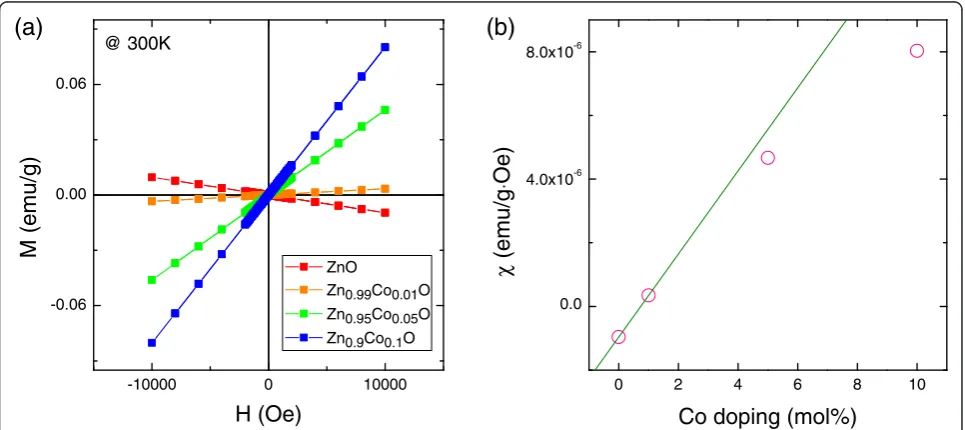
[image:4.595.58.538.87.441.2]The magnetic field dependences of magnetization (M-H curves) were measured for all samples (Figure 5a). Pure ZnO is diamagnetic, and Co-doped ZnO exhibits para-magnetic behavior because of the 3d electron of Co2+. We reconfirmed that the ZnCoO samples were not in-trinsically ferromagnetic, regardless of Co concentration [6,16]. Figure 5b shows the magnetic susceptibilities, which are the slopes of the M-H curves; these increased nonlinearly with increased Co-doping level. With increasing Co concentration, not all Co spins behave
Figure 3Electron density distribution and line profiles. Electron density distribution of(a)ZnO and(b)Zn0.9Co0.1O on the (110) plane obtained
paramagnetically; some spins assume configurations dif-fering in alignment. Considering the absence of second-ary phases in the above structural analysis, we conjecture that increasing numbers of Co atoms assuming positions neighboring oxygen atoms created an antiferromag-netic configuration via superexchange interaction.
The observed trend, that creation of VOwas suppressed
with increasing Co-doping level, is attributable to differ-ences in the Zn-O and Co-O bond strengths; the O2−ions in the wurtzite ZnO structure are tetrahedrally coordi-nated and thereby form four Zn-O bonds [35]. Doping of Co2+ ions into ZnO creates Co-O bonds, the diatomic
bond dissociation energy of which is higher than that of the Zn-O bond by 84 kJ/mol (Zn-O: 284 kJ/mol, Co-O: 368 kJ/mol) [36]. This indicates that the Co-O bonds cre-ated by Co doping enhanced the average bond strength between oxygen ions and neighboring cations, i.e., doping decreased the possibility of oxygen-cation bond dissoci-ation during sample fabricdissoci-ation or post-treatment process-ing [36]. The experimental results indicate that VO
decreased at high-level Co doping (i.e., above 5 mol%). The supporting analyses suggest that Co doping can im-pede creation of VO. However, the abrupt increase of VO
at 1 mol% of Co doping is not well-understood and war-rants additional study.
Conclusions
The Rietveld refinement results of the X-ray diffraction patterns of the ZnCoO system indicated that increased Co doping of ZnO tended to decrease the VO, but the
VO increased slightly upon 1 mol% of Co doping. The
MEM results were in better agreement with the XPS data, which indicated that MEM analysis could be a reli-able tool for the study of VO. Additional research is
needed to explain the anomalous behavior at 1 mol% of Co doping. More advanced X-ray electron density stud-ies using synchrotron radiation would provide more pre-cise and reliable data, but nevertheless, our present work shows that MEM is a reliable technique for the analysis of defects in materials characterized by XRD, which is a readily accessible tool in the material scientist labora-tory. This approach will be of particular value in early-stage studies of oxide systems.
-10000 0 10000
-0.06 0.00 0.06
0 2 4 6 8 10
0.0 4.0x10⁻⁶ 8.0x10⁻⁶
M
(emu/g)
H (Oe)
ZnO
Zn0.99Co0.01O
Zn0.95Co0.05O
Zn0.9Co0.1O @ 300K
(a)
(b)
χ
(emu/g
⋅
Oe)
[image:5.595.58.291.89.260.2]Co doping (mol%)
Figure 5M-H curves and magnetic susceptibilities.(a)M-H curves of ZnO with different Co-doping levels.(b)Magnetic susceptibilities as a function of Co doping.
0 2 4 6 8 10
-8 -6 -4 -2 0 2 4
6 XPS
MEM
Rietveld Refinement
Oxygen Percentage Change (%)
[image:5.595.57.540.490.705.2]Co doping Concentration (mol %)
Competing interests
The authors declare that they have no competing interests.
Authors’contributions
JHP designed and planned the experiment. JHP and YJL carried out Rietveld refinement and MEM analysis. JSB contributed to experiments and analysis for XPS. BSK performed powder sample fabrication. YCC assisted with sample characterization and manuscript preparation. CM and YK contributed to MEM analysis. SL performed data analysis and guided this work. JHP, SL, and SYJ wrote the main manuscript with help from the co-authors. SYJ is responsible for project planning. All authors discussed the results and reviewed the manuscript. All authors read and approved the final manuscript.
Authors’information
JHP, BSK and YJL are graduate students of the Department of Cogno-Mechatronics Engineering, Pusan National University, Republic of Korea. JSB is a senior researcher of Korea Basic Science Institute (Busan Center), Republic of Korea. YCC is a research professor at the Crystal Bank Institute, Pusan National University, Republic of Korea. CM and YK are professors at the Department of Physical Science, Hiroshima University, Japan. SL, the corresponding author, is a research scholar at the Department of Materials Science and Engineering, University of Maryland. SYJ, the corresponding author, is a professor at the Department of Cogno-Mechatronics Engineering, Pusan National University, Republic of Korea.
Acknowledgements
This work was supported for 2 years by a Pusan National University Research Grant.
Author details
1Department of Cogno-Mechatronics Engineering, Pusan National University, Miryang 627-706, South Korea.2Department of Nanofusion Engineering, Pusan National University, Busan 609-735, South Korea.3Busan Center, Korea Basic Science Institute, Busan 618-230, South Korea.4Frontier in Extreme Physics, Korea Research Institute of Standards and Science, Daejeon 305-340, South Korea.5Department of Physical Science, Hiroshima University, Higashi-Hiroshima 739-8526, Japan.6The Institute of Basic Science, Korea University, Seoul 136-713, Republic of Korea.7Current address: Department of Materials Science and Engineering, University of Maryland, College Park, MD 20742, USA.
Received: 16 December 2014 Accepted: 31 March 2015
References
1. Muller DA, Nakagawa N, Ohtomo A, Grazul JL, Hwang HY. Atomic-scale imaging of nanoengineered oxygen vacancy profiles in SrTiO3. Nature.
2004;430:657–61.
2. Schaub R. Wahlström E, Rønnau A, Lægsgaard E, Stensgaard I, Besenbacher F. Oxygen-mediated diffusion of oxygen vacancies on the TiO2(110) surface.
Science. 2003;299:377–9.
3. Janotti A, Van de Walle CG. Oxygen vacancies in ZnO. Appl Phys Lett. 2005;87:122102.
4. Zhao Q, Xu XY, Song XF, Zhang XZ, Yu DP. Enhanced field emission from ZnO nanorods via thermal annealing in oxygen. Appl Phys Lett. 2006;88:033102.
5. Guo M, Lu J, Wu Y, Wang Y, Luo M. UV and visible Raman studies of oxygen vacancies in rare-earth-doped ceria. Langmuir. 2011;27:3872–7.
6. Park JH, Lee S, Kim B-S, Kim W-K, Cho YC, Oh MW, et al. Effects of Al doping on the magnetic properties of ZnCoO and ZnCoO:H. Appl Phys Lett. 2014;104:052412.
7. Yang H, Wang YQ, Wang H, Jia QX. Oxygen concentration and its effect on the leakage current in BiFeO3thin films. Appl Phys Lett.
2010;96:012909.
8. Ciatto G, Trolio AD, Fonda E, Alippi P, Testa AM, Bonapasta AA. Evidence of cobalt-vacancy complexes in Zn1−xCoxO dilute magnetic semiconductors. Phys Rev Lett. 2011;107:127206.
9. Charles K. Crystal structure. In: Stuart J, Patricia M, Martin B, editors. Introduction to solid state physics 8th edition. John Wiley & Sons, Inc; 2004. P. 3–22.
10. Gržetaa B, Tkalčecb E, Goebbertb C, Takedac M, Takahashic M, Nomurad K, et al. Structural studies of nanocrystalline SnO2doped
with antimony: XRD and Mössbauer spectroscopy. J Phys Chem Solids. 2002;63:765–72.
11. Dann SE, Weller MT. Structure and oxygen stoichiometry in Sr3Co2O7-y
(0.94≤y≤1.22). J Solid State Chem. 1995;115:499–507.
12. Yamazaki S, Toraya H. Rietveld refinement of site-occupancy parameters of Mg2-xMnxSiO4using a new weight function in least-squares fitting. J Appl
Cryst. 1999;32:51–9.
13. Itoh T, Nishida Y, Tomita A, Fujie Y, Kitamura N, Idemoto Y, et al. Determination of the crystal structure and charge density of (Ba0.5Sr0.5)(Co0.8Fe0.2)O2.33 by Rietveld refinement and maximum entropy method analysis. Solid State Commun. 2009;149:41–4. 14. Kitaura R, Kitagawa S, Kubota Y, Kobayashi TC, Kindo K, Mita Y, et al.
Formation of a one-dimensional array of oxygen in a microporous metal-organic solid. Science. 2002;298:2358–61.
15. Takata M, Nishibori E, Sakata M. Charge density studies utilizing powder diffraction and MEM. Exploring of high Tc superconductors, C60
superconductors and manganites. Z Kristallogr. 2001;216:71–86. 16. Lee S, Kim B-S, Seo S-W, Cho YC, Kim SK, Kim JP, et al. A study of the correlation
between hydrogen content and magnetism in ZnCoO. J Appl Phys. 2012;111:07C304.
17. Kim SJ, Cha SY, Kim JY, Shin JM, Cho YC, Lee S, et al. Ferromagnetism in ZnCoO due to hydrogen-mediated Co−H−Co complexes: how to avoid the formation of Co metal clusters? J Phys Chem C. 2012;116:12196–202.
18. Kuroiwa Y, Aoyagi S, Sawada A. Evidence for Pb-O Covalency in tetragonal PbTiO3. Phys Rev Lett. 2001;87:217601.
19. Tanaka H, Takata M, Nishibori E, Kato K, Iishi T, Sakata M. ENIGMA: maximum-entropy method program package for huge systems. J Appl Cryst. 2002;35:282–6.
20. Momma K, Izumi F. VESTA 3 for three-dimensional visualization of crystal, volumetric and morphology data. J Appl Cryst. 2011;44:1272–6. 21. Koch U, Fojtik A, Weller IH, Henglein A. Photochemistry of semiconductor
colloids. Preparation of extremely small ZnO particles, fluorescence phenomena and size quantization effects. Chem Phys Lett. 1985;122:507–10.
22. Yuhas BD, Zitoun DO, Pauzauskie PJ, He R, Yang P. Transition-metal doped zinc oxide nanowires. Angew Chem. 2006;118:434–7.
23. Patterson AL. The Scherrer formula for X-ray particle size determination. Phys Rev. 1939;56:978–82.
24. Kim K-K, Song J-H, Jung H-J, Choi W-K, Park S-J, Song J-H. The grain size effects on the photoluminescence of ZnO/α-Al2O3
grown by radio-frequency magnetron sputtering. J Appl Phys. 2000;87:3573–6.
25. Li D, Haneda H. Morphologies of zinc oxide particles and their effects on photocatalysis. Chemosphere. 2003;51:129–37.
26. Yang P, Yan H, Mao S, Russo R, Johnson J, Saykally R, et al. Controlled growth of ZnO nanowires and their optical properties. Adv Funct Mater. 2002;12:323–31.
27. Kang HS, Kang JS, Kim JW, Lee SY. Annealing effect on the property of ultraviolet and green emissions of ZnO thin films. J Appl Phys. 2004;95:1246–50.
28. Kim K-K, Kim H-S, Hwang D-K, Lim J-H, Park S-J. Realization of p-type ZnO thin films via phosphorus doping and thermal activation of the dopant. Appl Phys Lett. 2003;83:63–5.
29. Reynolds DC, Look DC, Jogai B, Jones RL, Litton CW, Harsch W, et al. Optical properties of ZnO crystals containing internal strains. J Lumin.
1999;82:173–6.
30. Yan L, Ong CK, Rao XS. Magnetic order in Co-doped and„Mn, Co… codoped ZnO thin films by pulsed laser deposition. J Appl Phys. 2004;96:508–11.
31. Yamamoto O, Komatsu M, Sawai J, Nakagawa Z. Effect of lattice constant of zinc oxide on antibacterial characteristics. J Mater Sci–Mater Med. 2004;15:847–51.
32. Khalid M, Ziese M, Setzer A, Esquinazi P, Lorenz M, Hochmuth H, et al. Defect-induced magnetic order in pure ZnO films. Phys Rev B. 2009;80:035331.
33. Lee C-R, Wang C-C, Chen K-C, Lee G-H, Wang Y. Bond characterization of metal squarate complexes [MII(C4O4)(H2O)4; M = Fe, Co, Ni, Zn]. J Phys Chem A.
34. SenKov ON, Miracle DB. Effect of the atomic size distribution on glass forming ability of amorphous metallic alloys. Mater Res Bull. 2001;36:2183–98.
35. Wang ZL. Nanostructures of zinc oxide. Mater Today. 2004;7:26–33. 36. Tan K, Nijem N, Canepa P, Gong Q, Li J, Thonhauser T, et al. Stability and
hydrolyzation of metal organic frameworks with paddle-wheel SBUs upon hydration. Chem Mater. 2012;24:3153–67.
Submit your manuscript to a
journal and benefi t from:
7 Convenient online submission
7 Rigorous peer review
7 Immediate publication on acceptance
7 Open access: articles freely available online
7 High visibility within the fi eld
7 Retaining the copyright to your article