N A N O E X P R E S S
Open Access
The Two-Dimensional Nanocomposite
of Molybdenum Disulfide and
Nitrogen-Doped Graphene Oxide for Efficient
Counter Electrode of Dye-Sensitized Solar
Cells
Chao-Kuang Cheng
2, Che-Hsien Lin
2, Hsuan-Chung Wu
1, Chen-Chi M. Ma
3, Tsung-Kuang Yeh
2, Huei-Yu Chou
2,
Chuen-Horng Tsai
2and Chien-Kuo Hsieh
1*Abstract
In this study, we reported the synthesis of the two-dimensional (2D) nanocomposite of molybdenum disulfide and nitrogen-doped graphene oxide (MoS2/nGO) as a platinum-free counter electrode (CE) for dye-sensitized solar cells
(DSSCs). X-ray photoelectron spectroscopy (XPS), high-resolution transmission electron microscopy (HRTEM), and Raman spectroscopy were used to examine the characteristics of the 2D nanocomposite of MoS2/nGO. The cyclic
voltammetry (CV), electrochemical impedance spectra (EIS), and the Tafel polarization measurements were carried out to examine the electrocatalytic abilities. XPS and Raman results showed the 2D behaviors of the prepared nanomaterials. HRTEM micrographs showed the direct evidence of the 2D nanocomposite of MoS2/nGO. The
results of electrocatalytic examinations indicated the MoS2/nGO owning the low charge transfer resistance, high
electrocatalytic activity, and fast reaction kinetics for the reduction of triiodide to iodide on the electrolyte–electrode interface. The 2D nanocomposite of MoS2/nGO combined the advantages of the high specific surface of nGO and the
plenty edge sites of MoS2and showed the promoted properties different from those of their individual constituents to
create a new outstanding property. The DSSC with MoS2/nGO nanocomposite CE showed a photovoltaic conversion
efficiency (PCE) of 5.95 % under an illumination of AM 1.5 (100 mW/cm2), which was up to 92.2 % of the DSSC with the conventional platinum (Pt) CE (PCE = 6.43 %). These results reveal the potential of the MoS2/nGO nanocomposite in the
use of low-cost, scalable, and efficient Pt-free CEs for DSSCs.
Keywords:Molybdenum disulfide, Nitrogen-doped, Graphene oxide, Counter electrode, Dye-sensitized solar cells
Background
Dye-sensitized solar cells (DSSCs) are considered as the next-generation solar cells, because of low cost, easy process, and low energy consumption [1–4]. The conven-tional DSSC is composed of a ruthenium dye-sensitized titanium dioxide (TiO2) working electrode (WE), an elec-trolyte containing iodine ions, and a platinum (Pt) catalyst counter electrode (CE) [1]. In order to ensure the per-formance of DSSCs, Pt plays an important catalytic
material for DSSCs. However, due to Pt as an expensive and scarce material, it is necessary to find an alternative economical material to replace Pt for profitable DSSCs.
Carbon materials show the advantages of their low cost, high surface area, and high electric conductivity. Recently, low-dimensional carbon nanomaterials, such as carbon nanotubes (CNTs) [5, 6], carbon nanofibers (CNFs) [7, 8], graphene [9–11], and graphene oxide (GO) [9, 12], have been found to replace Pt for DSSCs. Some recent reports have claimed that the performance of carbon nanomaterials in the CE of DSSCs benefited from the presence of the plenty active sites, which may be attributed to the defect sites [7, 11, 12]. GO is an
* Correspondence:jack_hsieh@mail.mcut.edu.tw
1Department of Materials Engineering, Ming Chi University of Technology,
New Taipei City 24301, Taiwan, Republic of China
Full list of author information is available at the end of the article
important carbon nanomaterial in the graphene family. In addition, due to their unique two-dimensional (2D) nanostructural feature, high specific surface area, elec-trochemical stability, and hydrophilic oxygen-containing groups, GO have been widely used as anchored templates to synthesize nanocomposites for DSSC CEs [13, 14]. However, GO suffered relatively high oxygen-containing defects and structural defects such as vacancies and topo-logical defects on the surface. The plenty oxygen-containing defects on the GO surface brought out the low exchange current density, because the surface defects cut down the electrical conductivity [15]. In order to over-come the disadvantages of GO, nitrogen atoms doped into GO to synthesize the nitrogen-doped GO (nGO) were demonstrated to repair the defects, which provided the improvement in the electronic structure of GO [16]. On the other hand, the nitrogen-doped process broadens the electrochemical application area of a variety of carbon-based nanomaterials, including the nitrogen-doped CNT for glucose sensor [17], the nitrogen-doped re-duced graphene oxide (N-rGO) for the DSSC [18], the nitrogen-doped graphene, and the N-rGO for superca-pacitors [19, 20]. Nitrogen-doped carbon-based nano-materials not only can adjust the work function of graphene [21] but also can improve the electrical conductivity and the electrochemical properties of the graphene family.
Recently, stimulated by the discovery of the 2D nanoma-terial graphene, the transition metal dichalcogenides (TMDCs) with the 2D nanostructure have attracted con-siderable attention [22–28]. Molybdenum disulfide (MoS2) is a typical TMDC, one unit sheet pile up with three layers which is S–Mo–S arranged sequentially [25, 26]. MoS2has been found recently with its excellent catalytic activity because their edge planes provided abundant active sites for catalytic reactions [24, 29].
In this study, we synthesized the 2D nanocomposite of molybdenum disulfide and nitrogen-doped graphene oxide (MoS2/nGO) based on the 2D nanomaterials of MoS2and nGO. Due to the high specific surface of nGO, the nGO was used as the anchored templates to synthesize the MoS2on the surface as the 2D nanocom-posite of MoS2/nGO. The N-doping atoms of nGO not only repaired the vacancies but also replaced the O atoms of GO to enhance the electrical conductivity. In combin-ing the advantages of the high specific surface of nGO with the improving conductivity and the excellent catalytic activity of MoS2, the 2D nanocomposite of MoS2/nGO showed the outstanding electrocatalytic activities. The synthesized MoS2/nGO nanocomposite was used as a CE to assemble into a Pt-free DSSC and examined under the illumination of AM 1.5 (100 mW/cm2). The DSSC with MoS2/nGO nanocomposite CE exhibited the impressive photovoltaic conversion efficiency (PCE, η) of 5.95 %. It
was up to 92.2 % compared with the DSSC using the con-ventional Pt CE (η= 6.43 %). The results showed that MoS2/nGO nanocomposites have great potential for DSSC-related applications and indicated its potential as an alternative to replace Pt.
Methods
Synthesis of MoS2/nGO Nanocomposite CE
Three steps were used for preparing the MoS2/nGO nanocomposite CE. In step 1, GO nanosheets were syn-thesized from natural graphite flakes (Alfa Aesar, Ultra Superior Purity >99.9999 %) by using modified Hummer’s method [30]. In step 2, hydrothermal synthesis method was used to dope nitrogen atoms into GO to obtain nGO nanosheets [16], 120 mg GO dissolved in 120 mL deion-ized water, and followed by 1 h of sonication. The as-synthesized GO solution was prepared by using 3 mL ammonia (NH4OH) and 2 mL hydrazine hydrate (N2H4) as the reducing agents. Subsequently, the aforementioned solution was transferred into a Teflon-lined autoclave and heated to 120 °C for 3 h to synthesize the nGO. After hydrothermal synthesis reaction, the nGO precipitates were washed with deionized water for several times and collected by centrifugation and then dried in vacuum. In step 3, 30 mg ammonium tetrathiomolybdate ((NH4)2MoS4) powder (ProChem, Inc., purity of 99.99 %) and 30 mg nGO powder were added to 4 mL N,N -dimethylformamide (DMF) for dispersion and then soni-cated for 1 day. Subsequently, the dispersed solution was coated on fluorine-doped tin oxide (FTO) glass substrates (TEC-7, 2.2 mm, Hartford) by spin coating technology. Then, the obtained sample was dried in air for 1 h. Finally, the prepared sample was heated in the gas mixture (H2/Ar = 1:9) at 300 °C for 30 min by a typical home-made hot-wall thermal chemical vapor deposition (CVD) system (a horizontal furnace and a quartz tube) to obtain the 2D nanocomposite of MoS2/nGO CE.
Preparation of nGO, MoS2, and Pt CEs
Fabrication of DSSCs
For the preparation of the WE, nanocrystalline TiO2was coated on FTO glass substrates by using screen print technology. The coated TiO2samples were then heated to 550 °C for 30 min in the air. After the sinter process, the WE-coated TiO2 on FTO glass substrates was immersed into N719 (Solaronix) solution (0.3 mM in a mixture of acetonitrile and tertbutylalcohol (volume ra-tio 1:1)) at 50 °C for 1 h. Subsequently, the dye-adsorbed TiO2WE was washed with acetonitrile for a few seconds to remove the remaining dye and dried at room temperature. Finally, the DSSCs were consisted of the WE, various CEs, and the iodide-based electrolyte (AN-50, Solaronix) with the 60-μm-thick hot-melt spacer (SX1170-60, Solaronix) between the two electrodes.
Characterizations
X-ray photoelectron spectroscopy (XPS) (PHI Quantera SXM/AES 650 Auger Electron Spectrometer (ULVAC-PHI INC., Japan) equipped with a hemispherical electron analyzer and a scanning monochromated Al K-α (hv = 1486.6 eV) X-ray source) was used to examine the chemical states of the prepared samples. Raman spec-troscopy was performed with a confocal micro-Raman spectroscope (LABRAM HR 800 UV, Japan) using a 632.8-nm laser source (50 m W) with a spot size of ap-proximately 1 μm to characterize the prepared CEs. The nanostructures of nGO nanosheet and MoS2/nGO nano-composite were investigated by using the high-resolution transmission electron microscopy (HRTEM, JEOL-2100F, Japan). Cyclic voltammetry (CV) measurements were car-ried out by using a potentiostat/galvanostat (PGSTAT 302N, Autolab, Eco Chemie, Netherlands) in a three-electrode configuration to examine the electrocatalytic activities of our prepared CEs. The Pt wire and an Ag/ AgNO3electrode were used as the counter and reference electrodes for the CV measurements, respectively. The so-lution used for CV measurements contained 1 mM I2, 10 mM LiI, and 0.1 M LiClO4in acetonitrile [7]. Electro-chemical impedance spectra (EIS) were obtained by using the aforementioned potentiostat/galvanostat equipped with a frequency response analysis (FRA) module. The Nyquist plots were scanned from 106to 10−2Hz, and an applied voltage of 10 mV was used. The EIS results were fitted by using an equivalent circuit model with Autolab FRA software (v4.9, EcoChemie B.V.). The Tafel polarization measurements were also measured by the same potentiostat/galvanostat equipped with a linear polarization module. Both EIS and the Tafel polarization measurements were obtained by using symmetrical devices based on two identical CEs in the dark. All photo-current density–voltage measurements of DSSCs were measured under the simulated solar illumination (AM 1.5, 100 mW/cm2, Oriel 91160, Newport Corporation, USA),
which was equipped with an AM 1.5G filter (Oriel 81088A, Newport Corporation, USA) and a 300-W xenon lamp (Oriel 6258, Newport Corporation, USA). The inten-sity of the simulated incident light was calibrated using a reference Si cell (calibrated at NREL, PVM-81).
Results and Discussion
Composition and Structural Features
XPS was applied to analyze the chemical states of the GO, nGO, and MoS2/nGO nanocomposites. The curve fitting was performed by using a Gaussian–Lorentzian peak after the Shirley background correction. Figure 1 and Table 1 show the XPS fitting results of various CEs. Figure 1a shows the wide spectral region and illustrates the differences in the relative intensities of the character-istic peaks of the elements present. As we can see from Fig. 1a, compared with GO, the N1s of nGO can be found, and the C1s intensity of nGO dramatically de-creased after the nitrogen-doped process. The decline O1s peak of nGO indicated that lots of oxygen group defects on the GO surface were repaired. Figure 1b shows the high-resolution N1s spectra of the MoS2/ nGO nanocomposite; three N configurations with graph-itic N (401.6 eV), pyridinic N (398.4 eV), and pyrrolic N (400 eV) were presented [20, 32–34]. The MoS2 nano-sheets were synthesized onto the surface of the nanosheet-like nGO as a MoS2-nGO nanocomposite material by an easy thermal reduction method.
Figure 1c shows the high-resolution Mo3d spectra of the MoS2/nGO nanocomposite, the 3d5/2 and 3d3/2 of the four valence states of Mo: Mo4+3d5/2(229.3 eV) and Mo4+ 3d3/2(232.4 eV); Mo5+3d5/2 (230.1 eV) and Mo5+ 3d3/2 (233.2 eV); Mo6+ 3d5/2 (231.3 eV) and Mo6+ 3d3/2 (234.4 eV); and Mo6+ 3d5/2 (232.5 eV) and Mo6+ 3d3/2 (235.6 eV), can be assigned to MoS2, Mo2S5, MoS3, and MoO3, respectively [35]. Figure 1d shows that
[image:3.595.305.538.529.701.2]resolution S2p spectra of the MoS2/nGO nanocompos-ite, the 2p3/2 and 2p1/2, of the two valence states of S were assigned to MoS2 and Mo2S5, respectively. This phenomenon might correspond to the MoS3with a for-mula of [Mo(4+)(S2)2−S2−] and the intermediate product Mo2S5[35]. These binding energies can be attributed to the MoS2 crystal as previously reported [24, 36]. The summary of the peak positions (N1s, Mo3d, and S2p) and the atomic percentages were also given in Table 1.
On the other hand, the molybdenum sulfide precursor followed by the thermal reduction method was to make the sulfidation process to synthesize the crystallized MoS2 based on the following reaction (Eq. (1) and Eq. (2)) [37]:
NH4
ð Þ2MoS4→2NH3þ H2S þ MoS3 ð1Þ
MoS3þ H→MoS2þ H2S ð2Þ
Furthermore, in order to intensively study the chem-ical states of nGO, we also paid the attention to analyze the C1s peaks as shown in Fig. 2. Figure 2 and Table 2 show the C1s fitting results of various CEs. There were five peaks that can be obtained from the MoS2/nGO and nGO in Fig. 2a, b, respectively, which were the C=C (284.5 eV), C–N(sp2) (285.5 eV), C–N(sp3) (287.0 eV), C(O)O (289.1 eV), and the π–π* (291 eV), respectively. There were six peaks that can be obtained from GO in Fig. 2c, which were the C=C (284.4 eV), C–C (285.1 eV), C–O (286.1 eV), C–O–C (286.5 eV), C=O (287.4 eV), and C(O)O (288.7 eV), respectively [38]. The summary of the peak positions and the atomic percentages is also given in Table 2. As we can see from Fig. 2c, the C1s core level spectra C–O–C of GO indicated a high degree of oxidation. However, after the nitrogen-doped process, the C–O–C peaks in both MoS2/nGO (Fig. 2a) and nGO (Fig. 2b) almost disappeared and the C–N groups (C–N(sp2) and C–N(sp3)) were obtained obviously [33]. According to this change, this phenomenon indicated that the oxygen atoms were almost replaced by nitrogen atoms. The results confirmed that nitrogen atoms were introduced into the GO structure, which improved the conductivity of the basal plane of nGO.
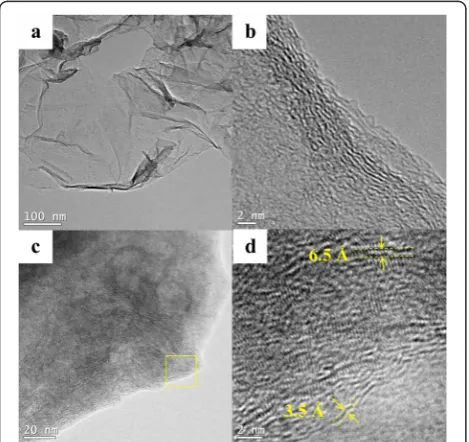
Figure 3a, b shows the TEM and HRTEM images of nGO nanosheets, respectively. Figure 3c shows the TEM images of the MoS2/nGO nanocomposite; the nGO
served as the template where MoS2 was anchored. The nanostructure of MoS2/nGO was investigated by HRTEM (as shown in Fig. 3d); the sheet-like MoS2was successfully formed onto the nGO surface. As we can see from Fig. 3c, there were many interlayers of the MoS2chemically reduced on the nGO surface. The edge planes of MoS2 provided plenty active sites to enhance the electrocatalytic activities. Figure 3d shows the HRTEM of the interlayer distance of the MoS2 which was about 6.5 Å [26], corresponding to the spacing be-tween (002) planes of MoS2[39]. Furthermore, the inter-layer distance of the nGO was about 3.5 Å [40], which was larger than that of graphene nanosheets of 3.35 Å; it was probably due to nGO which still remained as an oxygen-containing functional group [41].
Figure 4 shows the Raman spectrum of nGO, MoS2, and MoS2/nGO. The nGO exhibited two graphitic char-acteristic peaks at 1354.6 and 1597.6 cm−1, correspond-ing to D and G bands, respectively [42]. G band corresponded to the in-plane bond stretching of pairs of graphitic sp2 carbon atoms; D band corresponded to the defects of lattice and lattice distortion. The three MoS2 characteristic peaks at 378.9, 404.3, and 453.8 cm−1 cor-responded to E12g, A1g, and 2LA(M) modes, respectively [43]. The E12gmode was associated with the opposite vi-bration of two S atoms with respect to the Mo atom. The A1g mode was associated with the out-of-plane vi-bration of only S atoms in opposite directions. The 2LA(M) was attributed to the resonance second-order Raman effects that appear when the excitation wave-length of the 632.8 nm laser was near that of the MoS2 electronic absorption bands [43].
Electrocatalytic Properties
[image:4.595.55.541.100.196.2]To investigate the electrocatalytic properties of Pt, MoS2, nGO, and MoS2/nGO toward the reduction of I3−, the CV analysis was carried out with a scan rate of 50 mV/s. As shown in Fig. 5a, the redox couple peaks corresponded to the reduction of I3− (cathodic peak current (Ipc) : I3−+ 2e−→3I−) and the oxidation of I− (anodic peak current (Ipa) : 3I−→I3−+ 2e−) in the CV measurement [44]. The Ipc value of MoS2/nGO (−1.41 mA/cm2) was stronger than those of MoS2 (−1.21 mA/cm2) and nGO (−0.69 mA/cm2). It indicated Table 1N1s, Mo3d, and S2p peak positions and atomic percentages of MoS2/nGO
Peak Fitting of the peak binding energy (eV) (atomic percentage (%))
PyridinicN PyrrolicN GraphiticN N1s 398.4(54.89) 400.0(36.26) 401.6(8.83)
Mo4+3d
5/2 Mo4+3d3/2 Mo5+3d5/2 Mo5+3d3/2 Mo6+3d5/2 Mo6+3d3/2 Mo6+3d5/2 Mo6+3d5/2
Mo3d 229.3(38.87) 231.4(25.91) 230.1(7.34) 233.2(4.89) 231.3(0.27) 234.4(0.18) 232.5(13.50) 235.6(9.00) S2−2p
3/2 S2−2p1/2 S22−2p3/2 S22−2p1/2
that MoS2 CE could enhance the charge transport rate. The electrocatalytic activity and the redox barrier of I3−/I− couples could be evaluated in terms of its cathodic peak current (Ipc) and the peak to peak voltage separation (Epp), respectively. TheEppof the MoS2/nGO CE became rela-tively lower when compared to that of MoS2and nGO. This was immediately responsible for the lower
overpotential losses in the MoS2/nGO CE than those of the MoS2and nGO CEs [44]. It also signified that dis-persing intrinsically electrocatalytic MoS2onto the nGO surface led to enhance the electrocatalytic activity for I3− reduction. EIS analysis was used to examine the electron interface transfer activity. Figure 5b shows the Nyquist plots of various CEs: the intercept on the horizontal axis was the series resistance (Rs); the left semicircle at high frequency represented the charge transfer resistance (Rct) at electrode/electrolyte interface; and the right semicircle at low frequency represented the Nernst dif-fusion impedance (Ndiff) in the electrolyte [44]. TheRct values of the MoS2/nGO, MoS2, and nGO were 5.4 Ω/ cm2, 10.1Ω/cm2, and 21.3Ω/cm2, respectively. The EIS results showed that the Rct of MoS2/nGO CE was smaller than that of nGO and MoS2 CEs. The Ndiff values of the MoS2/nGO, MoS2, and nGO were 8.3 Ω/ cm2, 7.1Ω/cm2, and 8.1Ω/cm2, respectively. The simi-larNdiffvalues of various CEs due to the same thickness spacers were used for the EIS measurements. To further confirm the electrocatalytic activity of the prepared CEs, the Tafel polarization measurements were also car-ried out to examine the exchange current density (J0) and the limiting current density (Jlim). Figure 5c shows the Tafel polarization measurements of various CEs; the
J0was related to the charge transfer activity in the inter-face between CE and electrolyte, which can be estimated from the extrapolated intercepts of the anodic and cath-odic branches of the corresponding Tafel curves [45]. TheJlim depended on the diffusion coefficient and con-centration of the I−/I3−redox couple.J0andJlimwere re-lated to the following reaction [9, 22]:
J0¼nRT
FRct ð
3Þ
D¼ 1
2nFCJlim ð4Þ
where R is the gas constant,T is the temperature, F is the Faraday constant, l is the spacer thickness, Cis the concentration of I3− species, andnrepresents the
num-ber of electrons involve in the reaction at the electrode/ electrolyte interface.
TheJ0varies inversely withRctas shown in Eq. (3); the variation ofJ0obtained from the Tafel curve is generally in accordance with the change tendency ofRct obtained from the EIS plot. In addition, the intersection of the cathodic branch and the equilibrium potential line in the Tafel measurement can be considered as the Jlim. As shown in Fig. 5c, the J0 and Jlim of MoS2CE (1.32 and 2.88 mA/cm2) were higher than those of nGO CE (0.14 and 2.29 mA/cm2). The results indicated that the charge transfer abilities of MoS2 were much better than those of nGO. Compared with the MoS2 and nGO CEs, the
[image:5.595.56.289.83.600.2]MoS2/nGO nanocomposite CE showed the promoted J0 and Jlim values of 2.64 and 4.67 mA/cm2, respectively. MoS2/nGO nanocomposite showed the highest J0 and
Jlim and the lowest Rct. The result indicated that MoS2/ nGO CE provided the outstanding electron transfer abil-ity in the electrode–electrolyte interface. Additionally, MoS2/nGO CE showed the enhanced Jlim value, which indicated a faster diffusion rate of the I−/I3− redox cou-ples; this phenomenon was related to the better diffusion coefficient in Eq. (4). According to the results of CV, EIS, and the Tafel polarization, the MoS2/nGO CE dem-onstrated the superior electron transfer performance at the electrode–electrolyte interface and provided a lower energy barrier for the redox reactions. The results ob-tained from CV, EIS, and the Tafel polarization were summarized in Table 3.
Photovoltaic Performance of DSSCs
In order to investigate the photovoltaic performance of DSSCs, the cell performance were characterized by short-circuit current density (Jsc), open-circuit voltage (Voc), fill factor (F.F.), and PCE (η (%)). The fill factor
and the PCE of the DSSCs could be estimated from Eq. (5) and Eq. (6) [46]:
F:F:¼Vmax Jmax
Voc Jsc ð
5Þ
ηð Þ ¼% Voc Jsc F:F:
Pin
100 ð6Þ
where Pinis the power input and Vmax andJmaxare the voltage and the current density for the maximum power output, respectively.
[image:6.595.56.537.99.192.2]The photocurrent–voltage characteristics of DSSCs with various CEs including Pt, nGO, MoS2, and MoS2/ nGO were shown in Fig. 5d. The corresponding photo-voltaic parameters were also summarized in Table 1. From the photovoltaic characteristics, the DSSCs with the nGO CE showed the lowestJsc(14.66 mA/cm2) and F.F. (0.38) and exhibited a lower PCE (3.95 %). The cor-responding photovoltaic parameters of MoS2CE showed that the PCE (4.09 %), Jsc (15.39 mA/cm2), and F.F. (0.39) were higher than those of nGO CE. The results showed that the catalytic ability of MoS2was higher than that of nGO. The Jsc and F.F. values of the MoS2 CE were better than those of nGO CE, which might be due to the plenty edge sites of the MoS2. Compared with the nGO and MoS2, MoS2/nGO showed the excellent Jsc Table 2C1s peak positions and atomic percentages of GO, nGO, and MoS2/nGO
Samples Fitting of the C1s peak binding energy (eV, atomic percentage (%))
C=C C–N(sp2) C–N(sp3) C(O)O π–π* MoS2/nGO 284.5(54.94) 285.5(30.05) 287.0(10.18) 289.1(2.52) 291(2.28)
nGO 284.6(57.17) 285.6(22.63) 287.0(13.19) 289.1(3.85) 291(3.14) C=C C–C C–O C–O–C C=O C(O)O GO 284.4(15.73) 285.1(7.42) 286.1(9.81) 286.5(37.80) 287.4(22.95) 288.7(6.26)
Fig. 3aTEM and (b) HRTEM images of nGO and (c) TEM and (d) HRTEM images of MoS2/nGO
Fig. 4Raman spectrum of the nGO, MoS2, and MoS2/nGO. TheD,G,
E1
[image:6.595.57.292.481.702.2] [image:6.595.305.537.528.705.2](15.98 mA/cm2) and F.F. (0.53) and resulted in the out-standing PCE (5.95 %). In addition, all the CE materials exhibited the similar Voc values, because the DSSC devices in this study used the same WE and electrolyte. In summary, the 2D nanocomposite of MoS2/nGO com-bined the advantages of nGO and MoS2. The nGO pro-vided a large surface area to anchor MoS2, and the plenty edge sites of the anchored MoS2 promoted the
electrocatalytic activities. Furthermore, the promoted values of Jsc and F.F. made the PCE (5.95 %) of MoS2/ nGO nanocomposite CE comparable to the conventional Pt CE (6.43 %).
Conclusions
Based on the XPS, Raman spectrum, and HRTEM re-sults, the sheet-like MoS2was confirmed to form onto the surface of nGO nanosheet as the 2D nanocomposite of MoS2/nGO. According to CV, EIS, and the Tafel ana-lyses, MoS2/nGO owned the outstanding electrocatalytic activities. The MoS2/nGO combined the advantages of the high specific surface of nGO and the plenty edge sites of MoS2 and showed the properties different from those of their individual constituents to create a new outstanding property. Finally, the DSSCs assembled with MoS2/nGO CE exhibited excellent photovoltaic conversion efficiency (5.95 %) which was comparable to the DSSC with the conventional Pt CE (6.43 %). This work demonstrated that the MoS2/nGO nano-composite could offer a low-cost alternative to replace the expensive Pt in DSSCs.
Competing Interests
The authors declare that they have no competing interests.
Fig. 5aCV results of the I−/I3−redox system forPt,nGO,MoS2, andMoS2/nGOCEs.bNyquist plots based onPt,nGO,MoS2, andMoS2/nGOCEs. cTafel polarization curves of thePt,nGO,MoS2, andMoS2/nGOCEs.dPhotovoltaic characteristic efficiencies of DSSCs based onPt,nGO,MoS2,
[image:7.595.56.540.88.364.2]andMoS2/nGOCEs
Table 3Photovoltaic parameters and the electrochemical parameters from EIS, CV, and Tafel polarization measurements based on various CEs
Pt nGO MoS2 MoS2/nGO
Ipc(mA/cm 2
) −1.57 −0.69 −1.21 −1.41
Epp(V) 0.26 0.61 0.43 0.40
Rs(Ω/cm 2
) 26.3 25.7 26.0 25.7
Rct(Ω/cm 2
) 4.3 21.3 10.1 5.4
Ndiff(Ω/cm 2
) 7.6 8.1 7.1 8.3
J0(mA/cm 2
) 3.19 0.14 1.32 2.64
Jlim(mA/cm 2
) 5.65 2.29 2.88 4.67
Voc(V) 0.70 0.71 0.69 0.70
Jsc(mA/cm 2
) 16.14 14.66 15.39 15.98 F.F. 0.57 0.38 0.39 0.53
[image:7.595.56.290.563.731.2]Authors’Contributions
CKC synthesized and analyzed the materials. CHL fabricated the cells and did the characterization of the solar cells. CCMM, TKY, HCW, and HYC participated in the discussion. CHT and CKH developed the conceptual framework and supervised the work. All authors read and approved the final manuscript.
Authors’Information
CKC and CHL are PhD students at National Tsing Hua University. HYC is a PhD at National Tsing Hua University. CCMM holds a professor position at National Tsing Hua University. TKY holds a professor position at National Tsing Hua University. CHT holds a professor position at National Tsing Hua University. HCW holds an associate professor position at Ming Chi University of Technology. CKH holds an assistant professor position at Ming Chi University of Technology.
Acknowledgements
This work was financially supported by the Ministry of Science and Technology of Taiwan (MOST 103-2221-E-131-029).
Author details
1Department of Materials Engineering, Ming Chi University of Technology,
New Taipei City 24301, Taiwan, Republic of China.2Department of Engineering and System Science, National Tsing Hua University, Hsinchu 30013, Taiwan, Republic of China.3Department of Chemical Engineering,
National Tsing Hua University, Hsinchu 30013, Taiwan, Republic of China.
Received: 27 August 2015 Accepted: 25 January 2016
References
1. Oregan B, Gratzel M (1991) A low-cost, high-efficiency solar-cell based on dye-sensitized colloidal TiO2 films. Nature 353:737
2. Gratzel M (2003) Dye-sensitized solar cells. J Photochem Photobiol C-Photochem Rev 4:145
3. Gratzel M (2009) Recent advances in sensitized mesoscopic solar cells. Accounts Chem Res 42:1788
4. Shi ZW, Lu H, Liu Q, Cao FR, Guo J, Deng KM et al. (2014) Efficient p-type dye-sensitized solar cells with all-nano-electrodes: NiCo2S4 mesoporous nanosheet counter electrodes directly converted from NiCo2O4 photocathodes. Nanoscale Res Lett 9. DOI: 10.1186/1556-276X-9-608 5. Nam JG, Park YJ, Kim BS, Lee JS (2010) Enhancement of the efficiency of
dye-sensitized solar cell by utilizing carbon nanotube counter electrode. Scripta Mater 62:148
6. Huang SQ, Sun HC, Huang XM, Zhang QX, Li DM, Luo YH et al. (2012) Carbon nanotube counter electrode for high-efficient fibrous dye-sensitized solar cells. Nanoscale Res Lett 7. DOI: 10.1186/1556-276X-7-222
7. Hsieh CK, Tsai MC, Yen MY, Su CY, Chen KF, Ma CCM et al (2012) Direct synthesis of platelet graphitic-nanofibres as a highly porous counter-electrode in dye-sensitized solar cells. Phys Chem Chem Phys 14:4058 8. Chen CS, Hsieh CK (2014) Oxygen-assisted low-pressure chemical vapor
deposition for the low-temperature direct growth of graphitic nanofibers on fluorine-doped tin oxide glass as a counter electrode for dye-sensitized solar cell. Jpn J Appl Phys 53. DOI: 10.7567/JJAP.53.11RE02
9. Ju MJ, Jeon IY, Lim K, Kim JC, Choi HJ, Choi IT et al (2014) Edge-carboxylated graphene nanoplatelets as oxygen-rich metal-free cathodes for organic dye-sensitized solar cells. Energ Environ Sci 7:1044
10. Wang H, Sun K, Tao F, Stacchiola DJ, Hu YH (2013) 3D honeycomb-like structured graphene and its high efficiency as a counter-electrode catalyst for dye-sensitized solar cells. Angew Chem Int Edit 52:9210
11. Kavan L, Yum JH, Gratzel M (2011) Optically transparent cathode for dye-sensitized solar cells based on graphene nanoplatelets. Acs Nano 5:165 12. Roy-Mayhew JD, Bozym DJ, Punckt C, Aksay IA (2010) Functionalized
graphene as a catalytic counter electrode in dye-sensitized solar cells. Acs Nano 4:6203
13. Yen MY, Teng CC, Hsiao MC, Liu PI, Chuang WP, Ma CCM et al (2011) Platinum nanoparticles/graphene composite catalyst as a novel composite counter electrode for high performance dye-sensitized solar cells. J Mater Chem 21:12880
14. Sun LJ, Bai Y, Zhang NQ, Sun KN (2015) The facile preparation of a cobalt disulfide-reduced graphene oxide composite film as an efficient counter electrode for dye-sensitized solar cells. Chem Commun 51:1846
15. Wu ZS, Ren WC, Gao LB, Zhao JP, Chen ZP, Liu BL et al (2009) Synthesis of graphene sheets with high electrical conductivity and good thermal stability by hydrogen arc discharge exfoliation. Acs Nano 3:411
16. Long DH, Li W, Ling LC, Miyawaki J, Mochida I, Yoon SH (2010) Preparation of nitrogen-doped graphene sheets by a combined chemical and hydrothermal reduction of graphene oxide. Langmuir 26:16096
17. Deng SY, Jian GQ, Lei JP, Hu Z, Ju HX (2009) A glucose biosensor based on direct electrochemistry of glucose oxidase immobilized on nitrogen-doped carbon nanotubes. Biosens Bioelectron 25:373
18. Hou SC, Cai X, Wu HW, Yu X, Peng M, Yan K et al (2013) Nitrogen-doped graphene for dye-sensitized solar cells and the role of nitrogen states in triiodide reduction. Energ Environ Sci 6:3356
19. Jeong HM, Lee JW, Shin WH, Choi YJ, Shin HJ, Kang JK et al (2011) Nitrogen-doped graphene for high-performance ultracapacitors and the importance of nitrogen-doped sites at basal planes. Nano Lett 11:2472 20. Nolan H, Mendoza-Sanchez B, Kumar NA, McEvoy N, O'Brien S, Nicolosi
V et al (2014) Nitrogen-doped reduced graphene oxide electrodes for electrochemical supercapacitors. Phys Chem Chem Phys 16:2280 21. Wang XR, Li XL, Zhang L, Yoon Y, Weber PK, Wang HL et al (2009) N-doping of
graphene through electrothermal reactions with ammonia. Science 324:768 22. Lei B, Li GR, Gao XP (2014) Morphology dependence of molybdenum
disulfide transparent counter electrode in dye-sensitized solar cells. J Mater Chem A 2:3919
23. Sie EJ, McIver J, Lee YH, Fu L, Kong J, Gedik N (2015) Valley-selective optical Stark effect in monolayer WS2. Nat Mater 14:290
24. Kibsgaard J, Chen ZB, Reinecke BN, Jaramillo TF (2012) Engineering the surface structure of MoS2 to preferentially expose active edge sites for electrocatalysis. Nat Mater 11:963
25. Radisavljevic B, Radenovic A, Brivio J, Giacometti V, Kis A (2011) Single-layer MoS2 transistors. Nat Nanotechnol 6:147
26. Zhan Y, Liu Z, Najmaei S, Ajayan PM, Lou J (2012) Large-area vapor-phase growth and characterization of MoS2 atomic layers on a SiO2 substrate. Small 8:966
27. Namgung SD, Yang S, Park K, Cho AJ, Kim H, Kwon JY (2015) Influence of post-annealing on the off current of MoS2 field-effect transistors. Nanoscale Res Lett 10:1
28. Castellanos-Gomez A, Poot M, Steele GA, van der Zant HSJ, Agrait N, Rubio-Bollinger G (2012) Mechanical properties of freely suspended semiconducting graphene-like layers based on MoS2. Nanoscale Res Lett 7:1 29. Xie J, Zhang H, Li S, Wang R, Sun X, Zhou M et al (2013) Defect-rich MoS2
ultrathin nanosheets with additional active edge sites for enhanced electrocatalytic hydrogen evolution. Adv Mater 25:5807
30. Marcano DC, Kosynkin DV, Berlin JM, Sinitskii A, Sun ZZ, Slesarev A et al (2010) Improved synthesis of graphene oxide. Acs Nano 4:4806 31. Papageorgiou N, Maier WF, Gratzel M (1997) An iodine/triiodide reduction
electrocatalyst for aqueous and organic media. J Electrochem Soc 144:876 32. Mou ZG, Chen XY, Du YK, Wang XM, Yang P, Wang SD (2011) Forming
mechanism of nitrogen doped graphene prepared by thermal solid-state reaction of graphite oxide and urea. Appl Surf Sci 258:1704
33. Khai TV, Na HG, Kwak DS, Kwon YJ, Ham H, Shim KB et al (2012) Influence of N-doping on the structural and photoluminescence properties of graphene oxide films. Carbon 50:3799
34. Lim J, Kim HA, Kim BH, Han CH, Jun Y (2014) Reversely fabricated dye-sensitized solar cells. Rsc Adv 4:243
35. Wang HW, Skeldon P, Thompson GE (1997) XPS studies of MoS2 formation from ammonium tetrathiomolybdate solutions. Surf Coat Tech 91:200 36. Liu CJ, Tai SY, Chou SW, Yu YC, Chang KD, Wang S et al (2012) Facile
synthesis of MoS2/graphene nanocomposite with high catalytic activity toward triiodide reduction in dye-sensitized solar cells. J Mater Chem 22:21057
37. Brito JL, Ilija M, Hernandez P (1995) Thermal and reductive decomposition of ammonium thiomolybdates. Thermochim Acta 256:325
38. Mattevi C, Eda G, Agnoli S, Miller S, Mkhoyan KA, Celik O et al (2009) Evolution of electrical, chemical, and structural properties of transparent and conducting chemically derived graphene thin films. Adv Funct Mater 19:2577
39. Tang GG, Sun JR, Wei C, Wu KQ, Ji XR, Liu SS et al (2012) Synthesis and characterization of flowerlike MoS2 nanostructures through CTAB-assisted hydrothermal process. Mater Lett 86:9
catalyst for hydrogen evolution in microbial electrolysis cells. J Mater Chem A 2:13795
41. Mei XF, Meng XQ, Wu FM (2015) Hydrothermal method for the production of reduced graphene oxide. Physica E 68:81
42. Guo HL, Su P, Kang XF, Ning SK (2013) Synthesis and characterization of nitrogen-doped graphene hydrogels by hydrothermal route with urea as reducing-doping agents. J Mater Chem A 1:2248
43. Windom BC, Sawyer WG, Hahn DW (2011) A Raman spectroscopic study of MoS2 and MoO3: applications to tribological systems. Tribol Lett 42:301 44. Wu MX, Lin X, Wang YD, Wang L, Guo W, Qu DD et al (2012) Economical
Pt-free catalysts for counter electrodes of dye-sensitized solar cells. J Am Chem Soc 134:3419
45. Kung CW, Chen HW, Lin CY, Huang KC, Vittal R, Ho KC (2012) CoS acicular nanorod arrays for the counter electrode of an efficient dye-sensitized solar cell. Acs Nano 6:7016
46. Wei YH, Chen CS, Ma CCM, Tsai CH, Hsieh CK (2014) Electrochemical pulsed deposition of platinum nanoparticles on indium tin oxide/polyethylene terephthalate as a flexible counter electrode for dye-sensitized solar cells. Thin Solid Films 570:277
Submit your manuscript to a
journal and benefi t from:
7Convenient online submission 7Rigorous peer review
7Immediate publication on acceptance 7Open access: articles freely available online 7High visibility within the fi eld
7Retaining the copyright to your article