© Associated Asia Research Foundation (AARF)
A Monthly Double-Blind Peer Reviewed Refereed Open Access International e-Journal - Included in the International Serial Directories.
Page | 1
ROR POTENTIAL HYDROPOWER OF NEPAL AT DIFFERENT
DISCHARGES
Raghunath Jha
Department of Civil Engineering,
Pulchowk Campus, Institute of Engineering, Nepal
ABSTRACT
The total hydropower potential of Nepal was assessed as 83,500 MW by Dr. Hari Man Shrestha during his Ph. D. research work in USSR in 1966. Since then, no further study has, so far, been done in this field. The 1966 Power potential estimate has been used by NEA, WECS and DOED for power development, licensing and policy making. However keeping in view the recent advancements in computer technology which have offered many benefits to the field of water resources and the importance of power estimation in Nepal Dr. Shrestha's estimate needs further review and updating. The hydro-meteorological data of DHM for hydrological analysis of all the rivers in Nepal incorporating GIS and the Hydropower Model that has specifically been developed by the author, the power potential and annual energy estimate on an ROR basis of the entire country has been estimated. The result shows that the total hydropower potential and corresponding annual energy capacity of Nepal on run off the river basis at Q40 and 80% efficiency is 53,836 MW and 346534 GWh respectively [3]. In this study Q30is used with 80% efficiency and estimates the total power potential of Nepal as 88,306 MW. The total dry energy is 53,021GWh and total wet energy is 421,430 GWH, totaling 474,451 GWH energy. This research also conclude that comparing Q30 and Q40, the installed power increased from 53,836MW to 88,306MW which is around 64% and the wet energy only increased by 36.9%.
Keywords -Hydropower Model, Gis, Potential Hydropower, Srtm Dem
GE-International Journal of Engineering Research
ISSN(O): 2321-1717, ISSN(P): 2394-420X Impact Factor- 5.613, Volume 6, Issue 9, September 2018 Website- www.aarf.asia, Email : editor@aarf.asia , editoraarf@gmail.com
© Associated Asia Research Foundation (AARF)
A Monthly Double-Blind Peer Reviewed Refereed Open Access International e-Journal - Included in the International Serial Directories.
Page | 2
Introduction
Dr. Hari Man Shrestha assessed the total hydropower potential in Nepal as 83500 MW in 1966
in his Ph. D. research in USSR. Since then, no further study has, so far, been done in this field
covering the entire nation. Dr Shrestha's work was more manual and he did his job with limited
available tools. The study was done with the few hydrological, meteorological, and
topographical data and the quality of data was very poor.
According to him only four discharge gauging stations were available in Nepal. However, the
availability of precipitation data was more than discharge data. He plotted the curve of rainfall
and elevation band. From the analysis of the curve, he calculated the discharge using the
regression equation developed using limited discharge gauging stations and rain gauge stations.
Manual delineation of catchment area of about 300 sq km was done with the old topographical
maps. The available heads along the rivers were calculated using contour interval and the
discharge were calculated by means of contour interval and Elevation-Rainfall curve. According
to him, each drop of water was used to calculate the power potential and considered efficiency
as 100 %.
Later the government institutions like NEA, WECS and DOED also attempted to estimate the
hydropower potential. But the estimates were influenced under the policy of the government
with priority to small, medium and large hydroelectric and multipurpose projects at different
facet of time. It is realized that the past efforts of identifying undeveloped hydropower capacity
by the different government agencies were more project-oriented and the methodologies for
undeveloped hydropower resources assessment werenot well defined. Also it should be
important to note that apart from Dr. Shrestha's estimate, no agency had previously attempted to
estimate the undeveloped hydropower capacity of the basins based on the site characteristics,
stream flow data and available hydrologic head. In a country of huge hydropower potential like
Nepal, this issue has to be properly addressed and the suitable methodology has to be developed.
Recent advances in computer technology have offered many benefits to the field of water
resources especially due to the development of Geographic Information Systems (GIS)[1],[2].
© Associated Asia Research Foundation (AARF)
A Monthly Double-Blind Peer Reviewed Refereed Open Access International e-Journal - Included in the International Serial Directories.
Page | 3 like delineating the drainage pattern, catchment area and to assess the hydropower potential of
the river reaches.
Keeping this in view, the objective of this study is to calculate the theoretical hydropower
potential of Nepal by using GIS and Hydropower Model.
Methodology
Flow chart of the methodology for the research is shown in Error! Reference source not found.. It can be divided into three components:
Hydrological Analysis
The monthly discharge of more than 100 river gauging stations from the year 1997 to 2006 were
collected from Department of Hydrology and Meteorology. Flow duration curve of each station
was developed and Q30, Q40, Q50 and Q60 were calculated for all 12 months. Here Q40 represent
the flow magnitude in an average year that can be expected to be equaled or exceeded 40
percentile of time. If the average monthly discharge were less that Q40 then average discharge of
the month were considered for power production otherwise Q40 discharge were considered. This
consideration is valid for all Q30, Q40, Q50 and Q60 discharges respectively. Then the specific
discharge (discharge divided by catchment area) of each gauging station were calculated and
used for calculating the discharges above and below the gauging station by multiplying the
average catchment area of upstream and downstream. Following example shows methodology
© Associated Asia Research Foundation (AARF)
A Monthly Double-Blind Peer Reviewed Refereed Open Access International e-Journal - Included in the International Serial Directories.
Page | 4 Let the catchment area and discharge at gauging stations a and b are Aa, Qa and Ab, Qb
respectively. The discharge uptoa gauging stations can be calculated using specific discharge at gauging station a, i.e specific discharge multiplied by catchment area The specific discharge at b
is calculated as (Qb –Qa)/(Ab– Aa). The discharge along the main river at x, Qx is calculated as
Qx = Qa + (Qb- Qa)/(Ab-Aa) * (Ax-Aa)
Where, Ax is catchment area at x. The discharge at x1 (on a distributary line), Qx1 is calculated as
Qx1 = (Qb- Qa)/(Ab-Aa) * Ax1
ii) GIS Analysis
The freely available SRTM dataset of 3” second resolution in WGS84 datum is downloaded
from seamless SRTM dataset site. The SRTM Decimal Degree format dataset is transformed to
MUTM (Modified Universal Transverse Mercator) and Everest datum and resampled to 100m
resolution. The available DEM is processed using GIS software and flow direction, flow
accumulation, river network, stream order, stream link and elevation along the generated rivers
are calculated. GIS Grid output of flow accumulation, stream order, stream link and river
elevation are converted into the ASCII format and fed to the Hydropower model.
iii) Hydropower model
Hydropower model is developed by the author and written in FORTRAN program. This model
reads the ASCII data processed in GIS software and calculates head from the river elevation. It
[image:4.612.150.365.43.234.2]reads discharge data processed in Hydrological analysis and calculates the installed capacity, wet Figure 1: Discharge Calculation
b Qa
Aa
Ab a
X x1
© Associated Asia Research Foundation (AARF)
A Monthly Double-Blind Peer Reviewed Refereed Open Access International e-Journal - Included in the International Serial Directories.
Page | 5 energy and dry energy in all generated rivers and for all discharge percentiles. The flowchart of
[image:5.612.71.504.118.512.2]the model is given in the Figure 3.
Figure 2: Flowchart of the Hydropower Calculation
Study Area
Most of the surface water in Nepal drains through four major rivers; Koshi (Saptakoshi),
Gandaki (Gandaki), Kanali and Mahakali and their tributaries. These all rivers originate from the
Himalayan Mountains or Tibet Plateau, forge through varied mountain ranges and are perennial. Numbering the stream using Stream link and Stream order
Calculatelength, elevation diff. and coordinate of intermediate points
Cal. the U/S and D/S catchment area
Cal. U/S, D/S discharges: Design Q = (Qu+Qd)/2
Call the Hydropower Module Read input
Power for 12 months
Calculate Installed power
Calculate Energy
For each basin For each stream number
ForQ30, Q40, Q50, Q60
Discharge intensity for 12 month, Q30,Q40,Q50,Q60 or average discharge
© Associated Asia Research Foundation (AARF)
A Monthly Double-Blind Peer Reviewed Refereed Open Access International e-Journal - Included in the International Serial Directories.
Page | 6 Other major rivers originate from the Mahabharata ranges. They are the Mechi, Kankai, Kamala,
Bagmati, Tinau, Rapti, and Babai. The Mahakali and Mechi rivers mark the international
[image:6.612.123.489.169.386.2]boundaries between Nepal and India
Figure 3: Major Watershed Boundary in Nepal
3.1 Koshi River Basin
The Koshi basin is the largest basin of Nepal. It lies in the eastern development region of
Nepal between latitudes 27°06'23" to 28°09'23"N and longitude 88°22'36" to 88°23'37"E. It
comprises an area of about 61,000 sq.km Out of the total catchment area, 27,816 sq. km
(45.6%) lies in Nepal and the remaining 33,184 sq.km. lies in Tibet, China. The river Koshi,
also commonly known as Sapta Koshi, comprises of seven rivers namely (from west to east);
Indrawati, Sunkoshi, Tamakoshi, Likhu, Dudhkoshi, Arun and Tamur. Out of these rivers,
three major rivers or tributaries originate in Tibet. They are Sunkoshi, Tamakoshiand Arun.
The Koshi River basin can be divided into three major river sub-basins: the Sunkoshi, Arun
and Tamor. The Sunkoshi River comprises of the Indrawati, Sunkoshi, Tamakoshi, Likhu
© Associated Asia Research Foundation (AARF)
A Monthly Double-Blind Peer Reviewed Refereed Open Access International e-Journal - Included in the International Serial Directories.
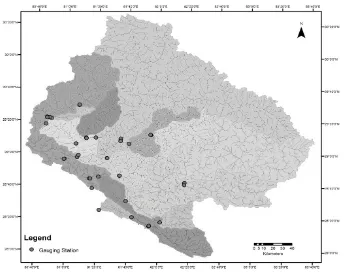
Page | 7 There are altogether thirty-four discharge gauging stations in different rivers: Majhimtar and
Mulghat in Tamor river; Uwagaon and Tudkeghat in Arun river; Rabuwaght in Dudhkoshi;
Sangutar in Likhu; Rasnalo in Khimti; Busti in Tamakoshi; Pachawarghat in Sunkoshi; Jalbire
[image:7.612.142.472.164.379.2]in Balpeni and Chatra in Saptakoshi are some of the major gauging stations.
Figure 4: The Koshi River Basin
3.2 Gandaki River Basin
The gandaki basin is the second largest basin of Nepal. It lies in the western development region
of Nepal between latitudes 27°21'00" to 29°20'00"N and longitude 82°53'00" to 86°13'00"E. It
covers an area of 31,890 sq. km. It is situated in Nawalparasi, Baglung, Chitwan, Makawanpur,
Mustang, Parbat, Palpa, Gorkha, Lumjung, Myagdi, Gulmi, Syangja, Dhading, Rasuwa, Kaski,
Arghakhanchi, Tanahu, and Nuwakot districts, lying within the higher Himalayas to the Terai.
© Associated Asia Research Foundation (AARF)
A Monthly Double-Blind Peer Reviewed Refereed Open Access International e-Journal - Included in the International Serial Directories.
[image:8.612.147.465.47.299.2]Page | 8 Figure 5: The Gandaki River Basin
3.3 Kankai River Basin
The Kankai River drains out from Ilam. It firstly flows towards the south-west and then makes
typical easterly bend from there to Bhatbat and finally turns towards south. The Kankai basin has
approximately 1,150 km2 as drainage area and approximately 110km in length. The average
discharge is 60m3/sec. In the eastern Nepal, the Terai Rivers have a gradient of 10-12 m per km
in the upper reaches, whereas, 5-6 m in the middle part and 1 m near indo-Nepal border. The
Kankai River is a little steeper than the others. The source of the Kankai Mai River is Chhintapu
hill in the Mahabharat range. Puwa Kholo, Jogmaikhola, Deomaikhola and Mai khola are its
main tributaries.
3.4 Bagmati River Basin
The Bagmati River with the drainage area of 3, 600km2 and the length of 160km starts from the
southern slopes of Sheopurilekh, north of Kathmandu valleyand flows straight to south-west
cutting through the Mahabharat range. It appears that the present nature of river came into
existence in Pleistocene times when the Kathmandu Lake disappeared. The Bagmati first flows
towards south west from Kathmandu upto Jhanalkot, from there to Gangate in south and later on
© Associated Asia Research Foundation (AARF)
A Monthly Double-Blind Peer Reviewed Refereed Open Access International e-Journal - Included in the International Serial Directories.
Page | 9 direction and finally to the south. The average discharge is reported to be approximately 210.
6m3/s.
3.5 Rapti River Basin
The West Rapti River has in its upper basin, two major tributaries, namely Jhimruk Khola and
Mari Khola. Both Rivers originate from Mahabharata range and flow south until they join at
Airawati from which location it is named West Rapti . About 25 km below the confluence of
Mari and Jhimruk Khola, the West Rapti River meets the Siwalik range from where it meanders
into Terai belt. The Rapti River, of approximately 257 km length, has an estimated yearly mean
runoff of about 125 cum/sec with a total drainage area of about to 6500 sq.km.
3.6 Karnali River Basin
The Kamali River, one of the three major rivers in Nepal originates from the south of
Mansarovar and Rokas lakes located in China (Tibet) and enter in Nepal near Khojarnath
flowing in southern direction as shown in Figure 65.
The drainage area in China is approximately 2500 km2 and that inNepal is approximately
41500km2. Therefore, the total drainage area is approximately 44000 km2. In Nepal it becomes
Humla Karnali. It makes a sharp bend at Naralagna Himal. From there, it flows towards the east
and to south west at Nima-pipalang. There it is joined by Mugu Karnali and Kharte Khola meets
at Sukhadik. In between these two tributaries the Raradaha (lake) is situated.
The length of Mugu Karnali is 160 km and Humla Karnali is100 km.
© Associated Asia Research Foundation (AARF)
A Monthly Double-Blind Peer Reviewed Refereed Open Access International e-Journal - Included in the International Serial Directories.
[image:10.612.135.484.47.327.2]Page | 10 Figure 6: The Karnali River Basin
3.7 Mahakali River Basin
The Mahakali River as shown in Figure 7, is 223 km long, having its origin in ApiHimal of the
Himalaya range It is an international river located on the western border of Nepal with India. The
total catchment area is approximately 15260 km2 and about 5400 km2 (35%) lies in Nepal. The
river starts from Milan glacier of India and from the Lipulekh of Nepal. It flows southwest
making numerous oxbow lakes in the Indian Territory. The main tributaries in the Nepal side are
Surnaga driver and Chamelia river. The Mahakali I irrigation project is under operation and
execution in the Terai plains. Mahakali is in dolomite up to Jhulaghat, whereas, in the south, it is
in gneiss and dolomite and near Rang unkhola it is in the Churia formation. Mahakali River
divides into two channels near Lamsari which again join together at Suklapur. The Mahakali
River meets the Karnali River in India Its estimated mean yearly runoff is 557 m3/sec.
Atthe Nepal-India border area, but officially located in Indian Territory at present, there is
Sharada Barrage crossing the Mahakali River. As an international river, the water right of the
© Associated Asia Research Foundation (AARF)
A Monthly Double-Blind Peer Reviewed Refereed Open Access International e-Journal - Included in the International Serial Directories.
[image:11.612.128.488.52.387.2]Page | 11 Figure 7: The Mahakali River Basin
Results
The installed capacity, dry energy, wet energy and total energy at different discharges for all
major rivers in Nepal excluding the small Churia Range rivers are shown here.
4.1 Kankai
The total installed power and total annual energy at 30%, 40%,50%, and 60% flow
exceedence has been calculated as385MW, 241.3MW, 147.5 MW,103.4 MW and 2033GWh,
© Associated Asia Research Foundation (AARF)
A Monthly Double-Blind Peer Reviewed Refereed Open Access International e-Journal - Included in the International Serial Directories.
Page | 12 Table 1: Installed Power, Dry Energy, Wet Energy and Total Energy of Kankai River
Discharge Installed Power, MW Dry Energy, GWh Wet Energy, GWh Total Energy, GWh
Q30 385 213 1,820 2,033
Q40 241.3 213 1304 1,517
Q50 147.5 213 822 1,035
Q60 103.4 213 595 808
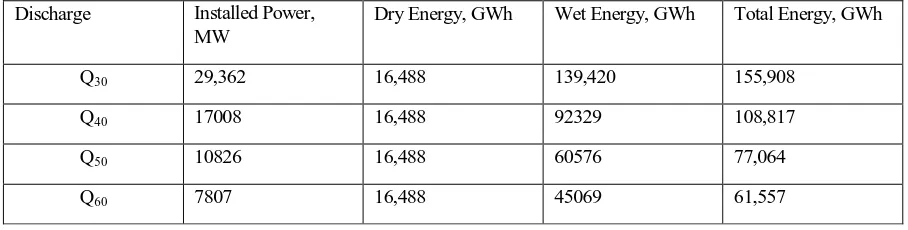
4.2 Koshi River Basin
The total installed power of the Koshi river basin at Q30, Q40, Q50, and Q60 flow exceedence is
29,362 MW, 17008 MW, 10826 MW and 7807 respectively and total energy from this basin is
[image:12.612.75.532.69.194.2]155,905 GWh, 108,817 GWh, 77,064 GWh and 61,557 GWh respectively.
Table 2: Installed Power, Dry Energy, Wet Energy and Total Energy of Koshi River
Discharge Installed Power, MW
Dry Energy, GWh Wet Energy, GWh Total Energy, GWh
Q30 29,362 16,488 139,420 155,908
Q40 17008 16,488 92329 108,817
Q50 10826 16,488 60576 77,064
Q60 7807 16,488 45069 61,557
4.3 Gandaki River
The individual installed power and annual energy of Gandaki river at 30%, 40%, 50%, and 60% of
flow exceedence is shown in Table 3.
Table 3: Installed Power, Dry Energy, Wet Energy and Total Energy of Gandaki River
Discharge Installed Power, MW Dry Energy, GWh Wet Energy, GWh Total Energy, GWh
Q30 28,980 16,260 138,520 154,780
Q40 17800 16,260 97113 113,373
Q50 12344 16,260 68550 84,810
[image:12.612.66.520.340.455.2]© Associated Asia Research Foundation (AARF)
A Monthly Double-Blind Peer Reviewed Refereed Open Access International e-Journal - Included in the International Serial Directories.
Page | 13
4.4 Bagmati River
The total installed power and total annual energy at 30%, 40%,50%,60% of flow exceedence has
been calculated as 679MW, 424.4MW,236 MW, 152.2 MW and 3452GWh, 2574.4 GWh,1607
[image:13.612.71.491.188.296.2]GWh, l 176.8GWh respectively as shown in Table 4.
Table 4: Installed Power, Dry Energy, Wet Energy and Total Energy of Bagmati River
Discharge Installed Power, MW
Dry Energy, GWh
Wet Energy, GWh
Total Energy, GWh
Q30 679 302 3,150 3,452
Q40 424 302 2271 2,573
Q50 236 302 1304 1,606
Q60 152 302 874 1,176
4.5 East Rapti Basins
The total potential energy at 30th, 40th, 50th and 60th percentiles of flow are 3760GWh, 2951.17GWh, 2094.12GWh, 1820.16 GWh and the installed powers are 670MW, 438.89 MW, 272.02 MW, 218.68 MW for the above respective cases. This is shown in Table 5.
Table 5: Installed Power, Dry Energy, Wet Energy and Total Energy of West Rapti River
Discharge Installed Power, MW
Dry Energy, GWh
Wet Energy, GWh Total Energy, GWh
Q30 670 550 3,210 3,760
Q40 438 550 2400 2,950
Q50 272 550 1543 2,093
Q60 218 550 1269 1,819
4.6 Karnali Basin
The total energy at 30th, 40th, 50th and 60th percentiles of flows are 134928GWh, 102324.03 GWh,
76189.69 GWU 64024.44 GWh and the installed powers are 24700MW, 15661.16 MW, 10572.70 MW,
[image:13.612.71.493.433.545.2]© Associated Asia Research Foundation (AARF)
A Monthly Double-Blind Peer Reviewed Refereed Open Access International e-Journal - Included in the International Serial Directories.
[image:14.612.71.483.69.170.2]Page | 14 Table 6: Installed Power, Dry Energy, Wet Energy and Total Energy of Karnali River
Discharge Installed Power, MW Dry Energy, GWh Wet Energy, GWh Total Energy, GWh
Q30 24,700 16658 118,270 134,928
Q40 15661 16658 85666.1 102,324
Q50 10573 16658 59531.8 76,190
Q60 8204 16658 47366.5 64,025
4.7 Mahakali Basin
The total potential energy at Q30, Q40, Q50, and Q60percentiles of flow for Mahakali River
are19590GWh, 14980.90 GWh, 12860.16 GWh, 10614.21 GWhand installed powers are 3530MW,
[image:14.612.68.482.316.417.2]2262 MW, 1849MW, 1411 MW for the above respective cases. This is shown in Table 7.
Table 7: Installed Power, Dry Energy, Wet Energy and Total Energy of Mahakali River.
Discharge Installed Power, MW Dry Energy, GWh Wet Energy, GWh Total Energy, GWh
Q30 3,530 2,550 17,040 19,590
Q40 2262 2550 12430 14,980
Q50 1849 2550 10309 12,859
Q60 1411 2550 8063 10,613
Discussion and recommendation
Table 8: Installed Power, Dry Energy, Wet Energy and Total Energy of whole Nepal
Installed Power, MW Dry Energy, GWh Wet Energy, GWh Total Energy, GWh Discharge
Q30 88,306 53,021 421,430 474,451
Q40 53,835 53,021 293,513 346,534
Q50 36,247 53,021 202,636 255,657
[image:14.612.72.509.488.640.2]© Associated Asia Research Foundation (AARF)
A Monthly Double-Blind Peer Reviewed Refereed Open Access International e-Journal - Included in the International Serial Directories.
Page | 15 The total hydropower potential of Nepal for Q30, Q40, Q50, and Q60 are 88306 M, 53836 MW, 36247
MW and 27543 MW respectively. The total potential dry energy for Q30, Q40, Q50, and Q60discharges are
474,451 GWh, 346,534 GWh, 255,657 GWh and 210,963 GWh respectively. The dry energy in each
case is same as 53021GWH because the discharge during the low flow is very less and only few turbines
will be operated. The three major river basins viz. Koshi, Gandaki and Karnali contribute 29362 MW,
28980 MW, 24700MW of power and 155908GWh, 154780 GWh, 134928GWh of energy respectively
thus contributing about 94% of total hydropower and hydroelectric energy potentials at Q30 discharge.
If Q30 is considered in comparison to Q40, then the installed power increases from 53,835MW to
88,306MW which is around 64% and the wet energy increased only by 346,534GWh to 474,451 GWh
which corresponds 36.9%increase. It can be interpreted from this statistics that the cost will be increased
[image:15.612.71.439.313.542.2]by 64% however the benefit will be increased only by 36.9%. This can be easily seen in Figure 8.
Figure 8: The Variation between the installed capacity and total Energy at different Discharges.
0 20000 40000 60000 80000 100000 120000 140000 0 100000 200000 300000 400000 500000 600000 700000
Discharge Q30 Q40 Q50 Q60
Ins ta lled C ap aci ty, MW Ener gy, G W h
Discharge at different Exceedence Propability
Total Energy Installed Capacity
© Associated Asia Research Foundation (AARF)
A Monthly Double-Blind Peer Reviewed Refereed Open Access International e-Journal - Included in the International Serial Directories.
Page | 16
REFERENCES
[1] B. Feizizadeh and E. M. Haslauer, GIS-based Procedures of Hydropower Potential for Tabriz
Basin, Iran
Society andLearning. © Herbert Wichmann Verlag, VDE VERLAG GMBH, Berlin/Offenbach. 2012, ISBN 978-3-87907-521-8
[2]Rovick P. Tarife, Anacita P. Tahud, Ellen Jane G. Gulben, Haroun Al Raschid Christopher P.
Macalisang, and Ma. Teresa T. Ignacio, Application of Geographic Information System (GIS) in
Hydropower Resource Assessment: A Case Study in Misamis Occidental, Philippines,
International Journal of Environmental Science and Development, Vol. 8, No. 7, July 2017.
[3] Raghunath Jha, Total Run-of-River type Hydropower Potential of Nepal, Hydro Nepal: Journal of Water, Energy and Environment ISSN 1995452 e-ISSN 2392-4101, Vol. 7, Pages 8-13, July 2010.
Rupesh Sah, Energy Mapping using GIS & Hydropower Model in Koshi, Narayani, Bagmati and Kankai basins, M. Sc. Thesis, Institute of Engineering, Department of Civil Engineering, M. Sc. rogram in Water Resources Engineering. Pulchowk Campus, 2009.
Sudip Prakash Adhikari, Energy Mapping using GIS & Hydropower Model in Karnali, Mahakali and West Rapti basins, M. Sc. Thesis, Institute of Engineering, Department of Civil Engineering, M. Sc. Program in Water Resources Engineering. Pulchowk Campus, 2009.