© Associated Asia Research Foundation (AARF)
A Monthly Double-Blind Peer Reviewed Refereed Open Access International e-Journal - Included in the International Serial Directories. Page | 502
A STUDY ON INVENTORY MANAGEMENT OF TATA MOTORS
R. Kanchana
Assistant Professor, Head of the Department B.Com. PA, KG College of Arts and Science,Coimbatore – 641035.
ABSTRACT
In the study contain the Inventory management of the Tata motors Limited. To know about the
raw materials of the company for the last five years. The data’s are to be collected from the
secondary. This analysis to know about the stock levels under EOQ method. Finally shows the
company economic order quantity of the stock levels for the last five years (2012-2016).
Keywords: Inventory Management, Economic Order Quantity
Introduction
A term inventory refers to the stock file of the products a firm is offering for sale
and the components that make up the product. In other words, inventory is composed of assets
that will be showed in future in the normal course of the business operations. The assets which
firms store as inventory in anticipation of need are:
Raw materials
Work in process (Semi Finished goods) Finished goods
International Research Journal of Management and Commerce
ISSN: (2348-9766) Impact Factor- 5.564, Volume 5, Issue 4, April 2018
Website- www.aarf.asia, Email : editor@aarf.asia , editoraarf@gmail.com
© Associated Asia Research Foundation (AARF)
A Monthly Double-Blind Peer Reviewed Refereed Open Access International e-Journal - Included in the International Serial Directories. Page | 503 The raw material inventory contains item that are purchased by the firm from other and are
converted into finished goods through the manufacturing (production) process. They are an
important input of the final product. The working process inventory consists of items currently
being used in the production process.
Review of the literature
1. Prem Virat(27) highlights the importance of increasing materials productivity in Indian
industries.
2. Ravindra Kumar(28) describes materials management as a truly creative, productive and
profit centre
3. Renuka Raja Gopalan(29) stresses the importance of productivity through efficient
materials management in manufacturing enterprises.
4. Suresh Krishna(30) advocates the need for professionalism in materials management to
achieve the organizational goals.
5. Krishna Swamy(31) emphasises the need for maintaining good vendor relations.
Objective of the Study
To Analyze and measure economic order quantity for the selected raw material items.
Research Methodology
The data has been gathered through interaction and discussions with the executives working in
the division. Some important information has been gathered through couple of unstructured
interviews of executive. Annual reports and other magazines published by the company are used
for collecting the required information.
DATA COLLETION METHOD:
© Associated Asia Research Foundation (AARF)
A Monthly Double-Blind Peer Reviewed Refereed Open Access International e-Journal - Included in the International Serial Directories. Page | 504
PRIMARY DATA
The information collected under “primary data” is mainly based on TATA MOTORS
analysis. A structured questionnaire is used to collect the primary data.
SECONDARY DATA
The secondary data was obtained through the dealers, sales record, and internet also
from various books and journals.
Analysis of the Study
ECONOMIC ORDER QUANTITY:
EOQ= 𝟐𝑨𝑩
𝑪𝑺 or 𝟐𝑨𝑶
𝑪
Where, A=Annual Consumption
B or O = Ordering Cost
C = Carrying cost
S = Storage Cost
ECONOMIC ORDER QUANTITY:
EOQ = 𝟐𝑨𝑶
𝑪 Where, A=Annual Consumption
O = Ordering Cost
© Associated Asia Research Foundation (AARF)
A Monthly Double-Blind Peer Reviewed Refereed Open Access International e-Journal - Included in the International Serial Directories. Page | 505
During 2012-13:
The firm requires below given units of raw material for manufacturing. The following are the
details of their operation during 2012-13.
PARTICULARS
RAW MATERIAL 33168.73
Ordering Cost Per Order 3500
Carrying Cost 10 %
Purchase Price Per Unit 550
Calculation of EOQ:-
Total units required (A) =33168.73
The ordering cost per order (O) = Rs.3500
Carrying cost per unit (C) = 10%
(i.e.) 10% of Rs.550 =Rs.55
EOQ =√2AO/C
= 2 ∗ 33168.73 ∗ 3500 / 55
© Associated Asia Research Foundation (AARF)
A Monthly Double-Blind Peer Reviewed Refereed Open Access International e-Journal - Included in the International Serial Directories. Page | 506
During 2013-14:
The firm requires below given units of raw material for manufacturing. The following are the
details of their operation during 2013-14.
PARTICULARS
RAW
MATERIAL
25542.69
Ordering Cost Per Order
4000
Carrying Cost 10 %
Purchase Price Per Unit
600
Calculation of EOQ:-
Total units required (A) =25542.69
The ordering cost per order (O) = Rs.4000
Carrying cost per unit (C) = 10%
(i.e.) 10% of Rs.600 =Rs.60
EOQ =√2AO/C
= 2 ∗ 25542.69 ∗ 4000 /60
© Associated Asia Research Foundation (AARF)
A Monthly Double-Blind Peer Reviewed Refereed Open Access International e-Journal - Included in the International Serial Directories. Page | 507
During 2014-15:
The firm requires below given units of raw material for manufacturing. The following are the
details of their operation during 2014-15.
PARTICULARS
RAW MATERIAL 27920.47
Ordering Cost Per Order 4500
Carrying Cost 10 %
Purchase Price Per Unit 650
1.Calculation of EOQ:-
Total units required (A) =27920.47
The ordering cost per order (O) = Rs.4500
Carrying cost per unit (C) = 10%
(i.e.) 10% of Rs.650 =Rs.65
EOQ =√2AO/C
= 2 ∗ 27920.47 ∗ 4500 /65
© Associated Asia Research Foundation (AARF)
A Monthly Double-Blind Peer Reviewed Refereed Open Access International e-Journal - Included in the International Serial Directories. Page | 508
During 2015-16:
The firm requires below given units of raw material for manufacturing. The following are the
details of their operation during 2015-16.
PARTICULARS
RAW MATERIAL 29099.37
Ordering Cost Per Order 5000
Carrying Cost 10 %
Purchase Price Per Unit 700
1.Calculation of EOQ:-
Total units required (A) =29099.37
The ordering cost per order (O) = Rs.5000
Carrying cost per unit (C) = 10%
(i.e.) 10% of Rs.700 =Rs.70
EOQ =√2AO/C
= 2 ∗ 29099.37 ∗ 5000 /70
© Associated Asia Research Foundation (AARF)
A Monthly Double-Blind Peer Reviewed Refereed Open Access International e-Journal - Included in the International Serial Directories. Page | 509
During 2016-17:
The firm requires below given units of raw material for manufacturing. The following are the
details of their operation during 2016-17.
PARTICULARS
RAW MATERIAL 31600.37
Ordering Cost Per Order 5500
Carrying Cost 10 %
Purchase Price Per Unit 750
1.Calculation of EOQ:-
Total units required (A) =31600.37
The ordering cost per order (O) = Rs.5500
Carrying cost per unit (C) = 10%
(i.e.) 10% of Rs.750 =Rs.75
EOQ =√2AO/C
= 2 ∗ 31600.37 ∗ 5500 /75
© Associated Asia Research Foundation (AARF)
[image:9.612.70.489.257.479.2]A Monthly Double-Blind Peer Reviewed Refereed Open Access International e-Journal - Included in the International Serial Directories. Page | 510
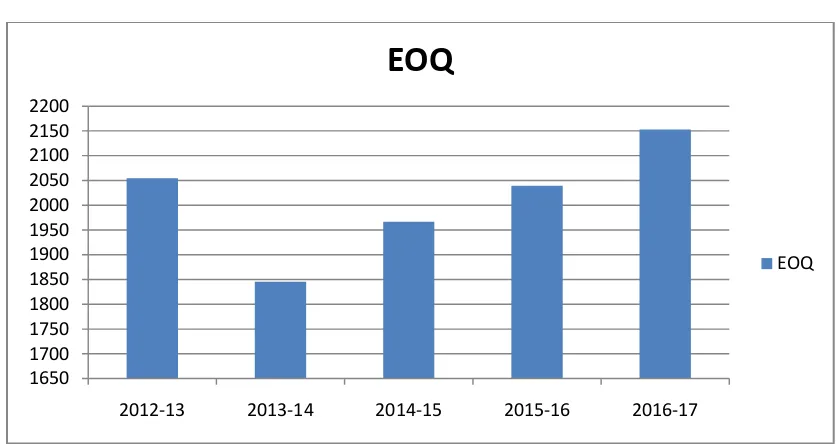
TABLE SHOWING 5 YEARS RESULT OF EOQ:
YEAR EOQ
2012-13 2054.62
2013-14 1845.45
2014-15 1966.19
2015-16 2038.89
2016-17 2152.84
CHART:
INTERPRETATION:
The above graph shows the economic order quantity of the company. In 2013 the
EOQ is 2054.62 which decrease to1845.45 in the year 2014. But increases further and reaches
2152.84 in the year 2017.
Conclusion
Inventory management has to do with keeping accurate records of finished goods
that are ready for shipment. This often means posting the production of newly completed goods 1650
1700 1750 1800 1850 1900 1950 2000 2050 2100 2150 2200
2012-13 2013-14 2014-15 2015-16 2016-17
EOQ
© Associated Asia Research Foundation (AARF)
A Monthly Double-Blind Peer Reviewed Refereed Open Access International e-Journal - Included in the International Serial Directories. Page | 511 to the inventory totals as well as subtracting the most recent shipments of finished goods to
buyers. When the company has a return policy in place, there is usually a sub-category contained
in the finished goods inventory to account for any returned goods that are reclassified or second
grade quality. Accurately maintaining figures on the finished goods inventory makes it possible
to quickly convey information to sales personnel as to what is available and ready for shipment
at any given time.
References
1. Financial Management ………. I.M. Pandey
2. Financial Management ………. Prasanna Chandra
Website:
1. WWW.tatamotors.COM