Citation:
Woodward, J and Seims, A and White, J and Bunyan, A-M and O’Dwyer, L (2018) Wise Up To Cancer - can it make a difference? Project Report. Yorkshire Cancer Research.
Link to Leeds Beckett Repository record: http://eprints.leedsbeckett.ac.uk/5618/
Document Version: Monograph
The aim of the Leeds Beckett Repository is to provide open access to our research, as required by funder policies and permitted by publishers and copyright law.
The Leeds Beckett repository holds a wide range of publications, each of which has been checked for copyright and the relevant embargo period has been applied by the Research Services team.
We operate on a standard take-down policy. If you are the author or publisher of an output and you would like it removed from the repository, please contact us and we will investigate on a case-by-case basis.
Wise Up To Cancer
- can it make a difference?
The final report on Wise Up To Cancer, a pilot community
health initiative to improve cancer outcomes in Yorkshire
Conducted by Health Together, Leeds Beckett University
Amanda Seims
Jenny Woodward
Judy White
Ann-Marie Bunyan
Leonie O’Dwyer
Table of Contents
Acknowledgements 1
1. The Wise Up To Cancer Initiative 2
2. The evaluation 3
2.1 Questionnaire data collection 3
2.2 Qualitative data collection 3
2.3 Evaluation challenges 4
3. Delivery of the initiative 5
3.1 Location of delivery 5
3.2 The staff 5
3.3 Uptake of WUTC 5
3.4 Recruitment to follow-up 5
3.4.1 Prize draw 6
4. Questionnaire findings 7
4.1 Participants 7
4.2 Lifestyle behaviours 7
4.2.1 Weight and diet 7
4.2.2 Physical activity 9
4.2.3 Alcohol consumption 10
4.2.4 Tobacco use 11
4.2.5 Other goals 12
4.2.6 Barriers to lifestyle changes 12
4.2.7 Summary 13
4.3 Assessment of cancer awareness and encouraging early diagnosis 13 4.3.1 Reasons for not contacting a GP about signs and symptoms 14
4.3.2 Summary 14
4.4 Engagement with cancer screening 14
4.4.1 Barriers to engaging with screening 15
4.4.2 Summary 15
4.5 Perceived learning from WUTC 15
4.6 Intervention feedback 17
5. Interview and focus group findings 19
5.1 Feedback from the people who had received the WUTC intervention 19
5.2 Feedback from the Pharmacy Champions 20
5.3 Feedback from the Community Health Educators (CHEs) delivering the initiative 22
5.4 Pharmacy Manager feedback 24
5.5 Community Manager feedback 25
5.6 Summary 26
6. Yorkshire Cancer Research communications outputs 27
6.1 Wise Up To Cancer launches 27
6.2 Media activity 27
6.3 Website and social media activity 27
6.4 Keeping in touch with Yorkshire Cancer Research 27
7. Summary and recommendations 28
7.1 Summary 28
7.2 Meeting the aims 28
7.3 Success factors 29
Tables
Table 1. Interview and focus group participants 4
Table 2. Recruitment to follow-up and engagement 6
Table 3. Participant sex and age across the two settings 7
Table 4. Reported prevalence of obesity vs. estimated for the local areas 8 Table 5. Dietary habits of men and women participating in WUTC 8 Table 6. Progress of participants who had set a weight and/diet goal 9 Table 7. Progress of participants who had set a physical activity goal 10 Table 8. Progress of participants who had set an alcohol consumption goal 11 Table 9. Progress of participants who had set a tobacco use goal 12 Table 10. Overview of eligibility and engagement with screening at baseline and follow-up 15
Table 11. Website page views 27
Table 12. Yorkshire Cancer Research social media activity 27
Table 13. Project aims and measures of achievement 30
Figures
Figure 1. Number of WUTC participants completing the pilot 6
Figure 2. Percentage breakdown of BMI category by sex 7
Figure 3a. Percentage breakdown of red and processed meat consumption (portions per week) by
sex 8
Figure 3b. Percentage breakdown of wholegrains consumption (portions per week) by sex 8 Figure 3c. Percentage breakdown of and fruit and veg consumption (portions per week) by sex 8 Figure 4. Percentage breakdown of number of days in week where 30 minutes of physical activity
completed by sex 10
Figure 5a. Percentage breakdown of alcohol consumption by sex 11 Figure 5b. Percentage breakdown of number of units of alcohol consumed on each occasion by sex 11 Figure 5c. Percentage breakdown of frequency of binge drinking (6 or more units on one occasion)
by sex 11
Figure 6. Percentage breakdown of smoking status by sex 12
Thank you to all the people who contributed to Wise Up To Cancer, from its inception, through its delivery, and to the final evaluation. The following people were particularly important in this process.
Yorkshire Cancer Research
• Kathryn Scott (Chief Executive)
• Stuart Griffiths (Director of Research and Services) • Lisa Trickett (Community Health Initiatives Manager) • Charles Rowett (previous Chief Executive)
Community Pharmacy West Yorkshire
• Ruth Buchan (CEO)
• Lisa Wheater (Pharmacy Champion Co-ordinator) • Nigel Hughes (Head of Public Health and Engagement) • All the WUTC Champions in participating pharmacies.
Barca
• Joe Kent (Assistant Operations Director - Health, Wellbeing & Adults) • Emma Richardson (Community Health Educator Co-ordinator) • Louise Padgett (previous Community Health Educator Co-ordinator) • All the Community Health Educators (CHEs)
Leeds Beckett University
1. The Wise Up To Cancer Initiative
Wise Up To Cancer (WUTC) is a Community Health Initiative funded by Yorkshire Cancer Research, with the intention to assess whether this type of initiative could contribute to the charity’s regional strategy of improving cancer outcomes and its 10-year goal of achieving 2,000 fewer deaths from cancer every year by 2025. The initiative set out the following aims:Primary aims
• A decrease in behaviours associated with cancer risk (e.g. smoking/obesity/inactivity).
• An increase in awareness of cancer signs and symptoms.
• An increase in the number of people taking part in the national screening programmes.
• An increase in signposting to other services (GP/ smoking cessation/weight management programme/ other services available).
Secondary aim
• Increase awareness of Yorkshire Cancer Research. WUTC was piloted in communities in Leeds (largely in the west) and through pharmacies in the Wakefield District. These areas were chosen due to their high levels of deprivation and low screening uptake, high smoking prevalence and obesity levels and/or high Black, Asian and minority ethnic (BAME) populations. It was primarily aimed at people in the age groups eligible for the three national screening programmes (cervical, breast and bowel) and at anyone at a higher risk due to smoking or being overweight.
Members of the public who met the criteria were offered an assessment undertaken by a Community Health Educator (CHE) or a member of the Pharmacy team (a Pharmacy Champion). This took 15 to 30 minutes and consisted of talking through their lifestyle risk factors, assessing their knowledge of cancer signs and symptoms, recognising any current cancer signs and symptoms they are experiencing and identifying cancer screening programmes they are eligible for.
People were offered information relating to lifestyle and screening, signposted to health promoting activities or services and encouraged to commit to personal goals to make changes as appropriate. Thus WUTC was a targeted and personalised assessment which provided people with guidance about what they could do and the information they needed to be able to act on their goals. The target was to reach 2,000 people (1,000 in each setting) by the end of 2017.
CHEs are non-clinical local people who are trained to have ‘healthy conversations’ with members of the public. They are part of a long-standing team managed by Barca, a community organisation based in Armley,
west Leeds. They work with partner agencies to reach people at drop-ins, community venues and events. In participating pharmacies at least two members of staff, who were already qualified to have ‘healthy conversations,’ were trained to become Pharmacy Champions and they were supported by Community Pharmacy West Yorkshire (CPWY). Both CHEs and Pharmacy Champions received specific training in WUTC.
Yorkshire Cancer Research produced a range of leaflets and a website to support the initiative: (www.
yorkshirecancerresearch.org.uk/wiseuptocancer/).
This report was written in December 2017. In Leeds the initiative had been operational for nine months and been delivered in 34 different settings. In Wakefield the initiative had operated for eight months, CPWY have trained staff in 12 pharmacies, ten of which are actively delivering (see appendix 7 for full lists).
Data collection for the evaluation ended in
2. The evaluation
The evaluation combined quantitative and qualitative data collection methods, in order to assess to what extent the stated aims were being achieved whilst also gathering views on WUTC in order to understand what was/was not working. Throughout the implementation period monthly data reports were produced and a detailed interim report was produced three months into the initiative. The evaluation was conducted by a small team at Leeds Beckett University and received ethics approval by the University.
2.1 Questionnaire data collection
A critical part of this project is that the baseline WUTC questionnaire (appendix 1) fulfilled two functions – it both guided the conversation about cancer (with prompts for the CHEs and Pharmacy Champions delivering the initiative) and acted as the questionnaire through which baseline data was collected. This integration aimed to make the interaction smoother and avoid duplication.
The baseline questionnaire identified and recorded people’s current lifestyle behaviours; knowledge of cancer signs and symptoms; experience of cancer signs and symptoms; and awareness of and engagement with, national screening programmes. Since it was anticipated that not everyone would agree to take part in the follow-up, this questionnaire also recorded perceived change in awareness of cancer signs and symptoms, likelihood of discussing any symptoms with a GP and whether they intended to make any behaviour changes as a result of the initiative.
Participants were asked, at the end of the initial assessment, if they consented to a follow-up questionnaire – with a prize draw as an incentive. If they consented, a follow-up questionnaire (appendix 2) was sent to them six to eight weeks later to assess progress towards goals.1 Importantly the follow-up
questionnaire was personalised to the participants’ baseline data i.e. it used their first name, reminded them of the date and location where they completed WUTC and only asked questions about goals they had actually set, thus keeping the questionnaire short. Where relevant, participants were asked whether they had taken steps to:
1. change a lifestyle behaviour
2. speak to their GP about any cancer signs and symptoms they had identified in WUTC
3. complete any cancer screening that they were eligible for.
Participants were also asked for feedback on the initiative. These topics were assessed using both
multiple choice questions (e.g. lists of pre-set responses to state what action has been taken to work towards their goal) and open-ended questions to record further detail (for example to find out how lifestyle changes made them feel or what difficulties they had faced when trying to achieve their goals).
Making changes in behaviour is challenging, and expectations about what can be achieved through a short intervention like WUTC, within a relatively short time-frame, need to be realistic. The follow-up questionnaire therefore asked questions which
identified the actions people had taken to work towards their goal.
The Stages of Change model (Prochaska and
DiClemiente 1983, appendix 3) is helpful as it illustrates how people move through various stages in the process of making change described as pre-contemplation (before thinking of doing anything); contemplation (thinking about making a change); preparation (getting ready to make a change); taking action and finally maintenance of that change. Relapse is possible at any point – so people may exit this cycle of change but also re-enter it at any point and on numerous occasions before the change they are making becomes habitual. In assessing the effectiveness of WUTC, it is therefore important to recognise that a step towards change (e.g. a commitment to act) is part of the process and a measure of success as it signifies a step in the right direction. Similarly, progress made may be reversed at a later date.
2.2 Qualitative data collection
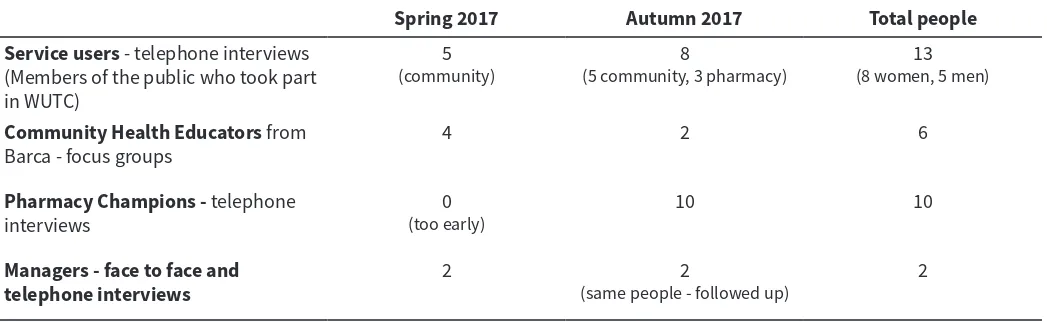
Interviews and focus groups were conducted with a range of stakeholders in order to ascertain their opinion of the intervention and capture more in-depth feedback on whether/how it worked. As can be seen in Table 1 initial data collection took place in the spring, in order to feed into the interim report (May 2017). Further data collection took place in the autumn, when the initiative was more established.
Service users were recruited via the follow-up questionnaire to take part in a telephone interview - they were offered a thank you of £20 of shopping vouchers. The intention was to interview ten people who had received the intervention in the community (with CHEs) and ten who had participated in a
pharmacy. However only three of the latter took part, partly due to lower levels of follow-up in pharmacies (see later).
Table 1. Interview and focus group participants
Spring 2017 Autumn 2017 Total people
Service users - telephone interviews (Members of the public who took part in WUTC)
5
(community) (5 community, 3 pharmacy)8 (8 women, 5 men)13
Community Health Educators from
Barca - focus groups 4 2 6
Pharmacy Champions - telephone
interviews (too early)0 10 10
Managers - face to face and
telephone interviews 2 (same people - followed up)2 2
2.3 Evaluation challenges
WUTC was a new and novel initiative and the process of developing it has resulted in many learnings for the delivery and evaluation teams. Key challenges are listed below:
• WUTC only engages with people for a short time and on one occasion. It would have been impractical and disproportionate to expect people to complete a baseline questionnaire separate from, and in addition to, the assessment itself. Having a tool which worked for both purposes (assessment and evaluation) was considered better, both for the person receiving WUTC and those delivering it. Producing this however was challenging and took a great deal of negotiation, hard work and goodwill on the part of all involved.
• The intervention required sophisticated use of survey software (SNAP). For example, the follow-up questionnaire needed to just contain information and questions relevant to the person’s responses in the original baseline questionnaire. This needed to be done automatically due to the high numbers involved. In addition, community venues often did not have Wi-Fi so there needed to be a way therefore of collecting data and downloading this later.
Resolving these issues was technically challenging but was successfully accomplished in time for the start of the project. This process of learning and development relied on having a member of staff capable of using the SNAP software to an advanced level.
• Pharmacies can only record patient data on their own database (PharmOutcomes) meaning they could not complete the online Snap Survey questionnaire. Depending on whether or not there was a computer in the consulting room, WUTC Champions used a paper version of the baseline questionnaire and later inputted data into PharmOutcomes. Anonymised data were then emailed from PharmOutcomes to Leeds Beckett University’s researchers as an Excel file. As the format and order of data was inconsistent with that collected through Snap Surveys it required extensive editing using a sequence of macros that
was developed. PharmOutcomes could only email patient contact details for follow-up to an NHS email account. Receiving permission to set up this account took until three months into the project.
• CHEs and Pharmacy Champions had to take on board a great deal of information and learn new technical skills for WUTC. Unsurprisingly therefore, in the early phase of the project data collection mistakes occurred. Whilst these became less
frequent as the initiative progressed, small errors still remained particularly when paper questionnaires were used. Cleaning the data was therefore required throughout.
3. Delivery of the initiative
3.1 Location of delivery
WUTC was delivered in two areas – Leeds (primarily the west) by Barca Leeds and in Wakefield by Community Pharmacy West Yorkshire (CPWY).
Barca Leeds is based in Bramley but also works in Armley, Kirkstall and Hyde Park. These areas make up three of the nine most underprivileged wards in the City of Leeds. Ethnicity is predominantly White British with a significant proportion of Eastern European people in Bramley, Armley and Kirkstall. In Hyde Park there is also a substantial proportion of South East Asian families. Large parts of these areas have social housing and the residents are affected by issues surrounding unemployment and/or low income. There are also higher than national averages in substance misuse, domestic violence, mental health and general health issues with low screening uptakes and high rates of smoking and alcohol use.
The areas are served by small town centres with shops/shopping centres with supermarkets and good local transport links. There are ‘One Stops’ in public buildings such as libraries providing advice on housing and welfare.
WUTC was delivered in west Leeds at 34 community venues on 64 occasions. Venues varied widely and included community groups, community centres, within the workplace, local events in parks and shopping centres (appendix 4). Whilst some venues mainly attracted people from the targeted area, the use of other venues e.g. workplaces, Headingley Stadium and popular festivals attracted people from a wider geographical area, although most participants were from the Yorkshire region (appendix 5).
In Wakefield, ten pharmacies were selected to be part of WUTC, from the 19 which applied. These are located in high areas of deprivation, with high smoking rates and where cervical, breast and bowel screening uptake is below the national average (as determined by the WUTC project group). The population covered by these pharmacies is mainly White British.
Pharmacies were asked to express an interest in delivering the WUTC pilot. They were selected based on the following criteria; willingness to put forward at least two members of the team to become Pharmacy Champions, previous good delivery of services (such as flu and blood pressure monitoring) and their response as to why the pharmacy should be selected for the project.
There were some changes to the pharmacies involved during the pilot – two withdrew (one in June and one in December), whilst two others joined in August (appendix 6). Similar to the community settings, the geographical location of participants deviated from the
target area although participants were mostly from the Wakefield area and wider Yorkshire region (appendix 5). On four occasions individuals completed the baseline questionnaire twice (on different days). In order to ensure validity, these were removed from the dataset.
3.2 The staff
Seven CHEs delivered WUTC in community settings. These comprised of two men and five women, with an age range from 20 to 50 years. Ethnicity was diverse, including White British, Asian and Black African. Across the pharmacies that delivered WUTC, 47 staff (a mix of Pharmacists, Pharmacy Managers, Dispensing Assistants and Counter Staff) received training from the pharmacy co-ordinator. Five of these were male, with an age range from early 20s to mid-50s. Ethnicity was predominantly White British, reflecting the ethnic population of the area.
3.3 Uptake of WUTC
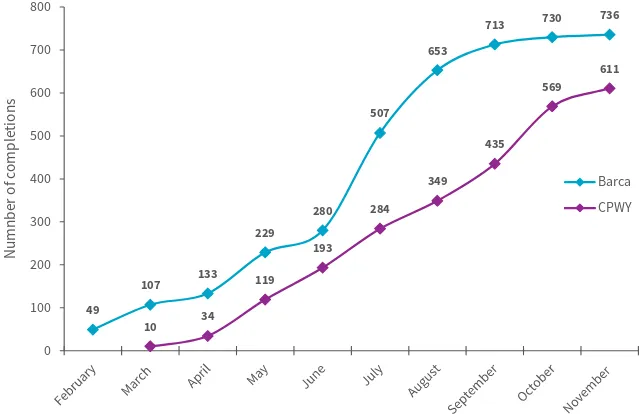
In community settings uptake increased during the summer months (Figure 1), mainly due to large events at Kirkstall Festival and at Headingley Stadium. Uptake was slower after the summer, due to staff turnover, illness, a lack of large events to attend and poor weather making outside locations less favourable places to converse. In pharmacies, WUTC started a month later with a fairly linear uptake over the pilot period.
3.4 Recruitment to follow-up
Out of the 1,347 participants, 931 (69%) agreed to receive the follow-up questionnaire (Table 2). Recruitment to follow-up was lower within pharmacies compared to community settings (48.1% vs 86.5% of participants). 576 (62%) of those who consented to follow-up opted to receive an email, the remainder opting for post. This was higher in community settings (70.5% of those who agreed to follow-up provided an email address) compared to the pharmacy setting (43.2% equivalent figure). The reasons for these differences are not entirely clear but are discussed in the qualitative findings later on.
As of 14th Nov 2017, 763 follow-up questionnaires had been sent (as the 6-8 week time period had been reached) and out of those, 168 (22%) had been completed (Table 2) with a similar response rate across the delivery settings. The response rate was greater via the electronic method which can be attributed to the email reminders sent (Table 2).
Figure 1. Number of WUTC participants completing the pilot
Table 2. Recruitment to follow-up and engagement
All settings Barca Pharmacy Baseline
Participated as of 14th Nov 1,347 736 611
Consented to follow-up (% of participants) 931 (69.1) 637 (86.5) 294 (48.1) Consented to providing email (% of all consenting to follow-up) 576 (61.9) 449 (70.5) 127 (43.2) Incorrect/insufficient follow-up details (% of those consenting) 27 (2.9)
Follow-up
Sent follow-up as of 14th Nov 763 566 197.0
Withdrew from follow-up (% of those sent) 3 (0.4)
Completed follow-up (% of those sent) 168 (22.0) 125 (22.1) 43 (21.8) Paper follow-ups completed (% of sent by paper) 40 (14.7)
E-mailed follow-ups completed (% of e-mailed) 128 (26.1) Completed after 1 Snap email (%) 60 (46.9) Completed after 2 Snap emails (%) 43 (33.6) Completed after a further direct email (%) 25 (19.5)
49
107 133 229
280 507
653
713 730 736
10 34 119
193 284
349 435
569 611
0 100 200 300 400 500 600 700 800
N
um
nb
er
o
f c
om
plet
io
ns
Barca CPWY
3.4.1 Prize draw
Participant ID numbers of all those who completed the follow-up questionnaire and consented to be included in the prize draw were entered into an online random number generator.2
Eight numbers were selected by the tool (1 x £100 voucher, 2 x £50 voucher and 5 x £20 voucher) and the vouchers were sent in the post via recorded delivery.
[image:10.595.58.557.299.552.2]4. Questionnaire findings
A summary of key findings at baseline and follow-up are presented in this section - a detailed analysis of all data collected at baseline and follow-up can be found in appendices 7 and 8. All baseline data covers the period up to 14th November 2017.
4.1 Participants
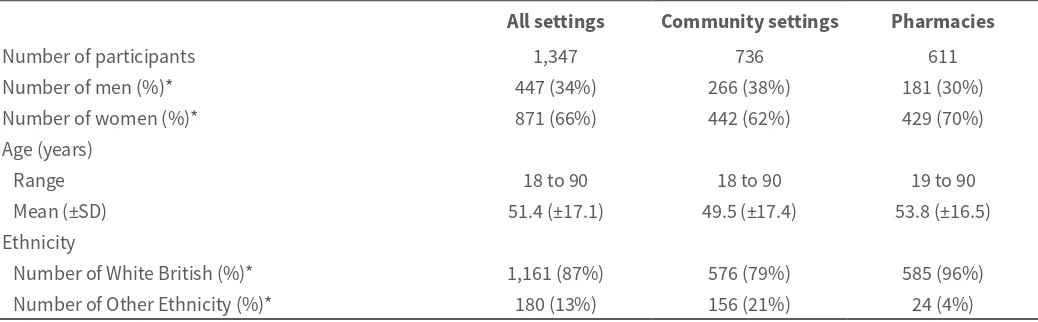
A total of 1,347 people completed the initiative (736 through community settings and 611 through pharmacies). Of the 1,318 who provided their gender, the balance was 34% men and 66% women (Table 3). Ethnicity was provided by 1,341 people and was predominantly White British (87%). Age was provided by 1,339 people and was slightly older for men than women (55 years vs. 51 years).
Criteria for participation included eligibility for screening – therefore a higher proportion of women, particularly younger women, is to be expected as they are eligible from 25 years (for cervical screening) whereas men are only eligible from 60 years (for bowel screening). However, men (particularly in the areas targeted) are more likely to engage in unhealthy lifestyle behaviours (e.g. smoking or being overweight) which would also make them eligible for participation and men aged over 50 who have had a persistent cough are eligible for a chest x-ray.
The type of participants completing WUTC was somewhat different between the two settings, with west Leeds community settings engaging a greater proportion of men, slightly younger participants, and more ethnically diverse participants compared to pharmacies (Table 3).
4.2 Lifestyle behaviours
Out of all the respondents who completed the baseline questionnaire, 948 (70%) set at least one lifestyle-related goal, though it was possible to set more than this:
• 704 people (52% of all participants) set a weight management/diet goal
• 418 people (31% of all participants) set a physical activity goal
• 93 people (7% of all participants) set a goal to reduce or abstain from alcohol
• 166 people (12% of all participants) set a goal to reduce or stop tobacco use
• 29 people (2% of all participants) set a specific ‘other’ lifestyle-related goal.
471 of those people (50%) were signposted to a support service.
In the follow up questionnaire it was revealed that a further nine (female) participants, who had not set a goal at baseline later decided to make lifestyle changes. These mainly related to fitness, weight loss and/or eating more healthily but also included seeking medical advice, attending breast cancer screenings and using adequate sun protection.
4.2.1 Weight and diet Baseline
Prevalence of unhealthy weight and diet
[image:11.595.306.554.449.583.2]Self-reported, or measured, height and weight data were obtained from 995 people (74% of all participants) which included 359 men (80%) and 636 women (73%). Of those, over half had a BMI that was above a normal or healthy weight (Figure 2) which was more common among men [240 men (67% of those measured) vs. 386 women (61%)].
Table 3. Participant sex and age across the two settings
All settings Community settings Pharmacies
Number of participants 1,347 736 611
Number of men (%)* 447 (34%) 266 (38%) 181 (30%)
Number of women (%)* 871 (66%) 442 (62%) 429 (70%) Age (years)
Range 18 to 90 18 to 90 19 to 90
Mean (±SD) 51.4 (±17.1) 49.5 (±17.4) 53.8 (±16.5) Ethnicity
[image:11.595.39.558.633.794.2]Number of White British (%)* 1,161 (87%) 576 (79%) 585 (96%) Number of Other Ethnicity (%)* 180 (13%) 156 (21%) 24 (4%) * Percentage of those who provided the information
Figure 2. Percentage breakdown of BMI category by sex 1.1%
32.0%
39.8% 27.0%
Males
Underweight Normal or Healthy Weight Overweight Obese
1.1%
32.0%
39.8% 27.0%
Male
1.3%
38.1%
30.7% 30.0%
Of the 1,333 respondents to the question ‘Are you a healthy weight at the moment?’ 629 (47%) said they were and this belief was more common among men than women (55% of male respondents vs. 43% of female respondents). Of the 470 people (188 men and 282 women) who thought they were a healthy weight and also provided height and weight data, over half had a BMI that was overweight or obese. This was more prevalent amongst men (50% vs. 33% of women). Of interest, is that overweight was more prevalent among those completing WUTC through pharmacies in Wakefield (67% vs. 61%). Similarly, obesity was more common in pharmacies, however in both settings, prevalence was higher than the estimated proportions of obese adults across those areas (Table 4) (PHE, Cancer in Yorkshire and the Humber 2016 report).
Table 4. Reported prevalence of obesity vs.
estimated for the local areas
Obese (%) Community settings 26.4 Estimated for Leeds 19.5 to 22.6
Pharmacies 33.7
Estimated for Wakefield 22.6 to 25.7
Figure 3a. Percentage breakdown of red and processed meat consumption (portions per week) by sex
54% 28%
12%
5% 1%
Male
61% 28%
6% 6%
Female
54% 28%
12%
5% 1%
Male
1 to 2 3 to 4 5 to 6 7 to 8 9+
[image:12.595.38.290.290.389.2]People ate red meat on average 2.5 times a week, ranging from 0 times to 17. Wholegrains were eaten on average 4.8 times a week (therefore not every day), whilst on average 3.6 portions of fruit and vegetables were eaten a day (less than the recommended five a day) (Table 5), although 452 people (34%) ate five or more portions per day. Some people did not eat any wholegrains or fruit and vegetables. Women tended to eat less red meat and more fruit and vegetables but their wholegrain consumption was similar to men’s. Consumption of fruit and vegetables and wholegrains was generally similar between community settings and pharmacies, however red meat consumption was typically greater within participants recruited through pharmacies (3 vs. 2 portions).
Table 5. Dietary habits of men and women participating in WUTC
All participants Men Women
Red meat (portions per week)
Range 0 to 17 0 to 14 0 to 17
Mean (±SD) 2.5 (2.0) 2.8 (±2.1) 2.4 (±1.9)
Wholegrains (portions per week)
Range 0 to 32 0 to 15 0 to 32
Mean (±SD) 4.8 (±2.9) 5.0 (±2.9) 4.7 (±2.9)
Fruit and veg (portions per day)
Range 0 to 12 0 to 10 0 to 12
Mean (±SD) 3.6 (±2.1) 3.3 (±2.0) 3.7 (±2.1) Figure 3b. Percentage breakdown of wholegrains
consumption (portions per week) by sex 32%
17% 48%
2% 1%
Male
35%
19% 44%
1% 1%Female
35%
19% 44%
1% 1%
Female
1 to 3 4 to 6 7 to 9 10 to 12 13+
37%
34% 21%
7%
2%
Male
30%
34% 26%
9% 2% Female
Figure 3c. Percentage breakdown of and fruit and veg consumption (portions per day) by sex
30%
34% 26%
9%
2%
Females
1 to 2 3 to 4 5 to 6 7 to 8 9+
37%
34% 21%
7%
2%
Male
30%
34% 26%
[image:12.595.37.572.635.797.2]Goals set
A total of 704 people (52% of participants) set a goal to either specifically reduce their weight and/or to eat a healthier diet which may help to reduce weight, with 201 of these people (29%) setting both goals. Of the 642 people who had been classed as overweight or obese (BMI>24.9), 424 (66%) had set one or both goals (including 133 men and 279 women). However, whilst men were more likely to be overweight they were less likely to set a goal relating to weight and diet (72% of overweight women set a goal compared to 55% of overweight men).
Signposting to services
Of the 704 people setting a goal, 300 (43%) were signposted to weight management services, which was a similar proportion for men and women. Of the 424 overweight or obese people who had set a goal, 209 (49%) were signposted. Signposting of overweight women was slightly greater than for overweight men, with around 50% of overweight women setting goals being signposted to services (vs. 46% of overweight men setting goals).
Follow-up
Progress with weight and diet goals
104 of those who had initially set a weight and/diet goal, engaged in the follow-up, although only 97 of those answered the progress question. Of those, 88 (91%) had taken positive action (Table 6), with many losing weight, making positive changes to their diet and increasing physical activity.
Six of these people had contacted weight management services – one of these felt ‘More confident in managing my weight and diet following appointment with
dietician.’
Impact of changes
Some respondents stated that weight loss and changes to their diet had made them feel better:
[image:13.595.39.560.67.219.2]‘[I find it] a little easier to move around, I have more energy and have a slimmer waistline.’
Table 6. Progress of participants who had set a weight and/diet goal
Weight and/diet related goal
Set a goal at baseline 704
Completed follow-up(*) 104 (15%)
Answered follow-up question 97
Taken positive action (†) 88 (91%)
Lost weight (†) 37 (38%)
Trying to be more active in everyday life (†) 56 (58%) Eating more fruit and vegetables (†) 53 (54%)
Eating more wholegrains (†) 34 (35%)
Not taken any action (†) 9 (9%)
* % of those setting a goal
† % of those answering the follow-up question
‘[It] has helped lower my back pain so less painkillers needed. Better bowel movements because of new diet and less medication.’
‘I lost 2 kg. Just feel proud of myself.’
For one woman, changing her eating habits resulted in her having ‘More energy, so picking my boys up from school I don't mind staying at the park playing ball/ tennis with them.’
One other person commented, ‘Although the changes I have made are small it has without a doubt helped me become more aware of what items I choose to cook with and buy from the supermarket. I feel slightly more confident in my ability to make bigger changes with time.’
4.2.2 Physical activity Baseline
Prevalence of inactive lifestyle
On average, both men and women stated they were physically active (completing at least 30 minutes of exercise/activity) for four days per week, below the UK guidelines (five days per week). 49% of males and 51% of females completed 30 minutes of exercise on less than five days per week. Completion of 30 minutes of exercise on less than five days per week was more common among pharmacy participants in Wakefield (56% vs. 44% for community participants).
Goals set
In total, 418 people (31% of all participants) set a goal to increase their physical activity. This was slightly more common among women (33% of those women vs. 27% of those men), which is positive considering that women were slightly less active.
Signposting to services
Of the 418 people setting a physical activity goal, 206 (49%) were signposted to physical activity services, which was similar among both men and women. Of the 273 people classed as inactive who set a goal, 135 (50%) were signposted to a service which was similar among both men and women.
Follow-up
Progress with physical activity goal
66 of those who had initially set a physical activity goal, engaged in the follow-up and 65 of those answered the progress question. Of those, 56 people (86% of respondents) had made some progress towards achieving their goals (Table 7), with most progress focused around people trying to be more active in their everyday lives (e.g. walking or cycling more or using the stairs instead of lifts). Five of those people had contacted local physical activity services.
Impact of changes
Many commented that they had more energy and/or felt less tired.
‘[I have increased] my gym activity to include more cardio and I feel that I have more energy.’
‘[I am] more mentally alert.’
‘My swimming stamina has increased.’ 13%
7%
11%
10% 8% 12% 3%
36%
Male
13% 5%
10%
13%
10% 10% 2%
38%
Female
13% 7%
11%
10% 8% 12%
3%
36%
Male
[image:14.595.40.283.47.177.2]0 1 2 3 4 5 6 7
Figure 4: Percentage breakdown of number of days in week where 30 minutes of physical activity
completed by sex
Table 7. Progress of participants who had set a physical activity goal
Physical activity goal
Set a goal at baseline 418
Completed follow-up(*) 66 (16%)
Answered follow-up question 65
Taken positive action (†) 56 (86%)
Trying to be more active in everyday life (†) 45 (69%) Attended a supervised physical activity service (†) 12 (18%) Started their own physical activity programme (†) 15 (23%)
Not taken any action (†) 9 (14%)
* % of those setting a goal
† % of those answering the follow-up question
One person expressed a sense of achievement: ‘It's a good feeling walking nearly seventy thousand steps in a week, before I was lucky to get five thousand daily.’
and for another, improving fitness seemed to result in improved confidence and wellbeing: ‘I feel better mentally since beginning to exercise. I don't feel as low in mood and it gives me an opportunity when exercising to be with my own thoughts.’
4.2.3 Alcohol consumption Baseline
Prevalence of alcohol consumption
At baseline, approximately 912 people (68%) stated that they consumed alcohol which included 336 men (75% of all men) and 558 women (64% of all women). Frequency of alcohol consumption was typically higher among men with 21% of male drinkers stating that they drank alcohol four or more times per week (vs. 9% of female drinkers) and men were more likely than women to drink 7+ units on each occasion (30% vs. 22% of male and female drinkers respectively). Almost one quarter of drinkers engaged in binge drinking (6 units or more) at least weekly, with men almost twice as likely as women (32% of male drinkers vs. 19% of female drinkers).
In general, participants completing WUTC through pharmacies consumed alcohol more frequently and in greater quantities compared to those completing in community settings, but were less likely to engage in binge drinking.
Goals set
In total, 93 people (including 41 men and 49 women) set a goal related to alcohol use (10% of all drinkers).
Signposting to services
[image:14.595.35.559.636.781.2]23.8%
23.2% 32.4%
20.5%
Male
35.3%
27.6% 27.8%
9.3%
Female
23.8%
23.2% 32.4%
20.5%
Male
Monthly or less 2-4 times per month
[image:15.595.40.287.41.375.2]2-3 times per week 4 or more times a week
[image:15.595.42.283.395.563.2]Figure 5a: Percentage breakdown of alcohol consumption by sex
Figure 5b: Percentage breakdown of number of units of alcohol consumed on each occasion by sex
Figure 5c: Percentage breakdown of frequency of binge drinking (6 or more units on one occasion) by sex
27.5%
28.1% 14.6%
11.0% 18.8%
Male
1 to 2 3 to 4 5 to 6 7 to 8 9 or more
27.5%
28.1% 14.6%
11.0% 18.8%
Male
31.5%
27.8% 18.5%
8.6% 13.6%
Female
34.1%
20.4% 13.5%
27.5% 4.5%
Male
37.5%
24.4% 19.0%
17.2% 1.8%
Female
34.1%
20.4% 13.5%
27.5%
4.5%
Male
Never Less than monthly Monthly
Weekly Daily or almost daily
Follow-up
Progress with alcohol consumption goal
17 of those who had initially set an alcohol goal, engaged in the follow-up and 16 of those answered the progress question. Of those, 12 people (75% of respondents) had made some progress towards achieving their goals (Table 8), with most reducing their alcohol consumption. One person had contacted and made an appointment with local services.
Impact of changes
One person originally set a goal to ‘stay sober’ and at follow-up they stated that they had since abstained from alcohol. Another commented ‘I didn't really drink that excessively but have cut down having a few glasses of wine during the week. I do feel much better for it.’ 4.2.4 Tobaco use
Baseline
Prevalence of tobacco use
322 people (24%) currently smoked which included 120 men (27% of all men) and 196 women (23% of all women). Men were most likely to smoke on a daily basis (22% vs. 20% of female smokers). Only 45 people (3%) currently used smokeless tobacco and prevalence was similar for men and women.
Prevalence of smoking was somewhat greater among those participants completing WUTC through pharmacies in Wakefield than community settings in Leeds (27% of all participants vs. 19% of all participants). For Leeds, this was similar to the estimated proportions of adult smokers across Leeds (a range of 17 to 20.1%), but prevalence in Wakefield was much greater than the estimated proportions of adult smokers across Wakefield (a range of 20.1% to 23.2%) (PHE, Cancer in Yorkshire and the Humber 2016 report).
Goals set
[image:15.595.36.559.620.749.2]In total, 166 people (49% of both male and female tobacco users) set a goal relating to tobacco use.
Table 8. Progress of participants who had set an alcohol consumption goal
Alcohol consumption goal
Set a goal at baseline 93
Completed follow-up(*) 17 (18%)
Answered follow-up question 16
Taken positive action (†) 12 (75%)
Cut down alcohol consumption(†) 11 (69%)
Given up alcohol (†) 1 (6%)
Not taken any action (†) 4 (25%)
* % of those setting a goal
Signposting to services
Of the 166 people setting a goal, 118 (71%) were signposted to services which included 44 men (73% of those men setting a goal) and 71 women (69% of those women setting a goal).
Follow-up
Progress with tobacco goal
18 people who had initially set a tobacco-related goal completed the follow-up questionnaire and all answered this question. Of those, 13 people (72%) had made some progress towards achieving their goal (Table 9), with over half of all respondents either cutting down or quitting. Two had contacted a support service and one of these people had attended the service.
Impact of changes
One person reported that they previously tended to smoke only ‘When also drinking alcohol/socialising.’
but since the WUTC intervention, this person no longer smoked socially in this way. Another commented ‘[I] can breathe a lot better now I've stopped smoking and started exercising.’
4.2.5 Other goals Baseline
Goals set
At baseline, 29 people (2% of all participants) set a lifestyle goal outside of those suggested within WUTC. Most wanting to improve sleep quantity and quality but other goals set included registering with a GP, using more sun protection, entering employment and staying sober.
Signposting to services
Three people were signposted for support with their ‘other’ lifestyle goals - two to their GP and one to their local job centre.
Follow-up
At follow-up, the three participants who set goals around improving sleep routines report going to bed earlier, or aiming to be in bed by a certain time, and trying to get 7 to 8 hours of sleep. In addition, one person mentions striving to be more organised at home after work by, for example, ‘Making lunch for the next day after having dinner therefore not making it
at midnight.’ Avoiding, or keeping time spent playing
games online to a minimum, was another form of action taken towards this goal.
One person has sought medical advice for ‘familial cancer’ as a step towards achieving better sleep, as
‘My father is suffering due to cancer at the moment for
the third time.’ Another participant, who also set out
to reduce her stress levels, is now eating healthily and doing regular exercise in an effort to achieve this goal.
4.2.6 Barriers to lifestyle changes
32 participants who had not yet made any lifestyle changes provided a number of reasons for this:
• Health or medical reasons - injury or recovering from an operation, being on medication and ‘Feeling
poorly.’ was preventing several participants from
doing exercise.
• Lack of time - competing demands of work, ‘The long
hours and shift patterns.’ and other life commitments,
such as caring for grandchildren in school holidays, or simply ‘Day to day things that get in the way.’
• Low motivation – self-professed laziness, and tiredness affected some people’s motivation or simply not acknowledging the importance of making changes: ‘[I don’t] feel at risk, nor am I overweight, so I guess knowing that I'm “safe” is not pushing me enough.’
• Other - A few people mentioned that the timing is not right for them due to current life situations such as moving house. One participant felt that their age (75) made exercise feel difficult and another reflected on the challenge of trying to break existing lifestyle habits: ‘[It's] difficult to change established patterns of eating.’
22.0%
4.9%
33.4% 39.7%
Male
19.9%
2.6%
25.4% 52.0%
Female 22.0%
4.9%
33.4% 39.7%
Male
[image:16.595.38.298.232.358.2]Yes, everyday Yes, but not everyday No, I've quit No, never have
Figure 6: Percentage beakdown of smoking status by sex
Table 9. Progress of participants who had set a tobacco use goal
Tobacco use goal
Set a goal at baseline 166
Completed follow-up(*) 18 (11%)
Answered follow-up question 18
Taken positive action (†) 13 (72%)
Cut down on smoking tobacco (†) 8 (44%)
Given up smoking (†) 4 (22%)
Not taken any action (†) 5 (28%)
* % of those setting a goal
4.2.7 Summary
The high prevalence of overweight (63% of those providing data), inactivity (not typically meeting UK guidelines), smoking (24%) and sub-optimal consumption of fruit and vegetables (less than five portions a day) confirms that WUTC was successful at targeting people who may have an increased risk of developing cancer. Furthermore, prevalence of obesity in both locations was higher than estimated for those areas and prevalence of smoking was higher in pharmacy participants than estimated for that area. Those completing WUTC through pharmacies were more likely to smoke, be overweight and inactive compared to participants in Leeds.
WUTC was successful in encouraging a total of 948 people (70%) to set at least one lifestyle-related goal and of these, 471 (50%) were signposted to a support service. Furthermore, it successfully encouraged those at greatest risk to set lifestyle-related goals, with 66% of overweight participants setting a goal related to weight and/or diet (50% of these signposted to services), 49% of inactive people setting a goal to increase physical activity (50% of these signposted to services), and 49% of smokers aiming to cut down or quit (71% of these signposted to services).
Around three quarters of those at follow-up who had aimed to make lifestyle changes had taken positive steps – the most successful were those who had intended to change their diet and/or lose weight (91% of respondents had taken positive action and 37% of respondents had lost weight) and those who intended to become more physically active (86% of respondents had taken positive action). Similar positive results were observed for alcohol with 75% of respondents taking positive action and with tobacco use with 72% of respondents having taken positive action - one person had given up alcohol completely and four people had quit smoking.
Barriers to change seemed to focus around making changes to diet and physical activity, with common barrier including poor current health, lack of time or lack of motivation, which highlights the importance of signposting to services who may be able to provide specialist support to overcome these.
The findings overall demonstrate that WUTC has a high level of success in changing lifestyle behaviours and encouraging the use of support services.
4.3 Assessment of cancer awareness and encouraging early diagnosis
Baseline
Cancer awareness
[image:17.595.75.510.549.790.2]Of the 1,297 participants who were asked about their awareness of cancer signs and symptoms, 1,215 (94%) could name at least one, and awareness was generally greater among pharmacy participants. On average, people were able to list four – however men’s awareness was approximately half that of women’s (Figure 7). The most commonly known symptom was a lump or swelling. Five people thought that cancer could have no signs or symptoms (response of ‘nothing’). Additional signs and symptoms stated by 25 participants (not stated on the original tick list) included bloating, breathlessness and breast changes.
Experience of cancer signs and symptoms
A total of 640 people (47%), including 211 men (41% of all men) and 420 women (46% of all women) stated that they had recently experienced a sign or symptom of cancer, with ‘feeling more tired than usual for some time’, ‘breathlessness’ and ‘a cough that has lasted for three weeks or more’ being the most common (~35% of those participants) and were more common among women. 88 men (20% of all men) had experienced signs and symptoms of prostate cancer and 51 women (6% of all women) had experienced signs and symptoms of cervical cancer.
Figure 7. Awareness of cancer signs and symptoms across men and women
0% 10% 20% 30% 40% 50% 60%
Other Don't know Refusal Nothing Feeling weak Blurred vision Loss of appetite Bruising Generally unwell Nausea/sickness Tiredness/fatigue Weight loss Change in appearance of mole Sore that does not heal Difficulty swallowing Change in bowel/bladder habits Cough/hoarseness Bleeding Pain Lump/swelling
Percentage of Respondents
Prevalence of current symptoms was greatest in pharmacy participants, with over half having experienced one or more of the listed signs/symptoms.
Goals set
468 people had consulted with their GP about their signs and symptoms (73% of those experiencing symptoms), however of the 172 who hadn’t (including 78 men and 92 women), 70% of those men and 56% of those women said they aimed to speak to their GP following WUTC.
Follow-up
Progress with goals
Of those completing the follow-up, 24 had previously set a goal to discuss their signs and symptoms with their GP and 9 of these had since done so (38%).
4.3.1 Reasons for not contacting a GP about signs and symptoms
Of those who hadn’t consulted their GP, four said their symptoms had gone, and two said they hadn’t been able to get a convenient appointment.
Some participants felt it was not relevant to consult their GP – that there was no need, or they did not feel it was a priority ‘I'm ashamed to say it doesn't feel important enough, or perhaps more accurate to say “bad
enough” yet - I know this is a bad attitude!’ In one case,
a participant explained that she is going to monitor her situation for a while first: ‘My signs & symptoms are not as severe or prominent as previously mentioned in the questionnaire so I'm seeing how I get on for now before contacting the GP.’
Other people confirmed that they had already spoken to their doctor prior to participating; whilst others noted that they have not yet got around to it, but mean to do so. For one woman it was a combination of these reasons: ‘Time is the main reason - caring for a disabled husband et cetera. Also the fact that I am overweight is the main cause of breathlessness when walking uphill or when rushing about, which I do a lot.’
4.3.2 Summary
In summary, 94% of people knew at least one of the common signs and symptoms of cancer, particularly a lump/swelling, however women’s awareness was almost double that of men’s across all signs and symptoms. 73% of those people experiencing signs and symptoms had consulted their GP and of those who had not, 70% of those men and 56% of those women said they would do so. At follow-up, over a third of respondents who had initially planned to consult their GP had done so – some had not because their symptoms had disappeared, they were not able to get an appointment or did not think it was a priority.
4.4 Engagement with cancer screening Baseline
Eligibility and goal setting
947 (70% of all participants) were eligible for any of the four screening programmes discussed (cervical, breast, bowel and chest x-ray) and 69 women (7.7%) were eligible for all three national screening programmes (cervical, breast and bowel).
179 screening goals were set across 162 people (Table 10), mainly among women (131 women vs. 29 men) which is likely due to women being eligible for multiple screening programmes across the lifespan.
Follow-up
Progress with goals
At follow-up, a total of nine screens had been completed which was 35% out of the 26 goals that could be reviewed at follow-up (Table 10).
Out of the 650 women eligible for cervical screening (75% of women), 515 (79%) had engaged which is a greater than observed across Yorkshire (76%, PHE Cancer in Yorkshire and Humber 2016 report). Of the 135 women who hadn’t engaged in cervical screening, 70 (52%) set a goal to take steps to complete this. Ten of the follow-up completions had set a cervical screening goal through WUTC, with seven of these since taking action (70%) including two having completed and one having made an appointment.
Out of the 342 women eligible for breast screening (38% of women), 85% had engaged which is much greater than observed across Yorkshire (72%, PHE Cancer in Yorkshire and Humber 2016 report). Of the 52 women who hadn’t engaged in breast screening, 31 (60%) set a goal to take steps to complete this. Four of the follow-up completions had set a breast screening goal through WUTC, with two since taking action including one having completed.
4.4.1 Barriers to engaging with screening
Barriers to setting screening goals were noted by Barca as they arose during delivery – for cervical screening, six females were ineligible due to hysterectomy and two were unwilling due to a history of abuse and one participant stated they always threw away bowel screening kits as they do not want to complete. Furthermore, this participant also stated they would not speak to their GP if they were experiencing any signs or symptoms.
At follow-up, eight people had experienced barriers that had prevented them from taking steps to complete their screening goals including and a lack of time and difficulty in obtaining a convenient appointment. One woman had not yet taken steps to get a cervical screening and an x-ray because at the moment she feels fine and another would like to lose weight before arranging to complete her cervical screening as she feels too embarrassed at ‘The thought of having an
intimate examination.’ A third woman noted that she
lacks assistance, namely the support and transport she would need to get to an appointment.
4.4.2 Summary
[image:19.595.49.560.58.261.2]In summary participants already showed good engagement in screening, with rates higher than typically observed for Yorkshire. However, WUTC still identified over 400 incidences of missed screening opportunities (135 cervical, 52 breast, 89 bowel, 134 chest). A total of 179 screening goals were set – this tended to be about half of those who were eligible but had not completed, except for chest screening where the goal-setting rate was lower (23%). At follow up 6-8 weeks later, positive steps had been taken; out of the 26 screening goals which could be reviewed, 16 (62%) had made progress and 9 screens had been completed (35%).
Table 10. Overview of eligibility and engagement with screening at baseline and follow-up
Cervical Breast Bowel Chest
Baseline
Eligible (% of all participants)* 650 (75%) 342 (38%) 335 (25%) 134 (10%) Not completed (% of eligible) 135 (21%) 52 (15%) 89 (27%) N/A Set a goal (% of not completed) 70 (52%) 31 (60%) 47 (53%) 31 (23%)
Follow-up
Completed follow-up 10 4 3 9
Answered follow-up question 10 4 3 9
Taken positive action (%)† 7 (70%) 2 (50%) 2 (66%) 5 (55%) Completed screening (%)† 2 (20%) 1 (10%) 2 (20%) 4 (40%) Not taken action 3 (30%) 1 (10%) 1 (10%) 4 (40%) * Of all women for cervical and breast screening data
† % of those answering the follow-up question
4.5 Perceived learning from WUTC
111 of the 168 follow-up participants (66%) felt they’d learnt something through taking part in WUTC. In their reflections respondents focused on 3 main areas:
• Knowledge gained, including knowledge about healthy lifestyles, and monitoring your health, including the signs and symptoms to look out for. • Motivation and reassurance.
• Advice received about consulting the GP/seeking medical advice, and arranging screening.
Knowledge
WUTC both provided new knowledge for participants plus acted as a timely reminder of information they may know but have not acted on: ‘It's given me a wake-up call and made me more aware of the things I need to do and changes I need to make and a better understanding of why these changes can really benefit and help me.’
Participants appreciated the information they gained and valued the importance of knowledge in taking responsibility for one’s health: ‘I think it is very important to know all you can about Wise Up To Cancer. I lost my dad in ‘84 to lung cancer but I think that things
have progressed a lot since then.’ Participants on the
whole acknowledged the relationship between lifestyle and cancer: ‘Look after your body to help the prevention
of cancers.’ and ‘Sometimes our genes and age can have
a part in the risk we run of getting cancer, but trying to live a healthy lifestyle can lower some risks.’
Some participants had taken the lifestyle advice on board in a holistic way and felt that they are now more aware of the need: ‘To look after myself. To do
more exercises, eat healthy foods.’; ‘Diet not only affects
fitness but also general health.’ and ‘Good food (freshly
made) using stairs, cycling to and from the library.’ Other
comments focused on specific guidelines received:
‘Less red and processed meat is better.’; ‘The importance
‘Awareness of sugar in food and drinks. Extra salt and
sugar on food.’ One woman related how she has applied
the dietary advice to her children’s diet: ‘I feed my boys so we all need to eat healthier.’
Some participants had learnt where and how to access advice and support to make lifestyle changes: one person realised that ‘Help [is] available for stopping
smoking.’; whilst another can now identify ‘How to get
help with losing weight.’
Awareness of signs and symptoms had increased in some: ‘Increased my knowledge and awareness of
potential signs to look for and consider.’; ‘More symptoms
to look out for with cancer than I thought.’ and the
importance of knowing the early warning signs of cancer and of monitoring oneself and being attentive to body changes was identified: ‘Be aware of early warning
signs and do something about [it].’ and ‘To look out for
my skin [for] brown marks and how they change.’
Others believe that they were already well-informed prior to the project and didn't learn anything but nevertheless felt ‘It was useful to be reminded of a
few things.’; ‘It’s all common sense - just needed to be
reminded every now and then.’ and ‘[I learnt]not a lot, as
I had heard most of it before.’
Some participants had learnt more about the regional context ‘[I learned more about] the good work carried
out by Yorkshire Cancer [Research].’ and ‘[I learned]
about Yorkshire not getting as much help towards the trust than London who receive more funding help from cancer research.’
Motivation and reassurance
WUTC had increased motivation to make lifestyle changes and acted as a reminder for those who were already trying to make changes: ‘It is A LOT easier to make changes than you think. Little smaller changes over time will mean I reach my goal of becoming
healthier.’; ‘Small changes make a difference.’; ‘I already
felt like I was living a relatively healthy lifestyle but this certainly helped me continue to be motivated to work out
more and eat healthier.’ and ‘This email has reminded
me to pursue my alternative lifestyle.’ Medical advice and screening
Learning about the importance of screenings and of getting signs and symptoms checked out was highlighted: ‘I have learnt that everyone should talk to someone if there have been any changes in or with our
bodies. [Be] aware to discuss any changes small or big.’;
‘Don't just leave it get checked out.’
The project had increased confidence when it comes to seeking medical advice: ‘I learned not to be afraid
to contact my doctor if I feel it to be necessary.’ and
‘[I would] go back to GP or nurse prescriber if I ever have persistent symptoms that don't change after first diagnosis and treatment tried over a period of time.’
Some participants had learnt how to go about arranging screenings and where they are available: ‘I
can obtain a chest x-ray at walk in clinics.’ and ‘Some
screening ends at 70+ so it is good to know that it can be requested at a later age if needed (I am 74 but still have breast cancer screening as my mum had cancer at 80).’
For one person, being better informed as a result of the WUTC project means that she has ‘Better awareness of checking for breast cancer and the procedures involved when having a mammogram - coincidentally my appointment came through a week later so I was much better informed when it did.’
In summary, it is evident, that the majority of respondents believe that they have learnt valuable things from WUTC, and feel more informed and motivated with regard to adopting a healthy lifestyle, monitoring their health and in seeking medical advice and screening. The general enthusiasm reported is demonstrated by one participant keen to share her newly acquired knowledge: ‘I teach exercise sessions and since taking part I have spoken to the class
participants and asked them to look at why you have to “wise up to cancer” and make lifestyle changes.’
0% 10% 20% 30% 40% 50% 60% 70% 80% 90% 100%
I am considering making change to my lifestyle as a result of WUTC I have learnt something new about cancer signs and symptoms I am more likely to speak to my GP about cancer signs and symptoms in the
future
I am more likely to go to screening in the future I would recommend WUTC to friends and family I feel positive about YCR funding WUTC
[image:20.595.95.499.602.786.2]Strongly agree Agree No opinion Disagree Strongly Disagree
Figure 9. Action taken in relation to Yorkshire Cancer Research following WUTC 78% 25%
7% 21% 7%
4%
0% 10% 20% 30% 40% 50% 60% 70% 80% 90%
Told someone else about Yorkshire Cancer Research Visited the Yorkshire Cancer Research website Signed up to receive the Yorkshire Cancer Research communications Made a donation to Yorkshire Cancer Research Signed up to take part in a fundrasing activity, for example a sponsored run Organised your own fundrasing activity, for example a coffee morning or
cake sale
Percentage of respondents
4.6 Intervention feedback Baseline
520 people (40%) had not heard of Yorkshire Cancer Research before WUTC.
Of all WUTC participants, 91% agreed that they would recommend it to their friends and family and 91% felt positive about Yorkshire Cancer Research funding the initiative (Figure 8).
68% of people agreed they were considering making changes to their lifestyle as a result of WUTC, which is similar to the proportion of participants who set a lifestyle-related goal (70%). Those who disagreed may have felt they did not need to make any changes as some people were already following healthy lifestyle behaviours.
Over 80% of all participants agreed that they had learnt something new about cancer signs and symptoms and 88% agreed they were more likely to speak to their GP about cancer signs and symptoms in the future.
Follow-up
Engagement with and promotion of Yorkshire Cancer Research
109 of the 168 follow-up participants (65%) responded to the question relating to promotion of and
engagement with Yorkshire Cancer Research following WUTC. Of those 109, 85 participants (78%) had told someone about Yorkshire Cancer Research, 27 (25%) had visited the website and 23 (21%) had made a donation (Figure 9).
Topics covered
96% of follow-up respondents rated this as ‘good’ or ‘very good’. Respondents found the topics informative, helpful and interesting; ‘It covered many areas and was
informative.’ The variety of information covered was
appreciated; ‘Good topics for all ages.’; and another that
‘It was really helpful and I have made changes in my
immediate family’s lives.’
Some respondents commented favourably on the conversational format, saying it was ‘Good that you can
ask questions and see what's out there.’ Another person
felt that the face-to-face aspect was beneficial, noting that ‘It is nice to see people about these sort of things - it clears your mind.’
Some participants had reservations about specific aspects of the information they received: one individual, for example, remarked on the difficulty of getting a doctor’s appointment, something not covered in the project; whilst another felt ‘The advice about increasing fruit in your diet is counterproductive for someone with diabetes. I find even a piece of
fruit can cause my blood sugar to spike.’ Another
participant, whilst acknowledging the need for ‘generic’ information, suggested that Yorkshire Cancer Research also ‘Please look into adding some of the rarer cancers & signs/symptoms into your surveys/questionnaires to bring up awareness levels of these to the public.’ Advice and support given
88% of follow-up respondents rated this as ‘good’ or ‘very good’. The general view among respondents was that the advice and support were excellent/good, helpful, clear and informative ‘The support given was very useful and inspiring.’
Some comments focused on specific elements of the project; for example, one person identified the
‘Very well presented’ health and wellbeing session;
whilst another singled out the ‘Helpful advice about mammogram screening.’