Citation:
Francis, P and Mc Cormack, W and Lyons, M and Jakeman, P (2018) Age-group Dif-ferences in the Performance of Selected Tests of Physical Function and Association with Lower Extremity Strength. Journal of Geriatric Physical Therapy. ISSN 1539-8412 DOI: https://doi.org/10.1519/JPT.0000000000000152
Link to Leeds Beckett Repository record:
http://eprints.leedsbeckett.ac.uk/3915/
Document Version: Article
The aim of the Leeds Beckett Repository is to provide open access to our research, as required by funder policies and permitted by publishers and copyright law.
The Leeds Beckett repository holds a wide range of publications, each of which has been checked for copyright and the relevant embargo period has been applied by the Research Services team.
We operate on a standard take-down policy. If you are the author or publisher of an output and you would like it removed from the repository, please contact us and we will investigate on a case-by-case basis.
1 ABSTRACT
1
Background and Purpose: It is not known whether short functional performance tests used 2
in aging research are appropriate for use in healthy older adults. The purpose of this study 3
was to investigate age-group differences (6th decade vs. 7th decade) in selected functional 4
performance tests and the association between lower extremity strength and functional 5
performance. 6
Methods: One hundred and fifty nine (18.2% (n=29) male) healthy older (mean (standard 7
deviation) age: 60.4 (5.3) years) adults were recruited from the University of Limerick 8
Campus Community. Knee extensor (KE) peak torque (PT) was assessed from a maximal 9
voluntary isometric contraction (MVC). Subsequently, participants completed 10m maximal 10
and habitual gait speed tests, 5 repetition and 30-second chair rise tests and a 900m gait speed 11
test. 12
Results and Discussion: There was no difference in 10m gait speed between those in the 6th 13
and 7th decade (P>0.05). Compared to the 6th decade, those in the 7th decade required an extra 14
39 seconds to complete 900m, an extra 0.6 seconds to complete 5 chair rises and performed 2 15
less chair rises in a 30-second time period (P<0.05). All tests had a weak association with KE 16
strength (r=0.226 - 0.360; P<0.05), except for 900m gait speed which had a moderate 17
association (r=-0.537; P<0.001). Our findings suggest that gait speed tests ≤10m cannot 18
detect age-related difference in functional capacity when used in healthy older adults. 19
Conclusion: Extended physical performance tests should be used in aging research on 20
healthy older adults. 21
Key words: ADL, knee extensor, strength, ageing 22
2 25
INTRODUCTION 26
The assessment of functional limitation is the third diagnostic criteria for sarcopenia after the 27
assessment of muscle mass and strength. Functional limitations refer to an individual’s 28
physical or mental capability without reference to the social context.1 A gait speed of 0.8 – 29
1.0m/s has been suggested as a criterion for identifying those at risk of sarcopenia.2,3 Gait 30
speed (8 foot), the ability to rise from a chair (5 times) and balance tests (semi-tandem and 31
tandem stands) have been included in the short physical performance battery (SPPB), which 32
has been validated in older adults and found to predict nursing home admission.4 33
Furthermore, older adult performance on the SPPB or tests of similar difficulty have been 34
associated with laboratory measures of muscle mass and function. Low relative skeletal mass 35
has been shown to be associated with performance on the SPPB.5 Increasing knee extensor 36
(KE) strength has been associated with improved walking speed and the ability to rise from a 37
chair6,7 and increasing KE power has been linked to improved self-reported8 and objectively 38
measured (SPPB; stair climbing) physical performance.9 39
Functional performance measures such as those within the SPPB or similar tests such as 40
gait speed tests less than or equal to 10m and chair rise tests of less than or equal to 5 41
repetitions have primarily been used to assess functional limitation in frail older adults over 42
the age of 65 years10-12 up to and including 95 years.8 However, changes in muscle quality, 43
which precede functional limitation, become noticeably different to a young adult at the 44
beginning of the 6th decade.13-18 Comparatively, there is little data on the functional capability 45
of healthy older adults and consequently, little is known about the time course and transition 46
to a reduction in functional capability in those prior to 65 years. Reductions in aerobic 47
capacity and muscle function are inevitable even in masters athletes19,20 but tracking age-48
3
due to the heterogeneity of their functional capabilities. Ideally functional performance 50
measures would be related to the performance of activities of daily living (ADL) but also able 51
to distinguish meaningful gradations of functional capability and change over a wide range of 52
abilities. 53
Test batteries such as the SPPB may suffer from a ceiling effect when used in healthy 54
cohorts.21 A healthy older adult may perform short gait speed or chair rise tests in a similar 55
manner to a young adult meaning the tests cannot detect change where expected. One option 56
to combat this effect is to use extended tests of chair rise ability or gait speed. This may allow 57
participants to perform to a greater physiological maximum and therefore distinguish more 58
subtle gradations of capacity in healthy adults. Some authors22,23 have proposed extended 59
tests such as the 30-second chair stand test and the 6-minute walk test23,24 as a method to 60
combat the floor effect, that is where an older adult may not be able to complete a fixed 61
distance or number of chair rises. Tests of this nature may also have the potential to derive 62
meaningful performance data for healthy older adults. 63
Although test-retest reliability for gait speed and chair rise tests has previously been 64
described in those greater than or equal to 60 years23-27 it has not been described in healthy 65
adults greater than or equal to 50 years. Furthermore, a learning effect has been reported 66
during the measurement of voluntary strength in healthy adults naïve to a laboratory 67
environment.28 Investigations into whether a learning effect exists in the measurement of 68
functional performance are required to ensure criterion validity of the data reported. 69
Assuming reliable measures of functional performance can be determined, it remains to be 70
observed whether gait speed tests less than or equal to 10m and chair rise tests less than or 71
equal to 5 repetitions can detect age-related difference in the functional capability of healthy 72
older adults. Furthermore, it remains to be observed whether extended tests of functional 73
4
Finally, given the association between strength and functional performance in older adults29-32 75
and the fact that strength at a single time point is predictive of future mobility limitation33 it is 76
important to determine whether there is an association between short or extended functional 77
performance tests and laboratory measures of lower extremity muscle strength in healthy 78
adults between 50 and 70 years of age. The purpose of this study was to a) determine test-79
retest reliability of functional performance using short (10m gait velocity, 5 chair stands) and 80
extended (900m gait velocity and the number of chair stands in 30-seconds) tests, b) to 81
determine the efficacy of short and extended tests of functional performance in detecting age-82
related difference between the 6th and 7th decade in healthy older adults and c) to examine the 83
association between maximal voluntary isometric torque of the knee extensors and 84
performance in short or extended tests of functional capability in the same sample. 85
METHODS 86
A convenience sample (n=204) of healthy older (50 – 70y) adults was recruited via email and 87
word of mouth from the University of Limerick campus community and surrounding area to 88
take part in the University of Limerick Healthy Aging Study.28,34,35 For the present 89
investigation, 159 older adults mean age (standard deviation) of 60.4 (5.3) years from the 90
sample volunteered to participate; 18.2% (n=29) were male. There were 11 (15.5%) and 18 91
(11.3 %) males in the 50 – 59y and 60 -70y age brackets respectively. Participants received a 92
full medical screening and physical examination prior to the assessment of a maximal 93
voluntary contraction (MVC) and functional performance. Those defined as healthy, i.e. 94
disease free based on Greig et al.36 and living independently were invited to participate. 95
Disease free included the absence of clinical, cardiovascular or musculoskeletal abnormality 96
as determined by a medical doctor. Participants were required to be healthy but not masters 97
athletes. After receiving a complete explanation of the procedures, benefits and risks of the 98
5
January 2011 and May 2013. This study was approved by the Research Ethics Committee of 100
the University of Limerick (EHSREC 10-RA03). 101
Participants presented to the laboratory in a tracksuit or comfortable clothing suitable 102
for exercise. Participants were tested during 2 identical sessions held 7 days apart, at the same 103
time of day in order to reduce the potential for a learning effect previously identified in the 104
measurement of strength in this population.28 All measurements were carried out by the same 105
exercise scientist, who was blind to age, to exclude issues with inter-tester reliability and 106
reduce risk of bias. Warm up consisted of 5 minutes on a bicycle ergometer (Monark 107
Ergomedic; 828E) at an intensity of 40 watts. The entire sample (n=159) completed a MVC, 108
a 5 repetition chair rise test and an extended 900m gait speed test. A smaller proportion of the 109
sample (n=65/159) completed 10m gait speed tests due to preliminary analysis which 110
suggested the tests could not detect age-related difference in gait speed where expected. The 111
30-second chair rise test was added to the University of Limerick Healthy Aging Study at the 112
midway point and therefore also has a smaller sample size (n=91/159). 113
Maximal Voluntary Knee Extensor Strength Measurements 114
Maximal voluntary isometric contractions of the knee extensors of the dominant limb (limb 115
used to kick a ball) were measured using a Con-Trex MJ Dynamometer (Con-Trex MJ; CMV 116
AG, Dubendorf, Switzerland). Peak isometric torque was measured in Newton-Meters. 117
Participants were seated with a hip flexion angle of 110°. The back of the knee joint was on 118
the edge of the seat with a knee angle of -60° from anatomical zero (180°). The distal shin 119
pad of the dynamometer was attached 4-5cm proximal to the medial malleolus using a velcro 120
strap. The dynamometer rotational axis was aligned with the lateral femoral condyle (knee 121
joint axis of rotation). Participants were instructed to perform 2 submaximal voluntary 122
6
Maffiuletti et al.,37 with a 1 minute rest period in between. The participant then performed 3 124
MVC’s of the knee extensors separated by 2 minutes of rest. An MVC produced a measure of 125
isometric peak torque in a single effort which required greater than 200ms and was sustained 126
for at least 250ms. Disqualification of an MVC from further analysis was based on the 127
following criteria: (a) an attempt not sustained for MVC; identified by an impact spike prior 128
to 300ms, (b) an attempt containing an initial countermovement; identified by a visible 129
drop/rise in the torque signal greater than 5 N·m or (c) an attempt with a non-linear time-130
torque trace; identified by a double movement. Repeated peak torque values within a 131
coefficient of variance (CV) of 5% which satisfied the criteria for MVC were accepted for 132
analysis. A detailed breakdown of the strength assessment procedures including within and 133
between day reliability are available in our recently published manuscript.28 134
10m Gait Speed Tests 135
Gait speed was assessed using timing gates (Micro-Gate, Polifemo, Bolzano, Italy) separated 136
by 1.5m positioned at 0 and 10m of a measured walkway. Participants stood at the beginning 137
of a track marked by a white line and from a static start were instructed to walk at their 138
‘normal’ pace to assess habitual gait speed. Participants were instructed to walk as fast as 139
they could without running in the case of maximal gait speed. Participants had an open 140
walkway for deceleration. Each trial condition was repeated twice. 141
Chair Rise Tests 142
The ability to rise from a chair was assessed using a chair, 44cm from the floor, which was 143
placed against a wall for support. Participants were instructed to sit upright away from the 144
back rest of the chair with their arms crossed against their chest. Participants were asked to 145
perform one full chair stand prior to completing the test in order for them to establish a 146
7
complete 5 chair rises as fast as possible. Participants were informed that only chair rises in 148
which they reached full extension from the seated position would be counted. The exercise 149
scientist held the watch and only communicated verbally with the instructions “Go” and 150
“Stop” at the beginning and end of the test. Subsequently, with no defined rest period, using 151
the same positioning and technique participants were instructed to perform as many chair 152
rises as possible in a 30-second time period. The 5 repetition chair rise test always preceded 153
the 30-second chair rise test. Each test was performed once on each of the two test days. 154
Extended Gait Speed Test 155
Extended gait speed was assessed using a timed 900m test. Participants were brought to an 156
indoor track which measured 225m per lap. Participants were instructed to complete four laps 157
of the track as fast as they possibly could. The majority of participants used one or a 158
combination of running, jogging or walking to complete the test. No instruction was provided 159
as to correct pacing but tests were performed twice separated by 7 days to ensure adequate 160
habituation to the test had taken place. The purpose of this test was to allow participants to 161
perform to a greater physiological maximum than allowed by the 10m tests. 162
Statistical Analysis 163
The data were analysed using SPSS 22.0 for Windows (SPSS, Inc., Chicago, IL, USA). A 2-164
way mixed model intraclass correlation coefficient (ICC) was used to assess absolute 165
agreement as it indicates the error in measurements as a proportion of total variance in 166
measures. Cross-tabulation was used to determine the proportion of males and females in the 167
respective age-categories. Pearson’s Chi-Square test was used to determine whether 168
differences in the proportions of males between groups were statistical different. The 169
difference in functional performance between test days was reported using a paired sample t-170
8
Smirnov or Shapiro-Wilk test was conducted to determine normality. Mean and standard 172
deviation (SD), median and interquartile range (IQR), and 95% or boostrap 95% confidence 173
intervals (CI) are reported. Cross-sectional age or gender-related difference in peak torque 174
(PT) and functional performance were analysed using an independent samples t-test or a 175
Wilcoxon signed rank test for normal and non-normal data respectively. Pearson’s r was used 176
to report the association between PT and functional performance. Simple linear regression 177
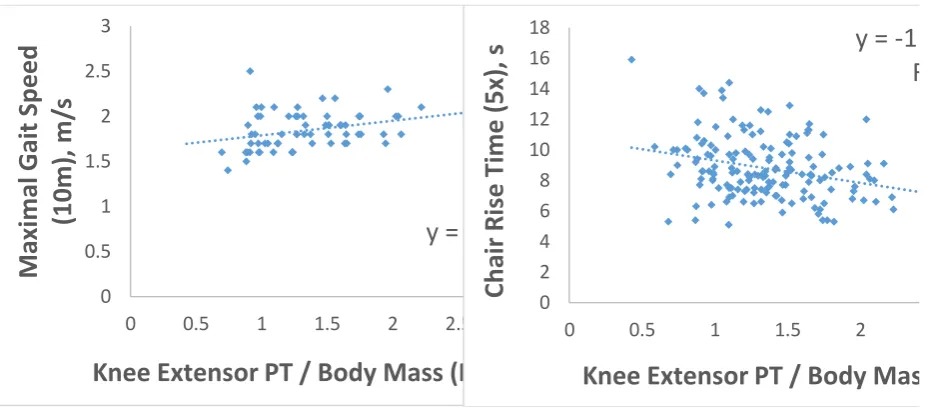
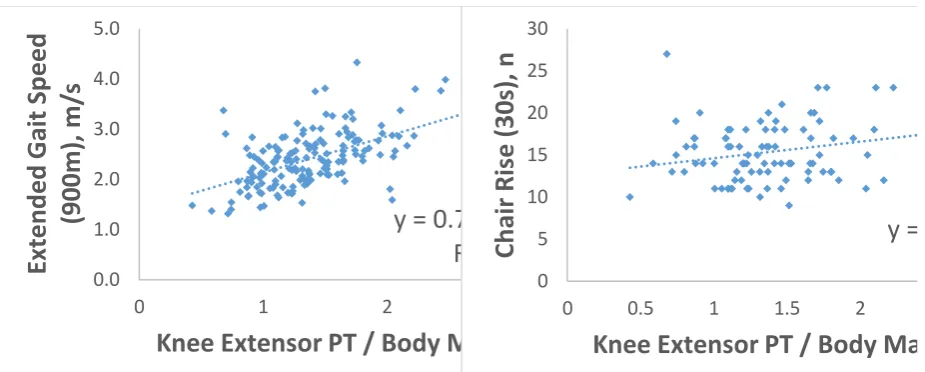
analysis was used to assess the variance in functional performance accounted for by knee 178
extensor (KE) PT (Figure 1). Removal of outliers visible on the scatter plot did not alter the 179
statistical significance or category of association and therefore they were not removed. 180
Stepwise linear regression was used to assess whether sex or BMI affected associations 181
between PT and functional performance for the sample as a whole and separated by age 182
categories. Functional capability (gait speed or chair rise) was entered as the dependent 183
variable and PT, sex (1=female, 2=male) and BMI were entered as independent variables. 184
RESULTS 185
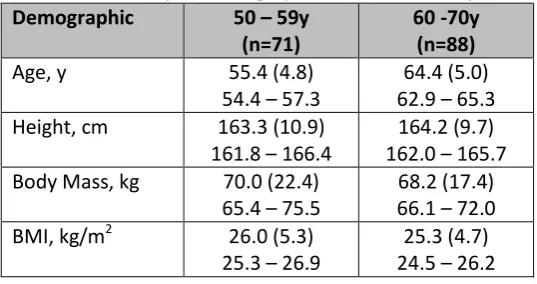
Table 1 displays physical characteristics for the 159 healthy adults between 50 and 70 years 186
of age who participated in this study. Physical characteristics are presented separately for 187
those in the 6th (n=71) and 7th (n=88) decade of life. The proportion of men and women in the 188
6th (15.5% and 84.5% respectively) and 7th decade (20.5% and 79.5% respectively) was not 189
statistically different (P=0.421). KE torque and 900m gait speed were the only measures 190
where performance between men and women differed (P<0.05). 191
Reliability of Estimate 192
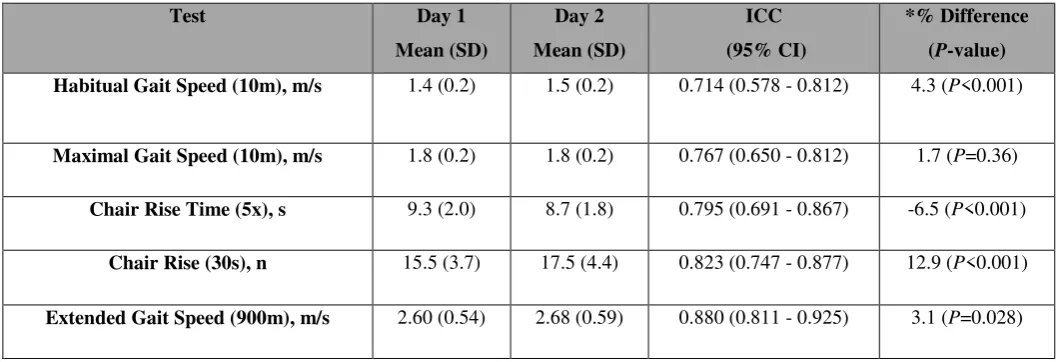
Our functional performance measures included habitual and maximal 10m gait speed, 5 193
repetition and 30-second chair stand performance and 900m gait speed. Test-retest reliability, 194
9
separated by 7 days, is displayed in Table 2. Reliability was affected by a learning effect 196
between test days which led to a statistically significant increase in performance (P<0.05) on 197
day 2. The 900m test was the only measure of functional performance not previously used in 198
the literature but demonstrated the highest ICC (0.880; 95% CI 0.811 - 0.925). Age-related 199
difference in measures of functional performance and associations with KE-PT are reported 200
from the highest values recorded from both days. 201
Age-related Difference in Functional Performance 202
Table 3 displays age-related difference in functional performance. 10m habitual (P=0.095) 203
and maximal (P=0.856) gait speed were not different between those in the 6th and 7th decade. 204
Both 5 repetition (8.2 (2.6) seconds vs. 8.8 (2.5) seconds; P=0.006) and 30-second (16.5 (5) 205
vs. 14.0 (5); P=0.028) chair rise tests were lower for those in the 7th decade. Those in the 7th 206
decade had an 11.3% (0.29m/s; 95% CI 0.12 - 0.46; P=0.001) lower gait speed when 207
completing 900m compared to those in the 6th decade. 208
The Association between Lower Extremity Strength and Functional Performance 209
PT normalised for body mass was 14.2% (0.2N·m/kg; CI 0.08 - 0.33; P=0.001) lower for 210
older adults in the 7th decade of life compared to their young counterparts in the 6th decade. 211
Other than 900m performance, all measures of functional performance had a weak (r=0.226 – 212
0.360; P<0.05) association with KE-PT (Table 4). Performance in the 900m gait speed test 213
had a moderate association (r=0.537; P<0.001) with KE-PT. Sex and BMI did not have a 214
statistically significant effect on associations between KE-PT and functional performance 215
(P>0.05). 216
DISCUSSION 217
Repeated measurement of functional performance separated by 7 days revealed a statistically 218
10
These findings highlight the importance of the need to reduce the learning effect observed 220
with performance tests in healthy older adults. Neither habitual nor maximal 10m gait speed 221
could determine age-related difference in functional capacity, in essence confirming our 222
hypothesis that shorter gait speed tests may suffer from a ceiling effect in the assessment of 223
healthy older adults. The 900m extended gait speed test highlighted an 11.3% difference in 224
performance between those in the 6th and 7th decade of life. Both short and extended chair rise 225
tests were capable of detecting age-related difference in muscular power and endurance 226
respectively. The chair rise and extended gait speed test confirm that tests centered on lower 227
extremity power and/or tests which allow performance to a greater maximum can effectively 228
combat the ceiling effect evident with use of short gait speed tests in healthy older adults. All 229
measures of functional performance had a weak to moderate association (r=0.226 - 0.534; 230
P<0.05) with knee extensor strength. 231
Gait Speed 232
Diagnostic criterion for sarcopenia is considered to be a gait speed of less than 0.8 – 1.0 233
m/s.2,3 The mean habitual gait speed in the present investigation was 1.5m/s which 234
demonstrates the relative health of our sample in comparison to a cohort with sarcopenia. It is 235
therefore somewhat unsurprising that neither 10m habitual nor maximal gait speed test were 236
capable of detecting age-related difference between the 6th and 7th decade. Glenn et al.21 237
provide support for these findings, in a sample of similar age (61.5 years), size (n=102) and 238
habitual gait speed (1.44 m/s). The authors report no difference in habitual gait speed 239
between older adults who are sedentary, recreationally active or masters athletes and no 240
difference in maximal gait speed between those who are sedentary or recreationally active. 241
However, our results must be interpreted in light of the small number of participants who 242
completed 10 m gait speed tests in the 50 – 59 year (n=37) and 60 -70 year (n=28) age 243
11
in functional capacity where expected between the 6th (n=71) and 7th decade (n=88). In 245
addition to its construct validity, this test demonstrated high reliability and has been reported 246
to be sensitive to change during a short term (12 weeks) resistance training intervention.35 We 247
report an 11.3% difference in gait speed between the 6th and 7th decade (2.56 m/s vs. 2.27 248
m/s; P=0.001) which is similar to the 11.3% (1.53 m/s vs. 1.35 m/s) difference reported by 249
Rikli and Jones38 between the 7th and 8th decade. Although this appears to suggest a similar 250
per decade decline between the 6th and 7th decade, it must be acknowledged there are 251
differences in test administration such as our test was of fixed distance and participants were 252
allowed to run compared to the 6-minute walk test which is not of fixed distance and requires 253
participants to remain walking. There is potential in our test, that the mean gait speed could 254
be inflated or underestimated by the number of participants choosing to run or walk. Despite 255
these differences both tests allow participants to perform to the maximum of their ability for 256
an extended distance (400 – 900m) or duration (6 to 6.5 minutes) and therefore relative 257
differences in performance can be compared with caution. 258
Chair Rise Tests 259
Participants in the 7th decade of the present study performed approximately 2 less chair rises 260
than those in the 6th decade (14 (5) vs. 16.4 (3.5); P=0.028) in a 30-second time period. The 261
14 chair rises performed by those in the 7th decade is comparable to the 14.3 chair rises for 262
those in the 7th decade reported by Rikli and Jones38 and represents a 13.3% – 14.5% 263
difference between the 6th and 7th decade. Our results therefore help to extend the work of 264
Rikli and Jones32
in the 7th, 8th and 9th decade by providing values, albeit in a smaller sample, 265
for the 6th decade of life. The finding of a detectable difference in 5 repetition chair rise 266
performance (8.2 (2.6) seconds vs. 8.8 (2.5) seconds; P=0.008) between decades might not 267
have been expected due to our hypothesis that shorter tests would suffer from a ceiling effect. 268
12
difference more closely represents the observed difference in KE-PT normalised for body 270
mass (1.48 (0.45) N·m/kg vs. 1.27 (0.34) N·m/kg; P=.001). These explanations must be 271
interpreted whilst being aware that the observed change (7.3%) in 5 repetition chair rise 272
performance between decades is similar to the CV (7%) for repeated measures between test 273
days. 274
275
Knee Extensor Strength and Functional Performance 276
Knee extensor strength was 14% lower for those in the 7th decade, a finding consistent with 277
the 8 – 15% per decade change in strength reported in adults between 40 – 70 years.28,39,40 278
Knee extensor strength explained greater than or equal to 10% of the variance in maximal 10 279
m gait speed, 5 repetition and 30-second chair rise tests (Figure 1) but 29% of the variance in 280
extended gait speed. Buchner et al.41 reported 17% of the variance in gait speed (15.2m) to be 281
explained by lower limb strength (knee extensor and flexor, ankle plantar and dorsi flexors) 282
in 60 – 96 year old men and women. Ostchega et al.6 reported 20% of the variance in 6 m gait 283
speed to be explained by KE-PT in adults greater than or equal to 50 years. However, 284
comparisons are limited both in test duration and population sampled. To the authors 285
knowledge, the timed 900m test is the first extended gait speed assessment in which more 286
than 25% of the variance can be explained by lower extremity strength in healthy older 287
adults. This is a large proportion of the variance considering that endurance performance is 288
also dependent upon cardio-respiratory capacity and peripheral muscular adaptations such as 289
capillary and mitochondrial density. The fact that increasing gait speed is associated with 290
increasing muscle strength during a test with a gait speed range of 1.3m/s – 4.3m/s is 291
encouraging. This means the relative muscular effort for those with the mean gait speed (2.27 292
13
an extended period of time. A reduction in the relative effort required to perform ADL has 294
important implications towards the goal of prolonging independent living and quality of life. 295
Limitations 296
Our findings are limited to a relatively small (n=159) convenience sample of healthy older 297
adults from the University Campus Community and surrounding areas. Furthermore, when 298
comparing the findings of short and extended performance tests, it should be noted that while 299
all participants (n=159) had a measure of strength, 5 repetition chair rise time and 900m gait 300
speed, less than half (n=65) had a measure of 10 m gait speed. Despite the 900m gait speed 301
test being sensitive to age-related difference in functional performance and having the 302
strongest association with lower extremity strength, the lack of control over the number of 303
participants walking, jogging or running may have over or underestimated our gait speed and 304
therefore influenced the strength of the associations reported. Our strength measures are 305
normalized to body mass and not the relevant segment of upper leg lean tissue or skeletal 306
mass that was measured by the dynamometer which may alter the association seen in the 307
present study. It remains to be seen whether strength normalised for body mass or strength 308
per unit skeletal or lean tissue (muscle quality) has a stronger association with functional 309
performance. We did not assess participants for stage of the menopause, cognitive function or 310
depression, nor did we control for habitual physical activity, therefore it is unknown how 311
these cofounding variables may have affected our results. Finally, education and 312
socioeconomic status have been reported to influence the health of a population,42 we have 313
not controlled for this and our sample may be subject to a greater health bias due to being 314
recruited from a University campus community. 315
14
The majority of functional performance tests (4/5) used in this investigation demonstrated a 317
learning effect evidenced by a performance improvement on day 2 of assessment. This 318
investigation demonstrated 10m gait speed tests not to have the sensitivity to report age-319
related difference in the functional capacity of healthy older adults. The extended tests in this 320
investigation demonstrated construct validity by being able to distinguish differences in 321
functional performance between healthy adults in the 6th and 7h decade of life. The 900m gait 322
speed test also had a greater association with KE strength than previous gait speed 323
associations reported in the literature. Future research should seek to determine a) whether 324
the observed learning effect in the assessment of functional capability is attenuated after a 325
third test day and b) what the relative contributions of muscle mass, strength and quality 326
(strength per unit tissue) are to functional capability in healthy older adults. 327
Acknowledgements The authors would like to thank the University of Limerick for funding this study,
328
specifically the ‘Road-bridge Medical Research Scholarship’ which funded the authors PhD research. This study 329
was also supported by Food for Health Ireland and Enterprise Ireland grant CC20080001. 330
Conflict of Interest On behalf of all authors, the corresponding author states that there is no conflict of interest
331
aside from grant funding stated above. 332
Statement of human and animal rights All procedures performed in studies involving human participants
333
were in accordance with the ethical standards of the institutional and/or national research committee and with 334
the 1964 Helsinki declaration and its later amendments or comparable ethical standards. 335
Informed consent Informed consent was obtained from all individual participants included in the study.
336
REFERENCES 337
1. Verbrugge LM, Jette AM. The disablement process. Soc Sci Med. 1994;38(1):1-338
15
2. Cruz-Jentoft AJ, Baeyens JP, Bauer JM, et al. Sarcopenia: European consensus on 340
definition and diagnosis: Report of the European working group on sarcopenia in 341
older people. Age Ageing. 2010;39(4):412-423. 342
3. Fielding RA, Vellas B, Evans WJ, et al. Sarcopenia: an undiagnosed condition in 343
older adults. Current consensus definition: prevalence, etiology, and 344
consequences. International working group on sarcopenia. J Am Med Dir Assoc. 345
2011;12(4):249-256. 346
4. Guralnik JM, Simonsick EM, Ferrucci L, et al. A short physical performance 347
battery assessing lower extremity function: association with self-reported 348
disability and prediction of mortality and nursing home admission. J Gerontol. 349
1994;49(2):M85-94. 350
5. Janssen I, Heymsfield SB, Ross R. Low relative skeletal muscle mass (sarcopenia) 351
in older persons is associated with functional impairment and physical disability. J 352
Am Geriatr Soc. 2002;50(5):889-896. 353
6. Ostchega Y, Dillon CF, Lindle R, Carroll M, Hurley BF. Isokinetic leg muscle 354
strength in older americans and its relationship to a standardized walk test: data 355
from the national health and nutrition examination survey 1999-2000. J Am 356
Geriatr Soc. 2004;52(6):977-982. 357
7. Hairi NN, Cumming RG, Naganathan V, et al. Loss of muscle strength, mass 358
(sarcopenia), and quality (specific force) and its relationship with functional 359
limitation and physical disability: the Concord Health and Ageing in Men Project. 360
16
8. Foldvari M, Clark M, Laviolette LC, et al. Association of muscle power with 362
functional status in community-dwelling elderly women. J Gerontol A Biol Sci 363
Med Sci. 2000;55(4):M192-199. 364
9. Bean JF, Kiely DK, Herman S, et al. The relationship between leg power and 365
physical performance in mobility-limited older people. J Am Geriatr Soc. 366
2002;50(3):461-467. 367
10. Pahor M, Blair SN, Espeland M, et al. Effects of a physical activity intervention 368
on measures of physical performance: Results of the lifestyle interventions and 369
independence for Elders Pilot (LIFE-P) study. J Gerontol A Biol Sci Med Sci. 370
2006;61(11):1157-1165. 371
11. Vasunilashorn S, Coppin AK, Patel KV, et al. Use of the Short Physical 372
Performance Battery Score to predict loss of ability to walk 400 meters: analysis 373
from the InCHIANTI study. J Gerontol A Biol Sci Med Sci. 2009;64(2):223-229. 374
12. Volpato S, Cavalieri M, Sioulis F, et al. Predictive value of the Short Physical 375
Performance Battery following hospitalization in older patients. J Gerontol A Biol 376
Sci Med Sci. 2011;66(1):89-96. 377
13. Janssen I, Heymsfield SB, Wang ZM, Ross R. Skeletal muscle mass and 378
distribution in 468 men and women aged 18-88 yr. J Appl Physiol. (1985). 379
2000;89(1):81-88. 380
14. D'Antona G, Pellegrino MA, Adami R, et al. The effect of ageing and 381
immobilization on structure and function of human skeletal muscle fibres. J 382
17
15. Miller MS, Toth MJ. Myofilament protein alterations promote physical disability 384
in aging and disease. Exerc Sport Sci Rev. 2013;41(2):93-99. 385
16. Thom JM, Morse CI, Birch KM, Narici MV. Influence of muscle architecture on 386
the torque and power-velocity characteristics of young and elderly men. Eur J 387
Appl Physiol. 2007;100(5):613-619. 388
17. Brown WF. A method for estimating the number of motor units in thenar muscles 389
and the changes in motor unit count with ageing. J Neurol Neurosurg Psychiatry. 390
1972;35(6):845-852. 391
18. Luff AR. Age-associated changes in the innervation of muscle fibers and changes 392
in the mechanical properties of motor units. Ann N Y Acad Sci. 1998; 854(1):92-393
101. 394
19. Tanaka H, Seals DR. Endurance exercise performance in masters athletes: age‐ 395
associated changes and underlying physiological mechanisms. J Physiol. 2008; 396
586(1):55-63. 397
20. Piasecki M, Ireland A, Coulson J, et al. Motor unit number estimates and 398
neuromuscular transmission in the tibialis anterior of master athletes: evidence 399
that athletic older people are not spared from age‐related motor unit remodeling. 400
Physiol Rep. 2016; 4(19):e12987. 401
21. Glenn JM, Vincenzo J, Canella CK, Binns A, Gray M. Habitual and maximal 402
dual-task gait speeds among sedentary, recreationally active, and masters athlete 403
late middle-aged adults. J Aging Phys Act. 2015;23(3):433-437. 404
22. Clark BA. Tests for fitness in older adults: AAHPERD Fitness Task Force. J Phys 405
18
23. Rikli RE, Jones CJ. The reliability and validity of a 6-minute walk test as a 407
measure of physical endurance in older adults. J Aging Phys Act. 1998;6(4):363-408
375. 409
24. Jones CJ, Rikli RE, Beam WC. A 30-s chair-stand test as a measure of lower body 410
strength in community-residing older adults. Res Q Exerc Sport. 1999;70(2):113-411
119. 412
25. Adell E, Wehmhorner S, Rydwik E. The test-retest reliability of 10 meters 413
maximal walking speed in older people living in a residential care unit. J Geriatr 414
Phys Ther. 2013;36(2):74-77. 415
26. Peters DM, Fritz SL, Krotish DE. Assessing the reliability and validity of a shorter 416
walk test compared with the 10-meter walk test for measurements of gait speed in 417
healthy, older adults. J Geriatr Phys Ther. 2013;36(1):24-30. 418
27. Freire AN, Guerra RO, Alvarado B, Guralnik JM, Zunzunegui MV. Validity and 419
reliability of the short physical performance battery in two diverse older adult 420
populations in Quebec and Brazil. J Aging Health. 2012;24(5):863-878. 421
28. Francis P, Toomey C, Mc Cormack W, Lyons M, Jakeman P. Measurement of 422
maximal isometric torque and muscle quality of the knee extensors and flexors in 423
healthy 50- to 70-year-old women. Clin Physiol Funct Imaging. 2016; Epub ahead 424
of print. 425
29. Choquette S, Bouchard D, Doyon C, Sénéchal M, Brochu M, Dionne IJ. Relative 426
strength as a determinant of mobility in elders 67–84 years of age. A nuage study: 427
Nutrition as a determinant of successful aging. J Nutr Health Aging. 428
19
30. Dulac M, Boutros GEH, Pion C, Barbat-Artigas S, Gouspillou G, Aubertin-430
Leheudre M. Is handgrip strength normalized to body weight a useful tool to 431
identify dynapenia and functional incapacity in post-menopausal women? Braz J 432
Phys Ther. 2016; Epub ahead of print. 433
31. Vilaca KH, Alves N, Carneiro JA, Ferriolli E, Lima NK, Moriguti JC. Body 434
composition, muscle strength and quality of active elderly women according to the 435
distance covered in the 6-minute walk test. Braz J Phys Ther. 2013;17(3):289-296. 436
32. Visser M, Goodpaster BH, Kritchevsky SB, et al. Muscle mass, muscle strength, 437
and muscle fat infiltration as predictors of incident mobility limitations in well-438
functioning older persons. J Gerontol A Biol Sci. 2005;60(3):324-333. 439
33. Hicks GE, Shardell M, Alley DE, et al. Absolute strength and loss of strength as 440
predictors of mobility decline in older adults: the InCHIANTI study. J Gerontol A 441
Biol Sci. 2011:67(1):66-73. 442
34. Norton C, Toomey C, McCormack WG, et al. Protein supplementation at 443
breakfast and lunch for 24 weeks beyond habitual intakes increases whole-body 444
lean tissue mass in healthy older adults. J. Nutr. 2016;146(1):65-69. 445
35. Francis P, Mc Cormack W, Toomey C, et al. Twelve weeks’ progressive 446
resistance training combined with protein supplementation beyond habitual 447
intakes increases upper leg lean tissue mass, muscle strength and extended gait 448
speed in healthy older women. Biogerontology. 2016; Epub ahead of print. 449
36. Greig CA, Young A, Skelton DA, Pippet E, Butler FM, Mahmud SM. Exercise 450
20
37. Maffiuletti NA, Bizzini M, Desbrosses K, Babault N, Munzinger U. Reliability of 452
knee extension and flexion measurements using the Con-Trex isokinetic 453
dynamometer. Clin Physiol Funct Imaging. 2007;27(6):346-353. 454
38. Rikli RE, Jones CJ. Functional fitness normative scores for community-residing 455
older adults, ages 60-94. J Aging Phys Act. 1999;7(2):162-181. 456
39. Lindle RS, Metter EJ, Lynch NA, et al. Age and gender comparisons of muscle 457
strength in 654 women and men aged 20-93 yr. J Appl Physiol (1985). 458
1997;83(5):1581-1587. 459
40. Lynch NA, Metter EJ, Lindle RS, et al. Muscle quality. I. Age-associated 460
differences between arm and leg muscle groups. J Appl Physiol (1985). 461
1999;86(1):188-194. 462
41. Buchner DM, Larson EB, Wagner EH, Koepsell TD, de Lateur BJ. Evidence for a 463
non-linear relationship between leg strength and gait speed. Age Ageing. 464
1996;25(5):386-391. 465
42. Packard CJ, Bezlyak V, McLean JS, et al. Early life socioeconomic adversity is 466
associated in adult life with chronic inflammation, carotid atherosclerosis, poorer 467
lung function and decreased cognitive performance: a cross-sectional, population-468
[image:21.595.66.335.629.771.2]based study. BMC Public Health. 2011;17;11(1):42. 469
Table 1. Summary of Demographics of Adult Participants. Demographic 50 – 59y
(n=71)
60 -70y (n=88)
Age, y 55.4 (4.8)
54.4 – 57.3
64.4 (5.0) 62.9 – 65.3 Height, cm 163.3 (10.9)
161.8 – 166.4
164.2 (9.7) 162.0 – 165.7 Body Mass, kg 70.0 (22.4)
65.4 – 75.5
68.2 (17.4) 66.1 – 72.0 BMI, kg/m2 26.0 (5.3)
25.3 – 26.9
21 Values are reported as median (IQR), 95% Bootstrap CI. 470
Table 2. Reliability of Estimate for Functional Performance Measures in Adults Aged 50-70 Years.
Test Day 1
Mean (SD)
Day 2 Mean (SD)
ICC (95% CI)
*% Difference
(P-value)
Habitual Gait Speed (10m), m/s 1.4 (0.2) 1.5 (0.2) 0.714 (0.578 - 0.812) 4.3 (P<0.001)
Maximal Gait Speed (10m), m/s 1.8 (0.2) 1.8 (0.2) 0.767 (0.650 - 0.812) 1.7 (P=0.36)
Chair Rise Time (5x), s 9.3 (2.0) 8.7 (1.8) 0.795 (0.691 - 0.867) -6.5 (P<0.001)
Chair Rise (30s), n 15.5 (3.7) 17.5 (4.4) 0.823 (0.747 - 0.877) 12.9 (P<0.001)
Extended Gait Speed (900m), m/s 2.60 (0.54) 2.68 (0.59) 0.880 (0.811 - 0.925) 3.1 (P=0.028)
*% difference calculated from the differences obtained from the paired sample t-test.
[image:22.595.33.565.375.556.2]471
Table 3. Age-related Difference in Peak Torque (PT)/Body Mass (BM) and Functional Performance in Healthy
50 – 70 year Adults.
Age Range, y PT/BM,
N∙m/kg Gait Speed Habitual (10m), m/s
Maximal Gait Speed (10m), m/s
Chair Rise Time (5x),
s
Extended Gait Speed (900m), m/s
Chair Rise (30s), n
50 – 59 n=71 n=37 n=37 n=71 n=71 n=33
1.5 (0.5) 1.4 – 1.6
1.52 (0.2) 1.46 – 1.56
1.84 (0.18) 1.78 – 1.90
8.2 (2.6)* 7.5 – 8.5
2.56 (0.62) 2.42 – 2.70
22
Values are reported as mean (SD), median (IQR)*, 95% or Boostrap 95% CI, difference (mean or median, 95% 472
CI) and % difference, P-value. 50 – 59y: Male = 11 (900m, 5 times chair rise). 7 (10m gait Speed). 4 (30-second 473
chair rise). 60 – 70y: Male = 18 (900m, 5 times chair rise). 5 (10m gait Speed). 13 (30-second chair rise). 474
475 476
477
y = 0.
0 0.5 1 1.5 2 2.5 3
0 0.5 1 1.5 2 2.5
Ma
xi
mal
G
ai
t
Speed
(10
m)
,
m/
s
Knee Extensor PT / Body Mass (N
y = -1.46
R²
0 2 4 6 8 10 12 14 16 180 0.5 1 1.5 2 2
Chair
Ris
e
Time
(5
x)
, s
Knee Extensor PT / Body Mass
60 – 70 n=88 n=28 n=28 n=88 n=88 n=58
1.3 (0.3) 1.2 – 1.4
1.40 (0.30) 1.40 – 1.50
1.85 (0.23) 1.77 – 1.94
8.8 (2.5)* 8.4 – 9.4
2.27 (0.45) 2.17 – 2.36
14.0 (5.0)* 13.5 – 15.0
Difference 0.2
0.1 – 0.3
-0.12 -0.02 – 0.14
0.01 -0.11 – 0.09
0.6 0.2 – 1.4
0.29 0.12 – 0.46
-2.4 -0.1 – 3.1
[image:23.595.74.539.504.708.2]Difference (%) 14.2% P=0.001 -7.9% P=0.095 0.5% P=0.856 7.3% P=0.008 11.3% P=0.001 14.5% P=0.028
Table 4. The Association between Peak Torque (PT)/Body Mass (BM) and Functional Performance in
Adults Aged 50-70 Years.
Habitual Gait Speed (10m)
Maximal Gait Speed (10m) Chair Rise Time (5x) Extended Gait Speed (900m) Chair Rise (30s) 0.360
(0.122 - 0.581)
0.329
(0.089 - 0.553)
-0.297
(-0.146 - 0.447)
-0.537
(-0.404 - 0.670)
0.226
(0.021 - 0.428)
P= 0.003 P= 0.008 P <0.001 P <0.001 P=0.031
23
Figure 1. The relationship between knee extensor peak torque (PT) normalized for body mass and 478
functional performance measures in healthy 50 – 70 year old adults. 479
480
y = 0.72
R²
0.0 1.0 2.0 3.0 4.0 5.0
0 1 2
Ext
end
ed
G
ai
t
Speed
(90
0m
),
m/
s
Knee Extensor PT / Body Mass
y = 1.
0 5 10 15 20 25 30
0 0.5 1 1.5 2 2