Citation:
Matu, J and O’Hara, J and Hill, N and Clarke, S and Boos, C and Newman, C and Holdsworth, D
and Ispoglou, T and Duckworth, L and Woods, D and Mellor, A and Deighton, K (2017) Changes in
appetite, energy intake, body composition and circulating ghrelin constituents during an incremental
trekking ascent to high altitude. European Journal of Applied Physiology, 117 (9). pp. 1917-1928.
ISSN 1439-6319 DOI: https://doi.org/10.1007/s00421-017-3683-0
Link to Leeds Beckett Repository record:
http://eprints.leedsbeckett.ac.uk/3917/
Document Version:
Article
The aim of the Leeds Beckett Repository is to provide open access to our research, as required by
funder policies and permitted by publishers and copyright law.
The Leeds Beckett repository holds a wide range of publications, each of which has been
checked for copyright and the relevant embargo period has been applied by the Research Services
team.
We operate on a standard take-down policy.
If you are the author or publisher of an output
and you would like it removed from the repository, please
contact us
and we will investigate on a
case-by-case basis.
1
TITLE: Changes in appetite, energy intake, body composition and circulating ghrelin constituents during an1
incremental trekking ascent to high altitude
2
AUTHOR NAMES: Jamie Matu1, John O’Hara1, Neil Hill2,4, Sarah Clarke1, Christopher Boos1,3, Caroline
3
Newman4, David Holdsworth4, Theocharis Ispoglou1, Lauren Duckworth1, David Woods1,4, Adrian Mellor1,4, and
4
Kevin Deighton1
5
DEPARTMENT AND INSTITUTION:
6
1Institute for Sport Physical Activity & Leisure, Leeds Beckett University, Leeds, UK
7
2Section of Investigative Medicine, Imperial College London, London, UK
8
3Poole Hospital NHS Trust, Longfleet Rd, Poole, UK
9
4 Royal Centre for Defence Medicine, ICT Building, Vincent Drive, Birmingham, UK
10
CORRESPONDING AUTHOR: Dr Kevin Deighton, Institute for Sport Physical Activity & Leisure, Leeds
11
Beckett University, Leeds, LS6 3QS, United Kingdom (email: K.Deighton@leedsbeckett.ac.uk). ORCID:
0000-12
0001-7994-2137.
13
TELEPHONE NUMBER: +44 (0)113 8123582
14
15
16
17
18
19
20
2
ABSTRACT22
Purpose: Circulating acylated ghrelin concentrations are associated with altitude-induced anorexia in laboratory
23
environments, but have never been measured at terrestrial altitude. This study examined time course changes in
24
appetite, energy intake, body composition and ghrelin constituents during a high altitude trek. Methods: Twelve
25
participants (age: 28(4) years, BMI: 23.0(2.1)kg.m-2) completed a 14-day trek in the Himalayas. Energy intake,
26
appetite perceptions, body composition, and circulating acylated, des-acylated and total ghrelin concentrations
27
were assessed at baseline (113m; 12 days prior to departure) and at three fixed research camps during the trek
28
(3619m, day seven; 4600m, day 10; 5140m, day 12). Results: Relative to baseline, energy intake was lower at
29
3619m (P=0.038) and 5140m (P=0.016) and tended to be lower at 4600m (P=0.056). Appetite perceptions were
30
lower at 5140m (P=0.027) compared with baseline. Acylated ghrelin concentrations were lower at 3619m
31
(P=0.046) and 4600m (P=0.038), and tended to be lower at 5140m (P=0.070), compared with baseline.
Des-32
acylated ghrelin concentrations did not significantly change during the trek (P=0.177). Total ghrelin
33
concentrations decreased from baseline to 4600m (P=0.045). Skinfold thickness was lower at all points during the
34
trek compared with baseline (P≤0.001) and calf girth decreased incrementally during the trek (P=0.010).
35
Conclusions: Changes in plasma acylated and total ghrelin concentrations may contribute to the suppression of
36
appetite and energy intake at altitude but differences in the time course of these responses suggests that additional
37
factors are also involved. Interventions are required to maintain appetite and energy balance during trekking at
38
terrestrial altitudes.
39
KEYWORDS: ghrelin; hypoxia; altitude-induced anorexia; terrestrial altitude
40
3
Abbreviations42
AG:DG Acylated ghrelin to des-acylated ghrelin ratio
AMS Acute mountain sickness
ANOVA Analysis of variance
BMI Body mass index
CAS Composite appetite score
GOAT Ghrelin-O-acyltransferase
ISAK International Society for the Advancement of
Kinanthropometry
LLS Lake Louise Score
MoDREC Ministry of Defence Research Ethics Committee
RPE Rating of perceived exertion
SD Standard deviation
SE Standard error
SpO2 Arterial oxygen saturations
VAS Visual analogue scales
43
4
INTRODUCTION45
Acute exposure to hypoxic environments has been demonstrated to supress appetite and energy intake (Armellini
46
et al. 1997; Matu et al. 2017; Wasse et al. 2012; Westerterp et al. 2000). This effect appears to be maintained
47
during prolonged sojourns to high altitude, which results in significant decreases in body mass, of which greater
48
than 50 % is from fat-free mass (Rose et al. 1988; Sergi et al. 2010). These declines in lean mass will likely lead
49
to a drop in physical capabilities at altitude (Sergi et al. 2010), which can have deleterious implications for
50
individuals ascending to high altitude. A better understanding of the time course of these changes during a trek,
51
as well as the mechanisms involved, is required to develop guidance for those travelling to high altitudes.
52
Over the past twenty years, changes in the circulating concentrations of gastrointestinal hormones and
53
leptin have been implicated as potential mechanisms for the alterations in appetite and energy intake at altitude.
54
However, although several hormones such as pancreatic polypeptide (Riepl et al. 2012), leptin (Sierra-Johnson et
55
al. 2008), glucagon-like-peptide-1 (Snyder et al. 2008) and total ghrelin (Benso et al. 2007; Riepl et al. 2012;
56
Shukla et al. 2005) have been measured in response to terrestrial altitude exposure, the findings remain equivocal.
57
One major limitation of the current research is the measurement of total ghrelin concentrations at altitude, rather
58
than the constituent components of acylated and des-acylated ghrelin which have opposing effects on appetite
59
regulation (Fernandez et al. 2016). The differentiation of ghrelin constituents in response to terrestrial altitude is
60
imperative as acylated ghrelin has been found to be particularly responsive to hypoxic exposure in a laboratory
61
environment with decreases in this hormone correlated with a reduction in appetite (Bailey et al. 2015) and energy
62
intake (Wasse et al. 2012). Furthermore, recent evidence suggests that des-acylated ghrelin may inhibit the
63
orexigenic effects of acylated ghrelin (Fernandez et al. 2016), which further emphasises the need to measure both
64
hormones as well as the ratio between the two (Al Massadi et al. 2014). It seems feasible that the measurement of
65
total ghrelin in previous research (Benso et al. 2007; Debevec et al. 2014; Riepl et al. 2012) may have masked
66
changes in acylated and des-acylated ghrelin, which may explain the lack of association between changes in
67
appetite and circulating ghrelin concentrations at altitude.
68
Although circulating total ghrelin concentrations have been extensively investigated in response to
69
hypoxic exposure (Benso et al. 2007; Debevec et al. 2014; Debevec et al. 2016; Mekjavic et al. 2016; Riepl et al.
70
2012; Shukla et al. 2005), the investigation of acylated ghrelin is currently limited to four studies, all of which
71
lasted for ≤ 7 h and were all conducted in normobaric environments (Bailey et al. 2015; Matu et al. 2017;
72
5
greater mechanistic understanding, further field studies are required to assess the combined effects of trekking,74
gradual ascent and other environmental stimuli such as cold exposure which occur during real life ascent to high
75
altitude. The measurement of acylated and des-acylated ghrelin during ascent to terrestrial altitude is vital to
76
understand the changes that occur during a real-world environment and the importance of these changes as a basis
77
for the development of future interventions. The lack of investigation into the constituents of total ghrelin to date
78
is likely due to the complexities of the necessary chemical preparation required to prevent the degradation of the
79
analytes (Hosoda et al. 2004), which is particularly difficult to achieve in an extreme field environment.
80
The purpose of this study was to investigate the effects of a high altitude trek to 5300 m on appetite,
81
energy intake and body composition responses in healthy men and women, with a further focus on circulating
82
acylated and des-acylated ghrelin concentrations as mechanistic variables. These data provide novel insights into
83
the time course of changes in appetite, energy intake and body composition during a real-life ascent to high
84
altitude. This study also provides a better understanding of the mechanisms responsible for altitude-induced
85
anorexia, representing the first investigation of acylated ghrelin and des-acylated ghrelin at terrestrial altitude. We
86
hypothesised that exposure to increasingly high altitudes would suppress appetite, circulating acylated ghrelin
87
concentrations and energy intake, which would be associated with a reduction in lean and total body mass.
88
6
METHODS90
Participants. This study was conducted according to the guidelines laid down in the Declaration of
91
Helsinki and all procedures were approved by the Ethics Advisory Committee at Leeds Beckett University and
92
the Ministry of Defence Research Ethics Committee (MoDREC; protocol number 624). Twelve members (nine
93
male, three female) of the British Military volunteered to participate in this study. Informed consent was obtained
94
from all participants included in the study. All participants were non-smokers, had no known disease, allergies or
95
intolerances, and had not been to an altitude over 1000 m for at least 3 months. All participants were physically
96
fit and could run 2.4 km on a treadmill at a 2 % gradient in under 13 minutes 37 seconds in accordance with
97
military requirements. The physical characteristics of participants (mean (SD)) were as follows: age 28 (4) years,
98
body mass 71.3 (10.3) kg, body mass index (BMI) 23.0 (2.1) kg.m-2.
99
Study design. This study represents part of the ‘British Services Dhaulagiri Medical Research
100
Expedition’ which took place in March – May 2016 (Mellor et al. 2017). In April 2016, participants in the present
101
study travelled from the UK to Nepal and completed a 14-day trek around the Dhaulagiri circuit in the Himalayas.
102
Travel from the UK to Nepal lasted for one day and participants were in Nepal for three days prior to starting the
103
trek. The trek commenced from Darbang (~1100 m), peaked on day 11 at the French Pass (~5300 m) and ended
104
on day 14 at Marpha (~2700 m). Pre-planned rest days were included at fixed camps at 3619 m (Camp 1; day
105
seven), 4600 m (Camp 2; day 10) and 5140 m (Camp 3; day 12). Participants walked a mean distance of 8.2
106
km.day-1 with a mean elevation gain of 471 m.day-1 whilst carrying a day pack weighing ~ 5 kg. Further
107
information about the ascent profile and trek characteristics has been published elsewhere (Mellor et al. 2017).
108
Data collection took place at baseline (113m; 12 days prior to departure from the UK) and at each fixed camp. On
109
the day preceding data collection at camp 1, camp 2 and camp 3 participants walked 4.3 km, 4.3 km and 9.1 km
110
and gained an elevation of 512 m, 528 m and 540 m, respectively. All trekking on these days was completed by
111
5pm. All participants wore the same type of clothing throughout the trek and experienced the same degree of cold
112
exposure. Baseline measurements were collected in the laboratories at Leeds Beckett University and the measures
113
at each camp were collected in a designated research tent. At the time data was collected ambient temperatures in
114
the laboratory and research tents were 19.8 °C, 4.9 °C, 1.2 °C and -6.4 °C at baseline, 3619 m, 4600 m and 5140
115
m, respectively. All participants remained rested on the day of testing. Participants were staggered for the
116
collection of all measurements between 7 am and 10 am, with each participant having their measures taken at a
117
7
Food Provision. Throughout the trek all food and fluid was available ad libitum, and was provided by119
Nepalese cooks and staff who accompanied the trekking team. Typical foods offered at each meal were as follows:
120
Breakfast – cereals, porridge, omelette, pancakes; Lunch – noodles, meats, soup, beans, vegetables, fruit; Dinner
121
– curry, pasta, pizza, potatoes, dumplings, cheese, vegetables; Snacks – chocolate bars, biscuits, cake, fruit. At all
122
meals participants were given more than one option and thus could decide what they wanted to eat. The mean
123
(SD) macronutrient composition of the food consumed during the trek was 49.0 (6.6) % carbohydrate, 36.3 (6.2)
124
% fat and 14.7 (2.6) % protein, respectively.
125
Food intake. Energy intake was assessed at baseline via a 24-hour dietary recall interview by an
126
experienced researcher (Academic Associate of the Sport and Exercise Nutrition Register) using the multiple-pass
127
approach (Guenther et al. 1997). In addition to collecting dietary intake information, this approach was used to
128
demonstrate the level of detail required from the participants when completing a food diary during the trek. All
129
participants completed a food diary on the day preceding each fixed camp and this process was monitored and
130
verified by the same experienced researcher throughout the trek. Although there are acknowledged limitations of
131
self-reported dietary intake methods (Hill and Davies 2001), the oversight of food diaries by the researcher present
132
on the trek ensured accurate completion of all food diaries. Food intake was monitored during the day before each
133
fixed camp to consider acute dietary changes when interpreting the data for fasted appetite ratings and blood
134
samples at the fixed camps. The palatability of each meal consumed was measured using 100 mm visual analogue
135
scales (VAS) with the anchors “the worst taste that I have ever experienced” and “the best taste that I have ever
136
experienced” at each end of the scale. A mean palatability score was calculated for each day to control for any
137
influence of palatability on food consumption.
138
Appetite. Appetite perceptions were measured after an overnight fast at baseline and upon waking at
139
each fixed camp using validated 100 mm VAS for hunger, satisfaction, fullness and prospective food consumption
140
(PFC) (Flint et al. 2000). Using these scales, a composite appetite score (CAS) was calculated using the following
141
formula: composite appetite score = ([hunger + prospective food consumption + (100 – fullness) + (100 –
142
satisfaction)] / 4) (Stubbs et al. 2000). A higher value is associated with a greater appetite sensation and
143
subsequently a stronger motivation to eat. In addition, the extent to which participants desired sweet, salty,
144
savoury, and fatty foods was assessed using VAS anchored at each end with “yes, very much” and “no, not at all”.
145
Acute Mountain Sickness, oxygen saturation and rating of perceived exertion. Acute mountain
146
8
1993); mild AMS was defined as LLS of ≥3 in the presence of a headache and severe AMS was defined as LLS148
of ≥6 in the presence of a headache. Arterial oxygen saturations (SpO2) were measured via a fingertip pulse
149
oximeter (Nellcor™ PM10N; Medtronic, Minneapolis, MN) every morning and evening while the participants
150
were resting in a seated position. Rating of perceived exertion (RPE) (Borg 1982) was recorded as the hardest
151
exertion experienced during the day of trekking preceding each fixed camp, as used previously in similar
152
environments (Mellor et al. 2014).
153
Body composition. Participants were weighed at baseline and each fixed camp in a fasted state whilst
154
wearing minimal clothing and no footwear. A portable multicomponent force plate (Kistler, Switzerland) was
155
used and was stabilised on the mountain using specialised levelling feet (JVD Design & Automation Ltd, Leeds,
156
UK). Skinfolds of the triceps, subscapular, biceps, iliac crest, supraspinale, abdominal, front thigh and medial calf
157
were measured using calibrated Harpenden callipers (John Bull, British Indicators, West Sussex, UK) to the
158
nearest 0.1 mm. The sum of skinfolds was calculated by the addition of each of the eight skinfold values in mm.
159
Girth measurements of the waist and calf, as well as the upper arm in a relaxed and flexed state, were obtained
160
using a steel anthropometric tape (Lufkin W606PM, Cooper Hand Tools, Tyne & Wear, UK) to the nearest 1 mm.
161
All anthropometric assessments were conducted by one researcher who was trained by an individual accredited
162
by the International Society for the Advancement of Kinanthropometry (ISAK). All measures were conducted in
163
duplicate and in accordance with ISAK guidelines on the right side of the body. The coefficient of variation for
164
skinfolds and girths was 2.2% and 0.4%, respectively.
165
Blood sampling. Venous blood samples were obtained from an antecubital vein via venepuncture using
166
a 21-gauge butterfly needle (Safety-Lok™; BD, Oxford, UK). Samples were collected at baseline and at all
167
research camps with participants in a fasted state. One 4.9 mL pre-cooled EDTA monovette (Sarstedt, Leicester,
168
UK) was used to obtain samples for the determination of plasma acylated and des-acylated ghrelin concentrations.
169
Monovettes were pre-treated on the morning of testing, to prevent the degradation of acylated ghrelin, with 50µl
170
of a solution containing p-hydroxymercuribenzoic acid, potassium phosphate buffer and sodium hydroxide
171
(Hosoda et al. 2004). Immediately after filling, the tube was spun at 1500 x g for 10 minutes in a centrifuge
172
(CompactStar CS4, VWR). Subsequently 1 mL of plasma was mixed with 100µl of 1M hydrochloric acid. This
173
solution was then immediately frozen at either -20°C in a freezer (for baseline measurements) or within a dry
174
shipper containing liquid nitrogen at <-80°C (at each fixed camp) before being transferred to a -80°C freezer at
175
the university and stored until analysis. Plasma volume changes as a result of altitude exposure were not assessed
176
9
response at that specific time (Kargotich et al. 1998). However, to prevent any extraneous influences from postural178
changes, all blood samples were collected after the participant had been seated for at least 5 minutes (Fawcett and
179
Wynn 1960).
180
Blood analyses. Commercially available enzyme immunoassays were used to determine plasma
181
concentrations of acylated and des-acylated ghrelin (SPI BIO, Montigny Le Bretonneux, France). To eliminate
182
interassay variation, all samples from each participant were analysed on the same plate. In addition, all samples
183
were analysed in duplicate and on the same day. The within batch coefficients of variation were 2.5% for acylated
184
ghrelin and 2.4% for acylated ghrelin. Total ghrelin was computed via the addition of acylated and
des-185
acylated ghrelin concentrations. The ratio between acylated ghrelin and des-acylated ghrelin concentrations
186
(AG:DG) was calculated as acylated ghrelin divided by des-acylated ghrelin, as previously described (Delhanty
187
et al. 2015).
188
Statistical analysis. Data are expressed as mean (SD) in text and tables and mean (SE) in figures to
189
avoid distortion of the graphs. Diet records were inputted into Nutritics dietary analysis software (v1.8 for
190
Windows; Nutritics, Dublin) to assess energy intake. All data were analysed using IBM SPSS statistics (v22.0 for
191
Windows; SPSS, Chicago, IL). One way repeated measures analysis of variance (ANOVA) was used to assess
192
altitude-based differences in SpO2, AMS scores, RPE scores, body composition measures, appetite perceptions,
193
energy intake, fluid intake and plasma ghrelin concentrations. Significant effects were further explored using
194
Student’s paired t tests. Effect sizes are presented as Cohen’s d and interpreted as ≤ 0.2 trivial, > 0.2 small, > 0.6
195
moderate, > 1.2 large, > 2 very large and > 4 extremely large (Hopkins 2004). The Pearson product moment
196
correlation coefficient was used to investigate relationships between variables at each altitude. The exclusion of
197
participants reporting AMS did not alter the interpretation of the findings; subsequently all participants were
198
included in the data analysis. Based on evidence that males and females exhibit similar appetite, energy intake
199
and gut hormone responses to exercise- and diet-induced energy deficits (Alajmi et al. 2016), data from both
200
genders were combined for analyses. The sample size used within this study was deemed sufficient to detect a
201
significant difference in energy intake between altitudes. The anticipated effect size for a difference in energy
202
intake was based on a similar previous study which investigated energy intake in individuals climbing at
203
approximately 4500 m for 16 days (Armellini et al. 1997). Based on the effect size and an alpha value of 5 %, a
204
sample size of 12 participants would generate a power >95 %. Calculations were performed using G*power (v3
205
10
RESULTS207
Measurements of SpO2, AMS, RPE, body composition, fluid intake and energy intake were successfully obtained
208
from all 12 participants. One male participant withdrew consent for blood sampling at the research camps during
209
the trek and one male participant did not complete the appetite perception measurements during the trek.
210
Therefore, data is presented for 11 participants for plasma hormone concentrations and appetite perceptions.
211
212
Oxygen saturations, acute mountain sickness and rating of perceived exertion. One way ANOVA
213
revealed a main effect of altitude for SpO2 (P <0.001). Post-hoc analysis demonstrated lower SpO2 at each fixed
214
camp compared with the previous location (baseline: 98.4 (0.9) %; 3619 m: 92.4 (2.5) %, P < 0.001, d = 3.19;
215
4600 m: 83.5 (4.1) %, P < 0.001, d = 2.62; 5140 m: 79.8 (5.6) %, P = 0.007, d = 0.75). A positive diagnosis of
216
mild AMS was reported in 50% of participants at some point during the trek. The first incidence of AMS occurred
217
on the eighth day of the trek (the day after the first rest day; 4072 m). Incidence of AMS at the four fixed locations
218
was as follows: baseline: zero participants; 3619 m: zero participants; 4600 m: two participants; and 5140 m: two
219
participants. One way ANOVA revealed a significant effect of altitude for RPE (P < 0.001). Relative to 3619 m
220
(11.8 (1.5)), RPE was significantly higher at 4600 m (13.3 (1.5), P = 0.009, d = 1.01) and relative to 4600 m RPE
221
was significantly higher at 5140 m (16.5 (2.5), P = 0.003, d = 1.58).
222
223
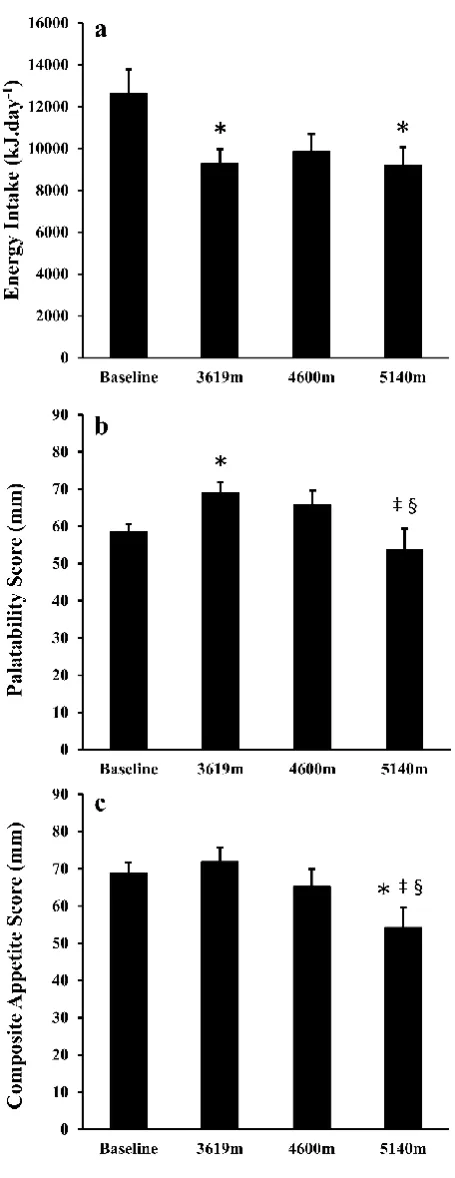
Energy and fluid intake. One way ANOVA revealed a significant effect of altitude for energy intake
224
(P = 0.015). Relative to baseline, energy intake was significantly lower at 3619 m (P = 0.038, d = 1.05) and 5140
225
m (P = 0.016, d = 1.00) and tended to be lower at 4600 m (P = 0.056, d = 0.82). There were no differences observed
226
between research camps during the trek (all P ≥ 0.333, d ≤ 0.22) (Figure 1a).
227
One way ANOVA revealed a main effect of altitude for fluid intake (P = 0.029). Relative to baseline
228
(2769 (1156) mL.day-1) fluid intake was significantly higher at 3619 m (4438 (1847) mL.day-1, P = 0.008, d =
229
1.08) and 4600 m (4236 (2120) mL.day-1, P = 0.027, d = 0.86), but not significantly higher at 5140 m (3645 (2026)
230
mL.day-1, P = 0.126, d = 0.53). There were no differences observed between camps (all P ≥ 0.266, d ≤ 0.29).
231
One way ANOVA revealed a main effect of altitude for the daily palatability of food consumed (P =
232
0.018). Relative to baseline, palatability was significantly higher at 3619 m (P = 0.030, d = 1.17). However,
233
11
baseline. Palatability was significantly lower at 5140 m compared with 3619 m (P = 0.020, d = 0.97) and 4600 m235
(P = 0.013, d = 0.71) (Figure 1b).
236
One way ANOVA revealed a main effect of altitude on the desire to eat salty (P = 0.025) and savoury (P
237
< 0.001) foods, but not sweet (P = 0.604) or fatty (P = 0.354) foods. Relative to baseline (67 (12) mm), the desire
238
to eat salty foods was significantly lower at 3619 m (41 (23) mm, P = 0.018, d = 1.42) and 5140 m (39 (27) mm,
239
P = 0.024, d = 1.38), and also tended to be lower at 4600 m (45 (27) mm, P = 0.066, d = 1.09). There were no
240
differences observed between camps (all P ≥ 0.159, d ≤ 0.22). The desire to eat savoury foods was significantly
241
increased at 3619 m (70 (13) mm, P < 0.001, d = 2.41), 4600 m (67 (15) mm, P < 0.001, d = 2.03) and 5140 m
242
(53 (19) mm, P = 0.011, d = 1.08) compared with baseline (33 (18) mm). In addition, the desire to eat savoury
243
foods reduced significantly from 4600 m to 5140 m (P = 0.026, d = 0.79) with no difference observed between
244
3619 m and 4600 m (P = 0.516, d = 0.23).
245
246
Appetite perceptions. One way ANOVA revealed a main effect of altitude for CAS (P = 0.005).
Post-247
hoc analysis revealed that CAS was significantly lower at 5140 m compared with baseline (P = 0.027, d = 1.07),
248
3619 m (P = 0.005, d = 1.19) and 4600 m (P = 0.05, d = 0.69). No other differences were observed between
249
altitudes (all P ≥ 0.116, d ≤ 0.48) (Figure 1c).
250
251
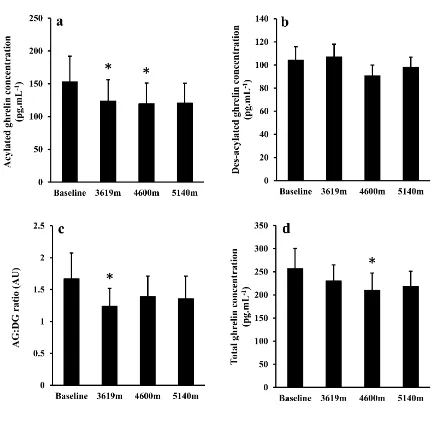
Plasma acylated and des-acylated ghrelin concentrations. One way ANOVA revealed a significant
252
effect of altitude for plasma acylated ghrelin concentrations (P = 0.048; Figure 2a), plasma total ghrelin
253
concentrations (P = 0.047; Figure 2d) and the AG:DG ratio (P = 0.046; Figure 2c). A main effect of altitude was
254
not detected for plasma des-acylated ghrelin concentrations (P = 0.177; Figure 2b).
255
Relative to baseline, plasma acylated ghrelin concentrations were significantly lower at 3619 m (P =
256
0.046, d = 0.25) and 4600 m (P = 0.038, d = 0.29), and tended to be lower at 5140 m (P = 0.070, d = 0.28). There
257
were no differences observed between camps (all P ≥ 0.512, d ≤ 0.04; Figure 2a). Plasma AG:DG ratio decreased
258
significantly from baseline to 3619 m (P = 0.034, d = 0.37), and tended to be lower than baseline at 4600 m (P =
259
0.069, d = 0.23) and 5140 m (P = 0.070, d = 0.25). There were no differences observed between camps (all P ≥
260
12
(P = 0.045, d = 0.36), however no other significant differences were observed between altitudes (all P ≥ 0.111, d262
≤ 0.31) (Figure 2d).
263
264
Body composition. One way ANOVA revealed a significant effect of altitude for body mass (P < 0.001),
265
sum of skinfolds (P < 0.001), calf girth (P = 0.010), waist girth (P = 0.016) and relaxed arm girth (P = 0.029), with
266
no significant differences observed for flexed arm girth (P = 0.173) (Table 1).
267
Body mass increased from baseline to 3619 m (P = 0.002, d = 0.18), decreased between 3619 m and
268
4600 m (P < 0.001, d = 0.22) and did not change between 4600 m and 5140 m (P = 0.415, d = 0.03). Sum of
269
skinfolds was lower at 3619 m (P = 0.001, d = 0.30), 4600 m (P < 0.001, d = 0.34) and 5140 m (P = 0.001, d =
270
0.24) compared with baseline. There were no significant differences observed between each of the camps during
271
the trek (all P ≥ 0.116, d ≤ 0.09).
272
Calf girth did not differ significantly between baseline and 3619 m (P = 0.127, d = 0.30), however was
273
significantly decreased at 4600 m (P = 0.039, d = 0.44) and 5140 m (P = 0.008, d = 0.60) compared with baseline.
274
Calf girth was also significantly lower at 4600 m compared with 3619 m (P = 0.031, d = 0.14), and tended to be
275
lower at 5140 m compared with 4600 m (P = 0.069, d = 0.14). Waist girth did not differ between baseline and any
276
of the three camps (all P ≥ 0.122, d ≤ 0.15), however was significantly lower at 5140 m than 3619 m (P < 0.001,
277
d = 0.29) and 4600 m (P = 0.04, d = 0.13). Relaxed arm girth was significantly lower at 3619 m (P = 0.022, d =
278
0.30) and 4600 m (P = 0.047, d =0.23) and tended to be lower at 5140 m (P = 0.073, d = 0.20) compared with
279
baseline. There was a significant increase in relaxed arm girth between 3619 m and 5140 m (P = 0.047, d = 0.10),
280
with no other differences observed between camps (all P ≥ 0.191, d ≤ 0.07).
281
282
Correlations. There were no correlations observed at any altitude between energy intake and CAS (all r
283
≤ 0.311, P ≥ 0.352). At 3619 m CAS tended to be associated with plasma acylated ghrelin (r = 0.603, P = 0.065)
284
and total ghrelin (r = 0.626, P = 0.053) concentrations. Additionally, at 3619 m energy intake was significantly
285
correlated with des-acylated ghrelin concentrations (r = 0.686, P = 0.029). At 4600 m CAS was significantly
286
correlated with acylated ghrelin concentrations (r = 0.633, P = 0.049) and the AG:DG ratio (r = 0.667, P = 0.035).
287
There were no other significant correlations observed between any variable, at any altitude (all r ≤ 0.511, P ≥
288
13
290
DISCUSSION
291
This study presents an assessment of the changes in appetite perceptions, energy intake, body composition, and
292
ghrelin constituents throughout a trek to high terrestrial altitude. The findings demonstrate a reduction in energy
293
intake and skinfold thickness during the trek, with a progressive reduction in appetite at increasing altitudes. This
294
study provides the first investigation of acylated ghrelin and des-acylated ghrelin concentrations at terrestrial
295
altitude and demonstrates a suppression of acylated- but not des-acylated ghrelin during the trek. These findings
296
highlight the importance of measuring ghrelin constituents in addition to total ghrelin concentrations as small
297
fluctuations in des-acylated ghrelin may mask changes in acylated ghrelin if only total ghrelin were to be
298
measured. This phenomenon would have occurred at 3619 m in the present study as observed by a significant
299
decrease in acylated ghrelin levels in the absence of any significant changes in des-acylated and total ghrelin
300
concentrations. The findings from this study also demonstrate the need for interventions to maintain appetite
301
during exposure to terrestrial altitudes, particularly above 4600 m.
302
In the present study energy intake was reduced by 27 % (9326 kJ) at 3619 m, 22 % (9886 kJ) at 4600 m,
303
and 27 % (9238 kJ) at 5140 m compared with baseline, which substantiates previous findings at similar altitudes.
304
Armellini et al. (1997) observed a 29 % decrease in energy intake in individuals climbing at approximately 4500
305
m for 16 days, whilst Aeberli et al. (2013) demonstrated a 32 % reduction in energy intake two days after rapid
306
ascent to 4559 m. One study however, found that energy intake, as well as fat and muscle mass, could be
307
maintained up to an altitude of 5050 m when a wide choice of palatable foods were available in a comfortable
308
setting (Kayser et al. 1993). It may therefore be argued that the reduction in energy intake in the present study
309
was caused by a lack of food availability and reduced palatability of food whilst trekking in a foreign country.
310
However, at 3619 m, energy intake was significantly supressed compared with baseline while food was widely
311
available and the mean palatability of the food consumed was significantly higher than baseline. These findings
312
agree with those of Rose et al. (1988) who found a significant reduction in ad-libitum energy intake during a
313
simulated ascent of Mount Everest, despite a variety of palatable foods being available. Despite the reduction in
314
energy intake, fasting appetite perceptions were similar between baseline and 3619 m, which suggests a greater
315
satiating effect of the energy consumed. This response was maintained at 4600 m but appetite perceptions
316
decreased significantly at 5140 m despite consistent food intake. Observations during the trek suggested that
317
14
physical performance. This would support the observation that food intake was similar between the three camps319
but that appetite perceptions and the desire for foods decreased with increasing altitude. This mismatch between
320
appetite perceptions and energy intake is further supported by the lack of correlation between the two variables at
321
each altitude. The reduced palatability of the foods consumed at 5140 m also supports a reduction in appetite, and
322
occurred despite the same ad libitum food provision throughout the trek. This effect accords with the findings
323
from previous animal studies which suggest that hypoxia degrades the taste of food (Ettinger and Staddon 1982).
324
Considering the significant suppression of appetite at 5140 m, it is unclear whether food intakes could continue
325
to be maintained over a more prolonged period and targeted interventions to better maintain appetite above 4600
326
m may be beneficial.
327
From a mechanistic perspective, trekking to high altitude induced a suppression of acylated but not
des-328
acylated ghrelin concentrations, which resulted in a suppression of total ghrelin levels and the AG:DG ratio.
329
However at 5140 m, the only altitude in which CAS was significantly supressed, no correlations were observed
330
between any blood marker and CAS or energy intake. These findings suggest that appetite regulation during
high-331
altitude trekking may be influenced by other hormonal (e.g. leptin, glucagon-like peptide-1 and peptide YY
332
(Debevec 2017)) and non-hormonal (e.g. taste degradation (Ettinger and Staddon 1982) potentially altering food
333
reward (Berthoud 2006)) factors. Appetite regulation is a complex multifaceted system which involves the
334
integration of a wide range of neuroendocrine and psychological factors (Murphy and Bloom 2006). Subsequently,
335
appetite suppression at altitude is unlikely to be solely explained by the measurement of a single hormone.
336
However, a better understanding of the neuroendocrine responses to high altitude trekking could be beneficial in
337
the design of interventions to minimise appetite suppression at altitude.
338
The reductions in fasted acylated and total ghrelin concentrations, the day after significantly reduced
339
energy intakes compared with baseline measurements, are particularly interesting considering the evidence that
340
ghrelin levels and appetite perceptions increase in response to reduced food intake at sea level (Alajmi et al. 2016).
341
Furthermore, acylated ghrelin levels remained depressed during the trek despite reductions in body mass between
342
3619 m and 4600 m and the established inverse relationship between body mass and ghrelin concentrations at sea
343
level (Chen et al. 2009; Shiiya et al. 2002). These observations suggest that the reductions in acylated and total
344
ghrelin during this study were genuine effects of high altitude exposure rather than being secondary to any changes
345
in food intake or body composition. Although these changes in ghrelin were small, they appear to be
346
physiologically relevant as changes of this magnitude have previously been associated with reductions in appetite
347
15
future research to attempt to increase circulating plasma acylated ghrelin concentrations at altitude, in order to349
quantify these effects on appetite responses. Potential methods of accomplishing this include ghrelin infusion
350
(Druce et al. 2005) or dietary interventions to manipulate ghrelin constituents (e.g. increased medium chain
351
triglyceride intake as a substrate for ghrelin acylation (Kawai et al. 2017; Nishi et al. 2005)).
352
The reasons for the observed suppression of acylated ghrelin at altitude are unclear. However,
353
considering the lack of change in total ghrelin levels at 3619 m, it seems plausible that the post-translational
354
acylation of ghrelin may have been inhibited during the early stages of the trek due to inhibited
ghrelin-O-355
acyltransferase (GOAT) activity or reduced availability of medium chain fatty acids as the substrate for acylation
356
(Nishi et al. 2005). Alternatively, the reduction in both acylated ghrelin and total ghrelin at 4600 m suggests
357
inhibited secretion of ghrelin from the P/D1 cells of the stomach (Kojima et al. 1999). A reduction in gut blood
358
flow at altitude (Loshbaugh et al. 2006) has also been proposed to reduce ghrelin concentrations (Wasse et al.
359
2012), however this concept has been disputed (Kalson et al. 2010; Mekjavic et al. 2016). The depression of
360
acylated ghrelin levels prior to the depression of total ghrelin levels at the subsequent research camp suggests that
361
acylated ghrelin may be a more sensitive measure of altered appetite signalling at altitude. Furthermore, the
362
AG:DG ratio of >1 in the present study supports recent data that acylated ghrelin constitutes a much larger
363
proportion of total ghrelin than previously thought (Delhanty et al. 2015) and demonstrates that preservation of
364
this peptide can be achieved during field research in extreme environments.
365
In accordance with previous research, considerable changes in body composition were observed during
366
the trek. This includes a mean reduction in body mass of 2.3 kg in the three days between 3619 m and 4600 m,
367
which was associated with significant decreases in calf girth despite very high levels of physical activity (mean
368
distance walked: 8.8 km.day-1, mean elevation gain: 491 m.day-1). It seems likely that the reductions in body mass
369
were not only caused by decreases in energy intake, but also by increases in energy expenditure due to the high
370
altitude environment and high physical activity levels. Such decreases in body and muscle mass have been
371
observed in previous altitude research (Benso et al. 2007; Rose et al. 1988; Shukla et al. 2005; Westerterp et al.
372
2000) and it is likely that these losses would impair physical performance in these environments (Sergi et al.
373
2010). The further reductions in calf girth between 3619 m and 5140 m also aligns with previous research (Rose
374
et al. 1988) but the reasons for this response are unknown. We speculate that an increase in protein degradation
375
may have occurred due to increasing altitude exposure (Holm et al. 2010). However, contrary to these changes in
376
calf girth, an increase in relaxed arm girth was observed between 3619 m and 5140 m. Although this increase was
377
16
to the significant reduction in arm girth between baseline and 3619 m which is most likely due to atrophy caused379
by reduced activity of the arms during final preparations and low altitude trekking. Despite these insights into
380
changes in body composition, it must be acknowledged that the baseline measures were collected 12 days before
381
departure from the UK, which may have confounded comparisons between baseline values and those obtained
382
during the trek due to changes in body composition during the final preparations for the expedition. Potential
383
increases in lean body mass from final preparations and reductions in body fat would support the observed increase
384
in body mass at the first fixed camp and reduced skinfold values at all camps relative to baseline. At sea level, an
385
increase in body mass would usually result in a reduction in acylated ghrelin concentrations (Chen et al. 2009),
386
which accords with our findings at the first fixed camp. However, in the present study body mass then significantly
387
reduced at the second and third camps, without a subsequent increase in ghrelin. This suggests that changes in
388
ghrelin were unlikely to be the result of fluctuations in body mass during the trek and were more strongly mediated
389
by high altitude exposure.
390
Although the findings of the present study provide novel information regarding the appetite and
391
metabolic responses during an incremental trekking ascent to high altitude, some notable limitations must be
392
acknowledged. First, the current study design did not include a control group to separate the effects of trekking
393
and high altitude exposure. Therefore it is not possible to conclude that the obtained results are a consequence of
394
hypobaric hypoxia per se, but are a result of high altitude trekking which combines various environmental and
395
psychological factors as well as demanding physical exercise. An example of this being that cold exposure may
396
interfere with energy balance, potentially by increasing non-shivering thermogenesis (van der Lans et al. 2013).
397
Although this limits interpretation of the influence of each of these factors individually, the study design allowed
398
us to investigate the effects of a real world gradual ascent to high altitude in order to understand the practical
399
implications for high altitude trekking. Second, it was not possible to standardise the trekking distance on the day
400
preceding each fixed camp due to the extreme terrain and environment. The greater trekking distance performed
401
on the day prior to the final research camp in combination with higher altitude exposure resulted in markedly
402
higher RPE scores at 5140 m. However, although exercise-induced anorexia occurs acutely in response to
403
strenuous exercise, tightly controlled laboratory studies suggest that this does not affect appetite perceptions and
404
ghrelin concentrations during the next day (King et al. 2015). Therefore the suppression of appetite at 5140 m is
405
unlikely to be due to greater exertion during trekking on the previous day. Furthermore, increased energy
406
expenditure from the greater trekking distance and the continued suppression of energy intake suggests that
407
17
to increase appetite under sea level conditions (Alajmi et al. 2016) and provides further support for a genuine409
altitude-mediated suppression of appetite. Third, the current study did not assess hydration status during the trek,
410
therefore it is possible that the observed reduction in body mass could be partly attributed to dehydration.
411
However, it should be noted that reductions in skinfold and girth measurements were observed during the trek
412
which suggests that the changes in body mass were at least partly due to genuine reductions in fat mass and muscle
413
mass. Although the estimation of body composition using skinfold and girth measurements contains limitations,
414
this was deemed to be the most practical and achievable method of assessment considering the extreme research
415
environment encountered in the present study. Additionally, mean fluid intake on the day before each fixed camp
416
was >3.6 L.day-1 which makes it unlikely that the participants experienced severe dehydration. It is not expected
417
that the higher fluid intake during the trek, compared with baseline, would have influenced the measured ghrelin
418
constituents given that gastric distension from water ingestion does not appear to influence plasma ghrelin
419
concentrations (Tschop et al. 2000).
420
In conclusion, this study represents the first investigation of circulating ghrelin constituents in response
421
to terrestrial altitude exposure and provides a time course of the changes in appetite, energy intake and body
422
composition during gradual trekking ascent to high altitude. These findings demonstrate consistently reduced
423
energy intake during high altitude exposure and an incremental reduction in appetite perceptions with increasing
424
altitude. These changes were associated with reductions in circulating concentrations of acylated and total ghrelin
425
during the trek but differences in the time course of these responses suggests that additional factors are also
426
involved.. A negative energy balance during the trek caused reductions in body mass and lower body muscle mass
427
which may have negative consequences for physical performance. Future investigations are required to develop
428
nutritional and/or physiological interventions to maintain appetite, energy intake and muscle mass at altitude.
429
430
18
CONFLICT OF INTEREST432
No conflicts of interest, financial or otherwise, are declared by the author(s). The content of this manuscript is
433
solely the responsibility of the authors and does not necessarily represent the official views of the Defence Medical
434
Services.
435
436
ETHICAL APPROVAL
437
All procedures performed in this study were in accordance with the ethical standards of the institutional and
438
Ministry of Defence research ethics committees and with the 1964 Helsinki declaration and its later amendments
439
or comparable ethical standards.
440
441
ACKNOWLEDGEMENTS
442
This work was supported by the Surgeon General (Defence Medical Services) Research Fund and Leeds Beckett
443
University. The authors would like to acknowledge the dedication of the participants to comply with the research
444
protocols in such a severe environment. The authors would also like to acknowledge: Joe Sails, Becky Price,
445
Georgia Head, Timothy Keitaro, Rebekah Brady, Milton Holt and Rachael Bradley for their help with the study.
446
447
19
REFERENCES449
Aeberli I et al. (2013) Disturbed eating at high altitude: influence of food preferences, acute mountain sickness
450
and satiation hormones. European journal of nutrition 52:625-635. doi:10.1007/s00394-012-0366-9
451
452
Al Massadi O, Lear PV, Muller TD, Lopez M, Dieguez C, Tschop MH, Nogueiras R (2014) Review of novel
453
aspects of the regulation of ghrelin secretion. Current drug metabolism 15:398-413.
454
455
Alajmi N et al. (2016) Appetite and Energy Intake Responses to Acute Energy Deficits in Females versus
456
Males. Medicine and science in sports and exercise 48:412-420. doi:10.1249/mss.0000000000000793
457
458
Armellini F et al. (1997) The effects of high altitude trekking on body composition and resting metabolic rate.
459
Hormone and Metabolic Research 29:458-461. doi:10.1055/s-2007-979077
460
461
Bailey DP et al. (2015) Appetite and gut hormone responses to moderate-intensity continuous exercise versus
462
high-intensity interval exercise, in normoxic and hypoxic conditions. Appetite 89:237-245.
463
doi:10.1016/j.appet.2015.02.019
464
465
Benso A, Broglio F, Aimaretti G, Lucatello B, Lanfranco F, Ghigo E, Grottoli S (2007) Endocrine and
466
metabolic responses to extreme altitude and physical exercise in climbers. European journal of
467
endocrinology 157:733-740. doi:10.1530/eje-07-0355
468
469
Berthoud HR (2006) Homeostatic and non-homeostatic pathways involved in the control of food intake and
470
energy balance. Obesity 14:197-200. doi:10.1038/oby.2006.308
471
472
Borg GA (1982) Psychophysical bases of perceived exertion. Medicine and science in sports and exercise
473
14:377-381.
474
475
Chen C-Y, Asakawa A, Fujimiya M, Lee S-D, Inui A (2009) Ghrelin Gene Products and the Regulation of Food
476
Intake and Gut Motility. Pharmacological Reviews 61:430-481. doi:10.1124/pr.109.001958
477
478
Debevec T (2017) Hypoxia-Related Hormonal Appetite Modulation in Humans during Rest and Exercise: Mini
479
Review. Frontiers in Physiology 8 doi:10.3389/fphys.2017.00366
480
481
Debevec T, Simpson EJ, Macdonald IA, Eiken O, Mekjavic IB (2014) Exercise training during normobaric
482
hypoxic confinement does not alter hormonal appetite regulation. PloS one 9:e98874.
483
doi:10.1371/journal.pone.0098874
484
485
Debevec T, Simpson EJ, Mekjavic IB, Eiken O, Macdonald IA (2016) Effects of prolonged hypoxia and bed
486
rest on appetite and appetite-related hormones. Appetite 107:28-37. doi:10.1016/j.appet.2016.07.005
487
488
Delhanty PJ et al. (2015) The acylated (AG) to unacylated (UAG) ghrelin ratio in esterase inhibitor-treated
489
blood is higher than previously described. Clinical endocrinology 82:142-146. doi:10.1111/cen.12489
490
491
Druce MR et al. (2005) Ghrelin increases food intake in obese as well as lean subjects. International journal of
492
obesity (2005) 29:1130-1136. doi:10.1038/sj.ijo.0803001
493
494
Ettinger RH, Staddon JE (1982) Decreased feeding associated with acute hypoxia in rats. Physiology &
495
behavior 29:455-458.
496
497
Fawcett JK, Wynn V (1960) Effects of posture on plasma volume and some blood constituents. Journal of
498
clinical pathology 13:304-310.
499
500
Fernandez G, Cabral A, Cornejo MP, De Francesco PN, Garcia-Romero G, Reynaldo M, Perello M (2016)
Des-501
Acyl Ghrelin Directly Targets the Arcuate Nucleus in a Ghrelin-Receptor Independent Manner and
502
Impairs the Orexigenic Effect of Ghrelin. Journal of neuroendocrinology 28:12349.
503
doi:10.1111/jne.12349
504
20
Flint A, Raben A, Blundell JE, Astrup A (2000) Reproducibility, power and validity of visual analogue scales in506
assessment of appetite sensations in single test meal studies. International journal of obesity and related
507
metabolic disorders 24:38-48.
508
509
Guenther PM, Kott PS, Carriquiry AL (1997) Development of an approach for estimating usual nutrient intake
510
distributions at the population level. The Journal of nutrition 127:1106-1112.
511
512
Hill RJ, Davies PS (2001) The validity of self-reported energy intake as determined using the doubly labelled
513
water technique. The British journal of nutrition 85:415-430.
514
515
Holm L, Haslund ML, Robach P, van Hall G, Calbet JAL, Saltin B, Lundby C (2010) Skeletal Muscle
516
Myofibrillar and Sarcoplasmic Protein Synthesis Rates Are Affected Differently by Altitude-Induced
517
Hypoxia in Native Lowlanders. PloS one 5:e15606. doi:10.1371/journal.pone.0015606
518
519
Hopkins WG (2004) How to interpret changes in an athletic performance test. Sportscience 8:1–7.
520
521
Hosoda H et al. (2004) Optimum collection and storage conditions for ghrelin measurements: octanoyl
522
modification of ghrelin is rapidly hydrolyzed to desacyl ghrelin in blood samples. Clinical chemistry
523
50:1077-1080. doi:10.1373/clinchem.2003.025841
524
525
Kalson NS, Hext F, Davies AJ, Chan CW, Wright AD, Imray CH (2010) Do changes in gastro-intestinal blood
526
flow explain high-altitude anorexia? European journal of clinical investigation 40:735-741.
527
doi:10.1111/j.1365-2362.2010.02324.x
528
529
Kargotich S, Goodman C, Keast D, Morton AR (1998) The influence of exercise-induced plasma volume
530
changes on the interpretation of biochemical parameters used for monitoring exercise, training and
531
sport. Sports medicine 26:101-117.
532
533
Kawai K et al. (2017) Ghrelin activation and neuropeptide Y elevation in response to medium chain triglyceride
534
administration in anorexia nervosa patients. Clinical nutrition ESPEN 17:100-104.
535
doi:10.1016/j.clnesp.2016.10.001
536
537
Kayser B, Narici M, Milesi S, Grassi B, Cerretelli P (1993) Body Composition and Maximum Alactic
538
Anaerobic Performance During a One Month Stay at High Altitude. International journal of sports
539
medicine 14:244-247. doi:10.1055/s-2007-1021171
540
541
King JA, Garnham JO, Jackson AP, Kelly BM, Xenophontos S, Nimmo MA (2015) Appetite-regulatory
542
hormone responses on the day following a prolonged bout of moderate-intensity exercise. Physiology
543
& behavior 141:23-31. doi:10.1016/j.physbeh.2014.12.050
544
545
Kojima M, Hosoda H, Date Y, Nakazato M, Matsuo H, Kangawa K (1999) Ghrelin is a
growth-hormone-546
releasing acylated peptide from stomach. Nature 402:656-660.
547
548
Loshbaugh JE, Loeppky JA, Greene ER (2006) Effects of acute hypobaric hypoxia on resting and postprandial
549
superior mesenteric artery blood flow. High altitude medicine & biology 7:47-53.
550
doi:10.1089/ham.2006.7.47
551
552
Matu J, Deighton K, Ispoglou T, Duckworth L (2017) The effect of moderate versus severe simulated altitude
553
on appetite, gut hormones, energy intake and substrate oxidation in men. Appetite 113:284-292.
554
555
Mekjavic IB et al. (2016) The effect of normobaric hypoxic confinement on metabolism, gut hormones and
556
body composition. Frontiers in Physiology 7 doi:10.3389/fphys.2016.00202
557
558
Mellor A et al. (2017) British Services Dhaulagiri Medical Research Expedition: A unique military/civilian
559
research collaboration.
560
561
Mellor AJ, Woods DR, O'Hara J, Howley M, Watchorn J, Boos C (2014) Rating of perceived exertion and acute
562
mountain sickness during a high-altitude trek. Aviation, space, and environmental medicine
85:1214-563
1216. doi:10.3357/asem.4083.2014
564
21
Morishima T, Goto K (2016) Ghrelin, GLP-1, and leptin responses during exposure to moderate hypoxia.566
Applied physiology, nutrition, and metabolism 41:375-381. doi:10.1139/apnm-2015-0311
567
568
Murphy KG, Bloom SR (2006) Gut hormones and the regulation of energy homeostasis. Nature 444:854-859.
569
doi:10.1038/nature05484
570
571
Nishi Y et al. (2005) Ingested medium-chain fatty acids are directly utilized for the acyl modification of ghrelin.
572
Endocrinology 146:2255-2264. doi:10.1210/en.2004-0695
573
574
Riepl RL et al. (2012) Influence of acute exposure to high altitude on basal and postprandial plasma levels of
575
gastroenteropancreatic peptides. PloS one 7:e44445. doi:10.1371/journal.pone.0044445
576
577
Roach RC, Bärtsch P, Oelz O, Hackett PH (1993) The Lake Louise acute mountain sickness scoring system. In:
578
Sutton JR, Houston CS, Goates G (eds) Hypoxia and Molecular Medicine. Queens City Burlington,
579
VT, pp 272-274
580
581
Rose MS, Houston CS, Fulco CS, Coates G, Sutton JR, Cymerman A (1988) Operation Everest. II: Nutrition
582
and body composition. Journal of applied physiology 65:2545-2551.
583
584
Sergi G et al. (2010) Changes in total body and limb composition and muscle strength after a 6-8 weeks sojourn
585
at extreme altitude (5000-8000 m). The Journal of sports medicine and physical fitness 50:450-455.
586
587
Shiiya T et al. (2002) Plasma ghrelin levels in lean and obese humans and the effect of glucose on ghrelin
588
secretion. The Journal of clinical endocrinology and metabolism 87 doi:10.1210/jcem.87.1.8129
589
590
Shukla V, Singh SN, Vats P, Singh VK, Singh SB, Banerjee PK (2005) Ghrelin and leptin levels of sojourners
591
and acclimatized lowlanders at high altitude. Nutritional neuroscience 8:161-165.
592
doi:10.1080/10284150500132823
593
594
Sierra-Johnson J, Romero-Corral A, Somers VK, Johnson BD (2008) Last word on viewpoint: effect of altitude
595
on leptin levels, does it go up or down? Journal of applied physiology 105:1691.
596
doi:10.1152/japplphysiol.90679.2008
597
598
Snyder EM, Carr RD, Deacon CF, Johnson BD (2008) Overnight hypoxic exposure and glucagon-like peptide-1
599
and leptin levels in humans. Applied physiology, nutrition, and metabolism 33:929-935.
600
doi:10.1139/h08-079
601
602
Stubbs RJ et al. (2000) The use of visual analogue scales to assess motivation to eat in human subjects: a review
603
of their reliability and validity with an evaluation of new hand-held computerized systems for temporal
604
tracking of appetite ratings. The British journal of nutrition 84:405-415.
605
606
Tschop M, Smiley DL, Heiman ML (2000) Ghrelin induces adiposity in rodents. Nature 407:908-913.
607
doi:10.1038/35038090
608
609
van der Lans AA et al. (2013) Cold acclimation recruits human brown fat and increases nonshivering
610
thermogenesis. The Journal of clinical investigation 123:3395-3403. doi:10.1172/jci68993
611
612
Vissing K, McGee S, Farup J, Kjolhede T, Vendelbo M, Jessen N (2013) Differentiated mTOR but not AMPK
613
signaling after strength vs endurance exercise in training-accustomed individuals. Scandinavian journal
614
of medicine & science in sports 23:355-366. doi:10.1111/j.1600-0838.2011.01395.x
615
616
Wasse LK, Sunderland C, King JA, Batterham RL, Stensel DJ (2012) Influence of rest and exercise at a
617
simulated altitude of 4,000 m on appetite, energy intake, and plasma concentrations of acylated ghrelin
618
and peptide YY. Journal of applied physiology 112:552-559. doi:10.1152/japplphysiol.00090.2011
619
620
Westerterp KR, Meijer EP, Rubbens M, Robach P, Richalet JP (2000) Operation Everest III: energy and water
621
balance. European journal of physiology 439:483-488. doi:10.1007/s004249900203
622
23
Figure 1 Energy intake (a), palatability score (b) and composite appetite score (c) at baseline, 3619 m, 4600 m625
and 5140 m. *significant difference from baseline. ‡significant difference between 4600 m and 5140 m.
626
§significant difference between 3619 m and 5140 m (One way ANOVA; P < 0.05 after post-hoc analyses). Values
627
are mean (SE), N = 12 for energy intake and palatability, N = 11 for composite appetite score
628
629
630
Figure 2 Acylated ghrelin (a), des-acylated ghrelin (b), AG:DG ratio (c) and total ghrelin (d) concentrations at
631
baseline, 3619 m, 4600 m and 5140 m. *significant difference from baseline (One way ANOVA; P < 0.05 after
632
post-hoc analyses). Values are mean (SE), N = 11
633
24
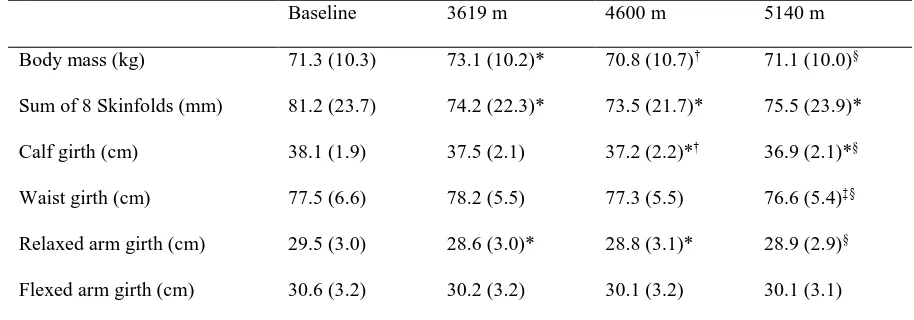
Table 1 Body composition measurements at baseline, 3619 m, 4600 m and 5140 m.635
Baseline 3619 m 4600 m 5140 m
Body mass (kg) 71.3 (10.3) 73.1 (10.2)* 70.8 (10.7)† 71.1 (10.0)§
Sum of 8 Skinfolds (mm) 81.2 (23.7) 74.2 (22.3)* 73.5 (21.7)* 75.5 (23.9)*
Calf girth (cm) 38.1 (1.9) 37.5 (2.1) 37.2 (2.2)*† 36.9 (2.1)*§
Waist girth (cm) 77.5 (6.6) 78.2 (5.5) 77.3 (5.5) 76.6 (5.4)‡§
Relaxed arm girth (cm) 29.5 (3.0) 28.6 (3.0)* 28.8 (3.1)* 28.9 (2.9)§
Flexed arm girth (cm) 30.6 (3.2) 30.2 (3.2) 30.1 (3.2) 30.1 (3.1)
Values are mean (SD), N = 12. *significant difference from baseline. †significant difference between 3619 m and
636
4600 m. ‡significant difference between 4600 m and 5140 m. §significant difference between 3619 m and 5140 m
637
(One way ANOVA; P < 0.05 after post-hoc analyses)
638
25
Figure 1640
641
642
643
644
645
646
647
648
649
650
651
652
653
654
655
656
657
658
659
660
661
662
663
664
665
666
667
668
669
670
[image:26.595.136.364.106.696.2]26
Figure 2673
[image:27.595.79.514.94.515.2]