Comparison of Fuel Economy between Hydraulic Hybrids
and Hybrid Electric Vehicles
Chi-Jui Huang
*, Ming-Siang Du, Go-Long Tsai
Graduate institute of Mechanical and Electrical Engineering, National Taipei University of Technology, Taiwan
Copyright © 2015 by authors, all rights reserved. Authors agree that this article remains permanently open access under the terms of the Creative Commons Attribution License 4.0 International License
Abstract
Due to the conventional vehicles produce a lot
of pollution and fuel consumption in driving. So the purpose of this study was to effectively improve emission and energy consumption, and kept the original vehicles in the better performance. Although pure electric vehicle had the good performance and low pollution features, the vehicle was limited by the distance, and the batteries were very expensive comparing to the conventional vehicle. The hybrid vehicles could achieve energy-saving purposes, but the prices of vehicles and the replaced batteries were still expensive than conventional vehicles. Hydraulic hybrid vehicles engines need to be accelerated with other dynamic alternate during work. And as the hydraulic accumulators exhausted, the accumulator would return to traditional mode. In the meantime, the engines will take the advantage of dynamic brake and pump energy recycles, and therefore fuel consumption and energy recovery function could be reached. In this study applied the feed-back simulation to establish hydraulic hybrid vehicle and hybrid electric vehicle models, and the NEDC (New European Driving cycle) was applied and simulated in this energy state. The simulation results showed the hydraulic hybrid vehicles had 56.7% better fuel economy efficiency than hybrid electric vehicles, this was the tremendous contribution on this study.
Keywords
Hydraulic Hybrid Vehicle, Hybrid ElectricVehicle, Hydraulic Pump/Motor, Hydraulic Accumulators, Feed-back Simulation
1. Introduction
General speaking, conventional manual or automatic transmissionallowedthe engine speedwithin a certainrange,
and the final drive output speed and torque to meet the driver'sneeds.The biggest drawback was theneed torely on the transmissiontoshiftgear whenthe gearboxchangesgear,
the engine speedwill obviouslyfeel increased or decreased,
and feeling frustratedby theshift timeis generated at this moment. Butsteplesstransmission(CVT)does not produce
the shiftfeeling frustratedduring a shift, so thatpassengers
could ridemore comfortablevehicles.The advantagefor the steplessgearboxallowsthe engine power was not lost, and always maintained the most efficientin thepeakregion, but also allowed the enginespeed maintained ata certain area,
stepless gearbox was easy maintenance due to simple structure. But the disadvantage wasthe enginetorqueto the stepless transmission processing, the belt or chain was
limitedstrength, could not able to bearmuchfriction.
However Hydraulic transmission (HST) was widely used in the machine tool industry, construction machinery, construction machinery, vehicles, air transport [1], and its advantages could be listed as following:
(1) Drive smoothly: the hydraulic drive unit, since the hydraulic oil shrinkage was very small, under normal pressure could be treated as incompressible, which was relied on a continuous flow of hydraulic oil carried drive, and the tubing hydraulic cushioning device can also be designed and set in so that the transmission buffer was stable.
(2) Light, small size: hydraulic transmission compared with the mechanical, electrical and other transmission mode in which the output power at the same conditions, the volume and quality could be reduce, so the inertia was small and the transmission reaction would be quick.
(3) Carrying capacity: the hydraulic drive was easy to get a lot of power and torque.
(4) Easy to implement variable speed: In hydraulic transmission, regulate the flow of liquid could achieve stepless speed range up to 2000:1, and easily access to a very low speed.
was changing the hydraulic motor or opening degree of hydraulic pump of this system to provide a continuous and wide variable reduction ratio, but usually a higher or lesser degree of opening of the pressure of the hydraulic motor / pump would get poor efficiency.
The Origin of the hydraulic hybrid power system could be dating back to 1972, Dunn and Wojciechowski [2] in the energy conversion engineering workshop in the post, the study by the Welfare Adams company VW 311 vehicle engines to run fly wheel, simulated the entire vehicle energy, the device has a 5 gallon pressure accumulator, 4.8 𝑖𝑖𝑖𝑖3⁄𝑟𝑟𝑟𝑟𝑟𝑟 variable volume pump and other hydraulic components, hydraulic pump through a simulated vehicle deceleration recovered energy stored in the accumulator and the subsequent release for fly wheel use. From thus research the use of a hydraulic system was beginning at that way, you can recycle most of the original vehicle braking energy. The subsequent scholars continuously explore, 1992 Pourmovahed, Beachley and Fronczak [3] applied the components of hydraulic hybrid power system to conduct simulated match combinations by experiment that flywheel
energy recovery model could reach between 61% to 89% recovery energy.
Concerning about the hydraulic power products applied on the vehicle that could be pointed that the 1982 Parker Hannifin Corporation [4] and joint architecture of hybrid systems Cumulo Brake Drive proposed a cascaded architecture hydraulic in 1991 of hybrid systems Cumulo Hydrostatic Drive. In the world the companies promote the hydraulic hybrid power systems and their products are: Bosch Rexroth's Hydrostatic Regenerative Braking System (referred to as HRB), Eaton's Hydraulic Launch Assist (referred to as HLA), Parker Hannifin's RunWise Advanced Series Hybrid Drive (referred RunWise) [5-7] and so on.
2. Modeling
[image:2.595.71.542.345.514.2]This section applied Mat lab / Simulink software to create feedback-in hybrid vehicles (Hybrid Electric Vehicle, HEV) with a hydraulic hybrid vehicles (Hydraulic Hybrid Vehicle, HHV), and the model was shown in Figure 1 and Figure 2.
Figure 1. Simulation for hybrid vehicle power system
[image:2.595.66.544.540.731.2]Figure 3. The new European driving cycle [8]
2.1. Driving Cycle Model
The study was adopting the new European standard test driving cycle (New Europeon Driving Cycle, NEDC)which was shown in Figure 3, the total driving cycle time was 1180 seconds, from the urban driving cycle (Urban Driving Cycle, UDC) and highway driving cycle (Extra-Urban Driving Cycle, EUDC), which 780 seconds belonged to the urban driving cycle, and the top speed was 50 km / hr, and 400 seconds belonged to highway driving cycle. The maximum speed was 120 km / hr.
2.2. Vehicle Dynamics Model
In order to deal with the dynamics model, the simulation of the resistance comprised a rolling resistance, air resistance, acceleration resistance and the climbing resistance. The speed could be
Obtained from the NEDC driving cycle, and after proceeding from this cycle the required torque value could be obtained either.
2.2.1. Rolling resistance
As driving a vehicle, the tire was rolling on the wheel. The ground contact area would interact both radial and lateral force of the tire. The ground reaction on tires, which must be accompanied by a deformation energy loss, the cause of energy loss was as the rolling resistance of the wheel is rotated, and the following formula could be expressed as
𝑅𝑅𝑟𝑟= 𝜇𝜇𝑟𝑟∙ 𝑊𝑊 (1)
𝑅𝑅𝑟𝑟 Rolling resistance
𝜇𝜇𝑟𝑟 Rolling resistance coefficient
𝑊𝑊 Vehicle Gross Weight. 2.2.2. Air resistance
When the vehicle was traveling, the air pressure acting on the front of the vehicle body was generated, known as air resistance. At low speeds, little effect of air resistance. However, at high speed, because the air resistance was proportional to the square of the speed, so the air resistance was represented as the following formula.
𝑅𝑅𝑎𝑎= 𝐶𝐶𝐷𝐷∙𝜌𝜌2∙ 𝐴𝐴𝑓𝑓∙ (𝑟𝑟 − 𝑟𝑟𝑤𝑤)2 (2)
𝑅𝑅𝑎𝑎 Air resistance
𝐶𝐶𝐷𝐷 Air resistance coefficient
𝜌𝜌 Air density
𝐴𝐴𝑓𝑓 Orthographic projection area of the vehicle
𝑟𝑟 Vehicle velocity 𝑟𝑟𝑤𝑤 Air velocity 2.2.3. Climbing resistance
𝑅𝑅𝑐𝑐= 𝑊𝑊𝑊𝑊𝑖𝑖𝑖𝑖(𝜃𝜃) (3)
𝑅𝑅𝑐𝑐 Climbing resistance
𝜃𝜃 Slope angle
2.2.4. Acceleration r resistance
In addition to the traveling state of the vehicle on the highway at fixed speeds, most vehicles were at acceleration and deceleration condition. General speaking, the vehicle needed more power than the steady running. The vehicle should entering the acceleration mode to conquer inertial resistance of rotating engine and components, clutch, transmission, drive shafts an, tires and so on, this resistance is called acceleration resistance, the formula could be expressed as following:
𝑅𝑅𝑠𝑠= (𝑊𝑊 + 𝑊𝑊𝑓𝑓) ∙ 𝑎𝑎 𝑔𝑔� (4)
𝑅𝑅𝑠𝑠 Acceleration resistance
𝑊𝑊𝑓𝑓 The same amount of weight rotating element
𝛼𝛼 Acceleration G Gravity.
2.3. Engine MODEL
[image:4.595.307.545.91.281.2] [image:4.595.313.549.404.659.2]In this study the main driving force loaded on the vehicle was 1 liter of 41 kw petrol engine, the engine speed and engine torque could be checked up the table, and therefore the braking ratio of fuel consumption (brake specific fuel consumption, bsfc) could be obtained, and the fuel consumption of the vehicle could be calculated and shown in Figure 4.
Figure 4. Contour map of 1 liter petrol engine BSFC
2.4. Energy Storage Element Model
For energy storage component parts, comparing hydraulic accumulator power density with the lithium-ion batteries and lead-acid batteries, nickel hydrogen batteries is the highest. But from” the energy density” point of view, the energy
density of the hydraulic accumulator was the lowest, which could be shown in Figure 5.
Figure 5. The ratio of energy density and power density for accumulator and battery [9]
2.4.1. Battery model
The nickel-metal hydride battery was used in this study, the voltage was 330 V, and power capacity was 4 Ah, and therefore the total electric energy was 1.32 kWh. To create a simple battery model RC circuit diagram which was shown in Figure 6 and the correlation equation could be written as
𝑉𝑉𝑡𝑡= 𝑉𝑉𝑜𝑜𝑐𝑐− 𝐼𝐼𝑏𝑏𝑎𝑎𝑡𝑡∙ 𝑅𝑅𝑖𝑖𝑖𝑖𝑡𝑡 (5)
Figure 6. Simple RC circuit diagram
𝑉𝑉𝑜𝑜𝑐𝑐 Open circuit voltage
𝑅𝑅𝑖𝑖𝑖𝑖𝑡𝑡 Internal resistance of the battery
𝑉𝑉𝑡𝑡 Battery terminal voltage
𝐼𝐼𝑏𝑏𝑎𝑎𝑡𝑡 Output current of the battery
Usually, terminal voltage and current could be measured, and it could be calculated by the following formula:
𝑃𝑃𝑏𝑏𝑎𝑎𝑡𝑡 = 𝐼𝐼𝑏𝑏𝑎𝑎𝑡𝑡∙ 𝑉𝑉𝑜𝑜𝑐𝑐 (6) Then put (5) into (6) and the (7) could be obtained
𝐼𝐼𝑏𝑏𝑎𝑎𝑡𝑡=𝑉𝑉𝑡𝑡−(𝑉𝑉𝑡𝑡 2−4∙𝑅𝑅
𝑖𝑖𝑖𝑖𝑡𝑡∙𝑃𝑃𝑏𝑏𝑏𝑏𝑡𝑡)0.5
[image:4.595.61.297.456.654.2]could be obtained from the following formula:
𝑆𝑆𝑆𝑆𝐶𝐶 = 𝑆𝑆𝑆𝑆𝐶𝐶𝑖𝑖𝑖𝑖𝑡𝑡−∫ 𝐼𝐼𝑏𝑏𝑏𝑏𝑡𝑡𝑑𝑑𝑡𝑡 𝑡𝑡 0
𝐴𝐴ℎ (8) 2.4.2. Accumulator model
Accumulator specifications were applied balloon-type accumulator with a capacity of 22 L, working pressure was 150 bars to 420 bars. To create a model of the accumulator was shown in Figure 7. And the varied process was according to the laws of thermodynamics, the gas expansion and the actual compression processes, the relationship between pressure and volume could be expressed as the following equations:
𝑃𝑃𝑉𝑉𝑖𝑖= 𝐶𝐶𝐶𝐶𝑖𝑖𝑊𝑊𝐶𝐶𝑎𝑎𝑖𝑖𝐶𝐶 (9)
𝑃𝑃0𝑉𝑉0𝑖𝑖= 𝑃𝑃1𝑉𝑉1𝑖𝑖= 𝑃𝑃2𝑉𝑉2𝑖𝑖= 𝐶𝐶𝐶𝐶𝑖𝑖𝑊𝑊𝐶𝐶𝑎𝑎𝑖𝑖𝐶𝐶 (10)
𝑉𝑉1= �𝑃𝑃𝑃𝑃21� 1 𝑖𝑖
[image:5.595.311.548.166.321.2]𝑉𝑉2 (11)
Figure 7. The accumulator P-V changing processes [11]
Hydraulic hybrid hydraulic accumulator brake kinetic energy recovery function was mainly assumed that the vehicle traveling speed v1 to v2 deceleration energy generated ΔEa; the decrease in the kinetic energy could be calculated as the following equation:
𝛥𝛥𝐸𝐸𝑎𝑎=12𝑀𝑀(𝑟𝑟12− 𝑟𝑟22) (12) The maximum volume change could be stored in the accumulator was calculated by the following formula:
𝛥𝛥𝑉𝑉𝑎𝑎= 𝑉𝑉1�1 − (𝑃𝑃𝑃𝑃12) 1
𝑖𝑖� (13) Typically the SOC of the accumulator represented by the size of the volume, as the result of SOC would create a volumetric flow rate changes, so the accumulator pressure was obtained by using the following formula's SOC:
𝑆𝑆𝑆𝑆𝐶𝐶 = 𝑆𝑆𝑆𝑆𝐶𝐶𝑖𝑖𝑖𝑖𝑡𝑡−∫ 𝑄𝑄𝑑𝑑𝑡𝑡 𝑡𝑡 0
𝑉𝑉𝑓𝑓 (14)
2.5. Driving Element Model
[image:5.595.70.291.242.502.2]For parts of the drive elements, the hydraulic motor / pump / generator, a hydraulic motor / pump had a higher power density (kW / kg). The greater power density of the vehicle acceleration and deceleration, the greater ability of the electric motor which was s shown in Figure 8.
Figure 8. Hydraulic motor / pump and electric motor / generator power density [12]
2.5.1. Electric motor model
The 75 kW electric permanent magnet motor was used in this study that was a DC motor with a low-speed torque. According to the reverse-type manner, the torque and speed have been calculated and the motor efficiency curve was shown in Figure 9 through the previously stored.
Figure 9. Contour of estimated Electric motor efficiency
2.5.2. Generator model
[image:5.595.315.548.448.636.2]Figure 10. Contour of estimated Generator efficiency
2.5.3.Hydraulic motor and hydraulic pump models
Hydraulic motor and hydraulic pump models were used oblique axis piston hydraulic motor / pump in this study. And was applied reciprocating plunger in a limited volume movement, so after the inhalation of low pressure hydraulic fluid through the piston, and then compressed volume of high-pressure hydraulic oil would be discharged through the piston. The displacement in this process could be achieved by changing the angle of the swash plate to alter the pressure and flow, and thereby changing the relationship between torque and speed. The hydraulic motor / pump related formula was shown as following:
The fluid flow rate of Hydraulic motor / pump
𝑄𝑄𝑃𝑃/𝑀𝑀 = 𝑥𝑥𝑃𝑃/𝑀𝑀𝜔𝜔𝑃𝑃/𝑀𝑀𝐷𝐷𝑃𝑃/𝑀𝑀(𝜂𝜂𝑣𝑣𝑃𝑃/𝑀𝑀)𝑧𝑧 (15) The shaft torque Hydraulic motor / pump shaft torque
𝑇𝑇𝑃𝑃/𝑀𝑀 = 𝑥𝑥𝑃𝑃/𝑀𝑀𝛥𝛥𝑃𝑃𝑃𝑃/𝑀𝑀𝐷𝐷𝑃𝑃/𝑀𝑀(𝜂𝜂𝑡𝑡𝑃𝑃/𝑀𝑀)−𝑧𝑧 (16) The shaft power of Hydraulic motor / pump shaft power
𝑃𝑃𝑃𝑃/𝑀𝑀= 𝑥𝑥𝑃𝑃/𝑀𝑀𝛥𝛥𝑃𝑃𝑃𝑃/𝑀𝑀𝐷𝐷𝑃𝑃/𝑀𝑀𝜔𝜔𝑃𝑃/𝑀𝑀(𝜂𝜂𝑡𝑡𝑃𝑃/𝑀𝑀)−𝑧𝑧 (17) Where 𝑄𝑄𝑃𝑃/𝑀𝑀 was volume flow rate,𝑇𝑇𝑃𝑃/𝑀𝑀was shaft torque,𝑃𝑃𝑃𝑃/𝑀𝑀was axis function,𝑥𝑥𝑃𝑃/𝑀𝑀 was the volume ratio which was defined as the percentage displacement of -1 ≤ x ≤ 1, as x was positive which was in the pump mode, and as x was negative which was in the motor mode , x was not zero for success., 𝐷𝐷𝑃𝑃/𝑀𝑀was the maximum volume displacement,,
𝜔𝜔𝑃𝑃/𝑀𝑀 was axis angular velocity, ΔP𝑃𝑃/𝑀𝑀 was the pressure difference between the hydraulic motor / pump inlet and outlet,,𝜂𝜂𝑣𝑣𝑃𝑃/𝑀𝑀was the was the volume loss efficiency,,𝜂𝜂𝑡𝑡𝑃𝑃/𝑀𝑀
was the mechanical loss efficiency, and Z was factor of working mode shown as following equation:
Z = sgn(x) = �+1, pump mode −1, motor mode (18) The hydraulic motor / pump efficiency was the product of the total volumetric and mechanical efficiency, and usually affecting the operation efficiency was due to a variable
(pressure difference and the volume flow rate), the hydraulic motor / pump parameters (volume displacement), and fluid parameters (fluid viscosity, density, volume modulus, etc.).
2.6. HEV and HHV Control Strategies
In order to investigate the HEV and HHV fuel economy, the study set the two control strategies to be the same. And in order to avoid often start engine, it will be set as SOC storage elements was less than 0.3, and then the engine could be started again. Once started engine, SOC must charge storage element back to 0.9 before they can stop the engine. Optimum operating point of the engine speed control torque was set at 55 Nm and 3500 rpm to achieve the best fuel economy.
3. Simulation Results and Discussion
This section will explore a variety of architectures mentioned in Section 2, under the NEDC driving cycle and simulating the depletion of its energy state, the study obtained the performance comparison. And therefore to simulate the differences between HEV and HHV, the basic specifications of the vehicle could be unified as shown in Table 1.Table 1. The common specifications of vehicles
Parameter symbol value unit
Vehicle weight W 1500 kg
Rolling resistance
coefficient 𝜇𝜇𝑟𝑟 0.008 -
Air resistance
coefficient 𝐶𝐶𝐷𝐷 0.28 -
Vehicle orthographic
projection area 𝐴𝐴𝑓𝑓 2.26 𝑚𝑚2
Wheel radius r 0.315 m
Maximum vehicle
speed 𝑟𝑟𝐹𝐹 180 𝑘𝑘𝑚𝑚 ℎ𝑟𝑟⁄
3.1. Hybrid Vehicle Simulation Results
Figure 11. NEDC driving pattern(vehicle speed) curve during the first 2500 seconds.
Figure 12. Eletric motor power curve during the first 2500 seconds.
Figure 13. Battery current curve during the first 2500 seconds.
Figure 14. Generator power curve during the first 2500 seconds.
Figure 15. Battery SOC curve during the first 2500 seconds.
3.2. Hydraulic Hybrid Vehicle Simulation Results
[image:7.595.311.547.77.263.2] [image:7.595.313.549.80.472.2] [image:7.595.316.547.283.475.2] [image:7.595.60.293.299.488.2] [image:7.595.61.294.515.702.2]pronounced than the effect of a number of cells, the main difference was the physical change of the charge and discharge of hydraulic was simple, but the accumulator battery charging and discharging process was a chemical change which can vary significantly for greater chemical energy losses.
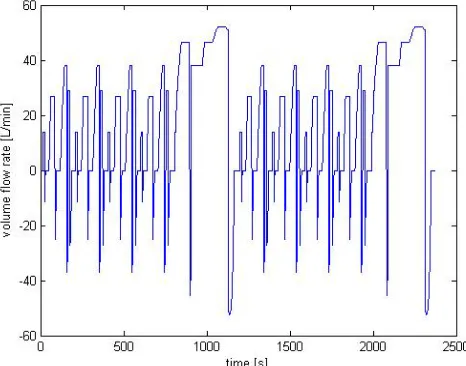
Figure 16. Accumulator volume flow rate during the first 2500 seconds.
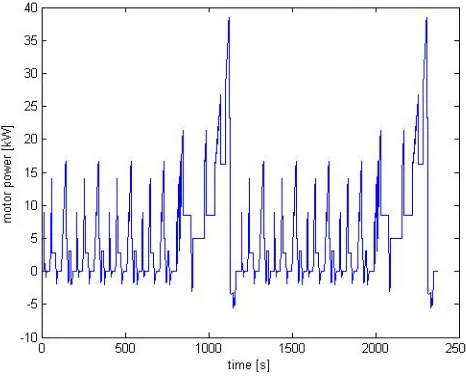
Figure 17. Hydraulic pumps actuation during the first 2500 seconds.
Figure 18. SOC state of the accumulator during the first 2500 seconds.
Table 2. The comparison of fuel economy for HEV and HHV.
Category HEV HHV
Fuel economy(𝑘𝑘𝑚𝑚 𝐿𝐿⁄ ) 15.82 24.79
4. Conclusions
The study used European traffic patterns to simulate vehicle energy changes state, and could be clearly observed in the various components of the actuator status and efficiency in the system, that the hybrid vehicles and hydraulic hybrid fuel economy, energy storage SOC factors such elements could be known.
From simulation results that the pressure accumulator battery has a higher power density compared to the energy density of the hydraulic accumulator. The hydraulic accumulator was short, and should rely on the engine driving or braking kinetic energy stored in a hydraulic accumulator, which was more suitable for the stop-go urban driving patterns, and would actually be used in the vehicles, such as buses, garbage trucks, and so on.
Finally, the simulation results of this study with respect to the hydraulic hybrid vehicle hybrid vehicles could improve fuel economy up to 56.7%. This was the significant contribution on this study.
REFERENCES
[1] GUO Xing home, Lu Huai smoked, Huang Shengming, gas hydraulic science, Gao Books Ltd, 2011.
[2] H. S. Dunn and P. H. Wojciechowski, “High-Pressure Hydraulic Hybrid with Regenerative Braking, ” Proceeding of the 7th Intersociety Energy Conversion Engineering Conference , San Diego, CA, pp. 989-995, 1972.
[3] A. Pourmovahed, N. H. Beachley, and F. J. Fronczak, “Modeling of a Hydraulic Energy Regeneration System - Part I: Analytical Treatment,” AEME Journal of Dynamic Systems, Measurement, and Control, pp.155-159, 1992. [4] Parker’s Hydraulic Hybrid Technologies, R. J.
Marotta,2012,http://www.
wwcleancities.org/documents/HydraulicHybrid_Parker_Mar otta.pdf
[5] Factsheet HRB, Bosch Rexroth,2008. http://www.boschrexroth-us.com/country
_units/america/united_states/en/Company/Press/trade_show _information/a_downloads/Hydrostatic_Regenerative_Braki ng_Fact_Sheet.pdf
[6] Hydraulic Launch Assist The Eaton HLA System,Eaton, www.etopiamedia.net/ mtw/pdfs/EatonHLA1.ppt
[7] Hydrauliska hybrider -Vad händer , Parker,
http://www.ifsfluid.se/Seminarium%
20Hybriddrifter/Hydrauliska%20hybrider%202011-03-03% 20Hybridseminarium%20-%20R%20Werndin.pdf
[image:8.595.311.552.91.122.2] [image:8.595.60.293.154.337.2]Comparison of The Athens Driving Cycle (ADC) With Ece-15 And European Driving, Cycle (EDC), Global NEST Journal, Vol 8, No 3, 2006 pp 282-290
[9] Baseley, S., et al., Hydraulic Hybrid Systems for Commercial Vehicles, SAE technical paper, 2007.
[10]Cheung Ka Ho, the use of reverse analog composite dynamic energy management motorcycles, Vehicle Engineering,
National Taipei University of Technology Master's thesis, Taipei, 2003.
[11]Yunus A. Cengel, Micheal A. Boles, Thermodynamics an Engineering Approach, McGrawHill, 2006.

![Figure 3. The new European driving cycle [8]](https://thumb-us.123doks.com/thumbv2/123dok_us/8751051.891905/3.595.69.543.80.380/figure-new-european-driving-cycle.webp)

![Figure 7. The accumulator P-V changing processes [11]](https://thumb-us.123doks.com/thumbv2/123dok_us/8751051.891905/5.595.70.291.242.502/figure-the-accumulator-p-v-changing-processes.webp)