School Infrastructure and Socioeconomic Status in Brazil
Carlos André Teixeira Gomes
*, Marisa Ribeiro Teixeira Duarte
Faculty of Education, Federal University of Minas Gerais, Brazil
Copyright©2017 by authors, all rights reserved. Authors agree that this article remains permanently open access under the terms of the Creative Commons Attribution License 4.0 International License
Abstract
The paper analyzes the infrastructure of public schools in Brazil by examining the hypothesis that the institutions with poor material conditions have students with a lower socioeconomic level. The characterization of the institutions is based on data from the 2013 School Census, submitted to latent class modeling, which revealed the existence of four different school profiles. In order to carry out a socioeconomic differentiation of the institutions, the Poverty In School Indicator (IPE in Portuguese) was created, which uses data from Bolsa Família, an income transfer program. The results confirm the available body of literature on the subject by showing that the location, the administrative dependency, the size of the school and the region of the country in which it is inserted are related to the inequalities of school infrastructure. In addition, the study finds that the public schools with better infrastructure conditions generally have lower proportions of poor students. On the other hand, most institutions with the worst infrastructure profile have mostly poor or extremely poor students, confirming the hypothesis of this research.Keywords
School Infrastructure, Socioeconomic Status of Schools, Educational Inequality1. Introduction
Education in Brazil has undergone significant changes, notably the change related to a more expanded access to fundamental education1. Until the early 1980s, about one-fifth of Brazilians between the ages of 7 and 14 years were out of school. By 2013, the percentage of children between the ages of 6 and 14 years2 who were not studying was below 2%3. The expansion of the access to educational
1 Fundamental education is the mandatory school period of what is considered basic education in Brazil. Basic education is defined as the first level of school education, including preschool education (for children up to 5 years of age), fundamental education (elementary and middle school - from 6 to 14 years of age), and high school (from 15 to 17 years old). 2 In 1996, fundamental education in Brazil was expanded from 8 to 9 years, due to a change in the entry age, now for 6-year-old children.
3 Data from the Brazilian Geography and Statistics Institute (Instituto Brasileiro de Geografia e Estatística - IBGE), collected from the 1980
institutions was due to the inclusion of the most financially disadvantaged, who were historically excluded from school education.
Since the 1990s, public policies on education have gradually been emphasizing programs and projects that promote accountability. New forms of regulation based on performance were disseminated among the Brazilian educational systems [1]. In this context, the Basic Education Assessment System (Sistema de Avaliação da Educação Básica - SAEB) was structured, which periodically began carrying out standardized tests to measure student performance and making the results available. The political-administrative measures have been legitimized by studies aimed at identifying factors associated with school performance. As a whole, expanding school access and periodically disclosing low student learning has contributed to a shift in the government agenda as well as in the research agenda in the education field. As a result, both turned to the question of quality.
Inspired by the research tradition developed since the publication of the so-called "Coleman Report" [2], most studies on school infrastructure in Brazil are related to school effectiveness. Overall, as in the international literature, these studies show the predominance of the socioeconomic origin of students over their performance. However, more than in other countries, research projects conducted in Brazil have identified that some characteristics of the educational institutions, in other words, the schools themselves, make their students obtain better results [3-5]. Among these characteristics, school infrastructure stands out, indicated as a relevant aspect for student learning [6-9]. Thus, these studies emphasize that the improvement of the material conditions of Brazilian educational institutions, especially those less favored, would contribute not only to the reduction of the inequality between schools, but also to the improvement of the results of the educational system as a whole [5,10].
On the other hand, there is a recurrent emphasis among
the studies and publications that analyze the infrastructure of Brazilian schools outside the field of school effectiveness research, on the existing inequality among the educational institutions, as well as on the terrible material conditions of some of the schools in the country [11]. These research projects have also highlighted some of the main cleavages related to school infrastructure, especially in terms of location [12-14], administrative dependency [15,16], size [17] and the region of the country where they are established [18].
This is the scenario in which the present paper discusses the relationship between school infrastructure and social inequality in Brazil. It is not a study in the line of research in school effectiveness, but one that seeks to verify if, in addition to the impact of their family background, the most financially disadvantaged students endure public policies that provide them with poorer material conditions.
Therefore, in this paper, a descriptive analysis of the different infrastructure profiles among public schools providing fundamental education is carried out. The term school infrastructure, as used in this study, refers to the material conditions, equipment and physical resources that enable school institutions to function, either as a space for movement and permanence of people, or as a place for learning.
Based on this characterization of school infrastructure, this research relates the profiles of the infrastructure of Brazilian schools to the socioeconomic level of their students, investigating the hypothesis that the public schools that have the poorest infrastructure are attended by the most financially disadvantaged students.
2. Materials and Methods
In this paper the methodology is divided into three parts. The first part describes how the schools that were included in the analysis were selected. The second part is devoted to explaining how the categorization of school infrastructure is conducted in this study. Finally, the last part of this methodology presents the development of a socioeconomic level indicator for the institutions, a scheme used in this research to differentiate educational institutions based on information on the income of their students’ families.
2.1. Schools Included in the Analysis
This study focuses on institutions that have students enrolled in the regular public fundamental education. The option for an analysis of institutions of fundamental education is due to the fact that, in 2013, this was the only stage of compulsory education that was universalized in Brazil. It is also possible to highlight the representativeness that this educational stage has in numerical terms. Fundamental education is offered in 74.1% of all schools
and covers more than 59% of the universe of enrollments in basic education in Brazil. In addition to these reasons, the choice of a single educational stage analysis was made so that the comparison would involve schools with students that are part of the same age group.
Regarding administrative dependency, this paper is limited to the analysis of state and municipal educational institutions. Thus, neither private nor federal educational institutions, respectively responsible for 15.0% and 0.1% of enrollments in fundamental education, are examined by this study. Federal schools that work in this educational stage, although public, were excluded from the database due to their high specificity and because of their statistical insignificance, once they represent only 0.03% of the total number of schools offering fundamental education in the country4.
2.2. Characterization of School Infrastructure
In order to characterize the infrastructure of the educational institutions, data from the 2013 School Census were used. The School Census is an annual statistical survey, in which information is collected on all schools that offer basic education in Brazil, whether public or private. This survey is the most extensive research on educational institutions in the country, including data on enrollments, classes, teachers and schools of all stages and modalities that constitute basic education in Brazil.
Among the data collected by the School Census, twenty-six variables were selected, which will be used to compose the characterization of the material operating conditions of the institutions. According to the type of resource to which they refer, these variables were divided into four categories, namely: basic resources, facilities, didactic facilities and equipment (Table 1).
Most of the variables selected by this study are of the dichotomous categorical type, informing if the school does or does not possesses the resource under analysis. In the case of the selected variables that are of numerical type, they have been transformed into dichotomous categories. Thus, besides being adequate to the statistical model, the analysis and the interpretation of the results were simplified. The twenty-six variables that characterize the material conditions of the educational institutions will henceforth be referred to as school infrastructure items.
Table 1. School Infrastructure Items under analysis by category
Basic Resources Facilities Equipment Didactic Facilities
Water – supplied Boardroom TV Computer Lab
Water – supplied by the public
water supply network Teachers’ room DVD Science Lab Electricity – supplied Kitchen Copy machine Room for specialized assistance
Electricity – supplied via public
electric power distribution Bathrooms – inside the building Printer Sports court – covered or uncovered Sanitary sewer – available Bathrooms – accessible for people with special needs Computer – for administrative use Library or Reading/Study room
Sanitary sewer – carried out by
the public sewer system Facilities – accessible for people with special needs Computer – for the students -
Garbage – periodic collection
system School building – to be used exclusively for the school Internet access -
These twenty-six items were submitted to a latent class analysis (LCA) model in order to verify the existence of possible profiles of school infrastructure among Brazilian public fundamental schools. The modeling used here is expressed by the equation (1)
𝑃(𝑌 = 𝑦) = � 𝛾𝑐 𝐶
𝑐=1
� � 𝜌𝑗,𝑟𝐼(𝑦𝑗|𝑐𝑗=𝑟𝑗) 𝑅𝑗
𝑟𝑗=1 𝐽
𝑗=1
where: 𝑦𝑗 represents an element j of a response pattern y;
each ρ indicates the probabilities of observing a given response conditioned to belonging to the latent class; I (𝑦𝑗= 𝑟𝑗) is an indicator function equal to 1, when the
response to the variable j=𝑟𝑗 or, otherwise, the function
indicator acquires value equal to 0; the probability of belonging to the different latent classes is indicated by each
𝑦, according to Collins and Lanza [19].
The use of this model allowed the finding of patterns of school infrastructure from the items available in the educational institutions. Statistical significance tests indicated that a four-class model was the most appropriate. In this study, these classes will be called school infrastructure cluster.
2.3. School Socioeconomic Level
The classification of the educational institutions regarding the socioeconomic level of their students is of great importance for many research projects in sociology of education. However, the data available in Brazil still represent an obstacle to the studies carried out in the country [20]. In view of this scenario, this study aims at contributing to the study of the socioeconomic level of Brazilian schools, proposing the development of a socioeconomic level indicator for public fundamental education institutions, based on data from the Bolsa Família Program (PBF), an initiative of the Federal Government destined to implement the direct transfer of money to poor and extremely poor families of the country, thus being classified according to parameters established by the program itself.
In order to qualify for the benefit, besides meeting the maximum income criteria established by the PBF, families
need to comply with certain conditionalities related to health and education. Regarding education, beneficiaries of the PBF who have children and/or adolescents between the ages of 6 and 15 years must ensure that they are enrolled and that they have a minimum monthly school attendance of 85% of credit hours. Regarding adolescents aged 16 or 17 years, the requirement in terms of attendance is 75% of the total number of classes [21].
Based on the observation of school attendance from the students whose families are included in the PBF, it is possible to identify, in each Brazilian school, how many students are poor or extremely poor. The data are used to assess the socioeconomic level of the schools, through the development of the Poverty in School Indicator (Indicador de Pobreza na Escola - IPE). The IPE expresses the percentage of students who receive the benefit in each school, in relation to the number of enrolled students between the ages of 6 and 17 years.
The IPE has as a presupposition an idea that is present in many studies. In Brazil, schools may be quite heterogeneous, but tend to have internal socioeconomic homogeneity, as they cater to relatively specific social strata and are mostly attended by students from families with similar incomes [22-24]. Therefore, the higher the IPE of a school is, the higher the percentage of poor students in that institution is. Additionally, students in that school who are not included in the PBF will tend to be poorer than those students who are not included in the PBF but who are in schools with a lower IPE.
3. Results
Based on the delimitation of the schools that will be analyzed in this study, among the 141,260 institutions that offer fundamental education, according to the data from the 2013 School Census, 109,304 are studied here5, namely, state and municipal schools that have been active for at least six years.
3.1. The School Infrastructure Clusters
The public fundamental education schools, characterized by the 26 infrastructure items, after being submitted to the LCA model, showed a better statistical adjustment with respect to four classes, named as: upper cluster, upper medium cluster, lower medium cluster and lower cluster.
Table 2 presents information on the distribution of schools between the infrastructure clusters and the number of students enrolled in each of these sets of educational institutions.
[image:4.595.62.551.435.561.2]The upper cluster has the largest number of schools, including 42.2% of the total schools surveyed. In addition, the institutions belonging to this cluster have a higher average number of students, that is, 552 students between the ages of 6 and 17 years. Altogether, schools belonging to the upper cluster concentrate 81.2% of total enrollments (Table 2).
The upper medium cluster, on the other hand, covers 23.7% of all schools. These schools account for more than 4.6 million enrollments, corresponding to 14.7% of the total number of students. The institutions included in the upper medium cluster have an average of 178 students, according to Table 2.
The number of schools classified in the upper medium cluster and the number in the lower medium cluster are very close. In spite of that, lower medium cluster schools have a much smaller share of the total enrollment, accounting for only 3.0% of the students. On average, there are 38 students
in the schools part of this cluster (Table 2).
On the contrary, the lower cluster is, at the same time, the one that groups a smaller number of schools, the smallest number of enrollments and the smallest average number of students. Although 11.3% of the institutions have infrastructure conditions characterized in the lower cluster, they account for only 1.1% of the total number of students, since there are 27 students on average in this cluster (Table 2).
Table 2 also shows a group of schools with an ambiguous profile. They were not included in any of the four clusters, since they do not identify with any of them in particular. For this reason, the school infrastructure cluster characterization process will, from this moment on, cover only the 109,186 institutions classified in one of the four clusters.
Otherwise, Table 3 shows that the average of school infrastructure items of the schools gathered in each cluster is quite different. Altogether, having as reference the 26 infrastructure items analyzed, each public fundamental education school has, on average, 15.1 of these items.
Regarding the different types of items, it is noteworthy that it is in the didactic facilities category that the institutions have fewer of the resources evaluated. Among the five items grouped in the didactic facilities category, public fundamental education schools have, on average, only 1.5 of them (Table 3).
Table 2. Schools and Student Enrollment per School Infrastructure Cluster in the Public Fundamental Schools, Brazil 2013
INFRASTRUCTURE CLUSTER
SCHOOLS ENROLLMENT
Number Percentage Number Percentage Average Deviation Standard Upper 46.134 42,2 25.458.708 81,2 552 383,5
Upper Medium 25.896 23,7 4.602.571 14,7 178 196,1
Lower Medium 24.781 22,7 927.809 3,0 38 49,2
Lower 12.375 11,3 333.221 1,1 27 33,4
Ambiguous 118 0,1 23.768 0,1 201 226,5
Total 109.304 100,0 31.346.077 100,0 287 355,2
Source: Elaborated by the authors based on the INEP/School Census 2013
Table 3. Average of School Infrastructure Items in each Item Category per School Infrastructure Cluster, Brazil 2013
INFRASTRUCTURE CLUSTER
ITEM CATEGORY
Total (26 items) Basic Resources
(7 items) Facilities (7 items) Equipment (7 items)
Didactic Facilities (5 items)
Upper 6,5 5,8 6,6 3,0 22,0
Upper Medium 5,1 4,0 4,7 1,0 14,8
Lower Medium 4,0 2,9 1,0 0,1 8,1
Lower 2,0 1,6 0,1 0,02 3,8
Total 5,1 4,3 4,1 1,5 15,1
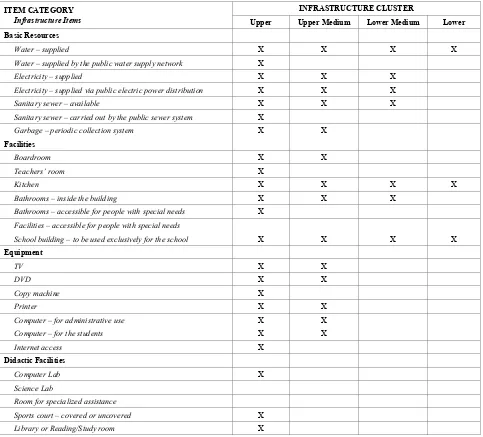
[image:4.595.62.549.590.712.2]Table 4. School Infrastructure Items available in most of the Institutions per School Infrastructure Cluster, Brazil 2013
ITEM CATEGORY Infrastructure Items
INFRASTRUCTURE CLUSTER
Upper Upper Medium Lower Medium Lower Basic Resources
Water – supplied X X X X
Water – supplied by the public water supply network X
Electricity – supplied X X X
Electricity – supplied via public electric power distribution X X X
Sanitary sewer – available X X X
Sanitary sewer – carried out by the public sewer system X
Garbage – periodic collection system X X
Facilities
Boardroom X X
Teachers’ room X
Kitchen X X X X
Bathrooms – inside the building X X X
Bathrooms – accessible for people with special needs X
Facilities – accessible for people with special needs
School building – to be used exclusively for the school X X X X
Equipment
TV X X
DVD X X
Copy machine X
Printer X X
Computer – for administrative use X X
Computer – for the students X X
Internet access X
Didactic Facilities
Computer Lab X
Science Lab
Room for specialized assistance
Sports court – covered or uncovered X
Library or Reading/Study room X
Source: Elaborated by the authors based on the INEP/School Census 2013.
Using as reference the information presented in Table 4, it is possible to characterize in a more detailed way the school infrastructure profiles of the education institutes included in each one of the clusters. Among the 26 school infrastructure items surveyed in this table, there are those that are present in at least half of the institutions in that cluster. In the synthesis of the general characterization of the clusters, presented later on, the data found in this table will be better explained.
Table 5, on the other hand, shows the administrative dependency and the location of the total number of schools analyzed and of the institutions classified in each school infrastructure cluster. Among the schools surveyed, 78.3%
are under municipal administrative dependency and 55.2% are located in urban areas. Institutions under municipal administrative dependency predominate in the four infrastructure clusters, reaching 97.7% in the lower medium cluster. Contrarily, in the case of the upper cluster, there is a relative balance in the division of schools regarding administrative dependency, since 43.7% of state institutions are in this group.
[image:5.595.65.548.91.528.2]Table 5. Percentage of Schools in each School Infrastructure Cluster per Administrative Dependency and Location, Brazil 2013
INFRASTRUCTURE
CLUSTER ADMINISTRATIVE DEPENDENCY LOCATION
State Municipal Urban Rural
Upper 43,7 56,3 90,4 9,6
Upper Medium 8,8 91,2 26,8 73,2
Lower Medium 2,3 97,7 1,2 98,8
Lower 5,2 94,8 0,0 99,9
Total 21,7 78,3 44,8 55,2
Source: Elaborated by the authors based on the INEP/School Census 2013.
Source: Elaborated by the authors based on the INEP/School Census 2013.
Chart 1. Percentage of Schools in Each Region of the Country per School Infrastructure Cluster, Brazil 2013
Regarding the participation of the different infrastructure clusters among the schools located in each of the Brazilian geographic regions, it is possible to highlight that most institutions in the Midwest, South and Southeast regions are part of the upper cluster (Chart 1). These three regions also stand out because they have very few schools that are classified in the lower cluster.
Contrarily, the Northern region of the country is the region that displays the poorest school infrastructure conditions. Most schools in the North of Brazil were included in the lower cluster and in the lower medium cluster, which account for 41.1% and 19.8%, respectively, of the educational institutions. In the Northeast region, most of the schools have the infrastructure characteristics of the lower medium cluster at 36.4%, and of the upper medium cluster at 31.9%, according to Chart 1.
3.2. Poverty in School Indicator (Indicador de Pobreza na Escola – IPE)
The results regarding the relationship between the school infrastructure clusters and the average IPE of the institutions are available in Table 6. Overall, public fundamental education schools have a total average IPE of 57.5. The upper cluster stands out due to the fact that its average IPE is significantly lower than the others. Only in
this cluster is the average IPE of the schools below the average IPE of all the schools added up. On the other hand, the lower medium and the lower clusters have a relatively approximate average IPE of 76.6 and 79.2, respectively (Table 6).
Considering the data in Table 6, it can be stated that the better the infrastructure of the schools, the lower the average IPE of the cluster. In other words, overall, the average proportion of students in poverty and extreme poverty in the best-equipped institutions is lower. Therefore, there is a negative relationship between infrastructure items and the IPE of the schools.
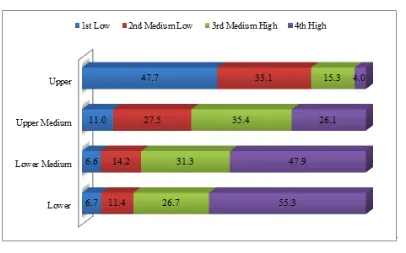
Chart 2 reaffirms this relationship. It shows how the schools in each infrastructure cluster are distributed among the quartiles6 of the IPE, denominated: low, medium low, medium high and high. As expected, in view of the relatively high standard deviations presented in Table 6, the four infrastructure clusters have schools located in all IPE quartiles. Nevertheless, the different school distribution percentages in each cluster among the IPE quartiles explain the relationship between better school infrastructure and
6 The upper limits of the IPE quartiles are: 1st Quartile - Low (IPE 31.9);
2nd Quartile - Medium Low (IPE 56.2) and 3rd Quartile - Medium High IPE
[image:6.595.114.544.88.425.2]lower percentage of schools with a high proportion of poor students. The schools found in the upper cluster are mostly concentrated on the 1st quartile, indicating a low IPE. The majority of the schools in the upper medium cluster have a high average IPE, equivalent to the 3rd quartile. Contrarily, among the educational institutions found in the two worst infrastructure clusters there is a predominance of institutions with high IPE, representing 47.9% of the medium low group and 55.3% of the lower group, according to Chart 2.
In addition, it should be noted that among the schools that
exclusively have students benefiting from the PBF, IPE equal to 100, the association between greater poverty and more precarious schools is even more noticeable. Less than 5% of the institutions that only have enrollments of poor or extremely poor students, a group that corresponds to 15.6% of the total public fundamental education schools, have an infrastructure profile of the upper cluster. Thus, the chances that a student who is a beneficiary of the PBF has of studying at a school classified in the lower infrastructure group are 5.1 times greater than those of a student whose family is not assisted by the PBF.
Table 6. Poverty in School Indicator (IPE) per School Infrastructure Cluster, Brazil 2013
INFRASTRUCTURE CLUSTER POVERTY IN SCHOOL INDICATOR (IPE) Average Standard Deviation
Upper 37,5 22,1
Upper Medium 64,5 24,9
Lower Medium 76,6 24,6
Lower 79,2 25,4
Total 57,5 29,7
Source: Elaborated by the authors based on the INEP/School Census 2013 e MEC/Sistema Presença 2013.
Source: Elaborated by the authors based on the INEP/School Census 2013 e MEC/Sistema Presença 2013.
[image:7.595.105.511.360.613.2]3.3. General Characterization of the Infrastructure Clusters - Synthesis
Considering the results already presented, it is possible to characterize the school infrastructure clusters according to the following synthesis:
Upper Cluster – Characterized by schools that have a more complete infrastructure, possessing, for the most part, all the items in the categories basic resources, facilities and equipment surveyed. However, not even in this group do most of the schools have a science laboratory and/or a room for specialized assistance among the didactic facilities. This is also the cluster that aggregates the largest number of schools, predominating in the South, Southeast and Midwest regions of the country. In this group, large urban schools with a low average IPE and strong state administrative presence prevail;
Upper Medium Cluster – formed by institutions that have the second highest average number of school infrastructure items. Most of their schools have the basic resources, although access to water and sewerage is precarious7. On average, these schools have only one of the didactic facilities, the computer lab being the most common. In general, they do not have a teacher's room, nor are they accessible to students with special needs. The institutions in this group have a large part of the surveyed equipment, although less than half of them have a copier or Internet connection. This cluster, which has the second largest average number of students and accounts for about a quarter of the total number of schools, is mainly composed of rural municipal institutions and has the second lowest average IPE among the groups;
Lower Medium Cluster – it is formed by schools that, for the most part, operate in buildings that only have sanitary and kitchen facilities, and in which, with the exception of electric power, the access to basic resources is precarious. None of the didactic facility items are available in more than half of the schools in this cluster. Among the equipment, these institutions count on average with only one, being a television set the most common. This group has the second highest average IPE and is composed mainly of small rural schools under municipal administrative dependency. It is the profile of schools that are preponderant in the Northeastern region of the country;
Lower Cluster – composed of schools that have, on average, two basic resources, with access to water and sanitary sewage being the most common, both of which available in a precarious way. In other words, most of these schools function without electricity and without periodic garbage collection. Additionally, none of the surveyed equipment or the teaching facilities is available in more than half of the schools in this cluster. Overall, these institutions operate in a school building whose only available facility is
7 This work interprets as precarious any access to water and sanitary sewer that are not carried out via some public network.
a kitchen, and without any indoor bathrooms. Among the groups presented, this is the group that has the lowest number of schools, although it is the predominant profile among the educational institutions in the Northern region of the country. This cluster is also characterized by concentrating the schools with the lowest average number of students, with the highest average IPE and by being formed almost exclusively by rural schools under municipal administrative dependency.
4. Discussion
The results presented in this study have similarities and differences in relation to the literature on school infrastructure in Brazil.
As in this study, Soares Neto et al. [16] divide the infrastructure of Brazilian schools into four classes: basic, regular, adequate and advanced. Those authors selected 22 variables from the 2011 School Census, which largely coincide with the 26 variables used in the present study. However, in addition to the methodological differences, the fact that they work with all stages of basic education, and also the fact that they include federal and private public institutions in their research, the proportion of schools and their characteristics in each of the four levels of infrastructure differ greatly from the clusters presented here in the present paper. In the framework described by the authors, 84.5% of the schools are in the two worst infrastructure categories and only 0.6% of the institutions have reached the advanced level.
The inequality in the infrastructure of Brazilian schools has been related in many studies, among other aspects, to the location of the schools themselves [12-14]. Corroborating with these studies, the results introduced here show that more than 90% of the schools in the upper cluster are urban, although they are not the majority among the public institutions of fundamental education. On the other hand, the two groups with the worst infrastructure have more than 98% of their schools located in rural areas.
As for the association between administrative dependency and the school infrastructure characteristics, the results displayed here show that, in general, state institutions have better material working conditions than municipal institutions, such as those noted in previous studies [15,16]. While upper cluster schools are reasonably divided between municipal and state administrations, the three other school infrastructure clusters have more than 91.0% of schools under the responsibility of the municipal public authority. Among the schools under state authority, 85.2% have superior infrastructure, whereas only 5.2% belong to the combined lower medium and lower clusters.
greater fragility of the North and Northeastern regions of the country, the poorest ones, vis-à-vis the Midwest and, above all, the South and Southeastern regions of Brazil. Similarly, the results presented here show that, while in the latter three regions schools classified in the upper cluster predominate, when it comes to the Northeast, the institutions with lower medium profile are in the majority, and in the Northern region, most of the schools revealed a typical infrastructure of the lower cluster.
In relation to the size of the schools, Soares Neto et al. [17] claim that small public schools have poorer infrastructure conditions. Similarly, the results presented here show that the bigger the school, with respect to the number of students, the greater the variety of infrastructure items available. While the upper cluster schools have an average of 552 students, in the lower cluster group this number is only 27 students.
Regarding the association between the infrastructure and the socioeconomic level of the schools, some studies indicate that, in the Brazilian reality, this association is particularly significant [6, 10, 22]. These studies emphasize that students from richer families attend more structured educational institutions than students from more disadvantaged families. Since in Brazil it is common for higher-income students to study in private schools that have above-average infrastructure conditions, the results found in these studies are impacted by the differences between public and private schools.
In this study, due to its analysis having a focus on public institutions, it was possible to verify, without the bias of the differences between public and private schools, that even among public institutions the socioeconomic level plays an important role in the access to better educational opportunities. As expressed in the hypothesis of this study, public fundamental education schools that have the worst infrastructure conditions are mostly attended by students benefiting from the PBF, in other words, poor or extremely poor students. Faced with this reality, it is fundamental that changes occur in the actions and in the investments made by the State. To the greatest extent possible, public policies should act to eliminate the association between poverty and access to schools that have the worst infrastructure.
In a study focused on small schools, Soares Neto et al. [17] show that among the smaller schools there are more institutions with high percentage of students benefiting from the PBF. By not isolating fundamental education schools or restricting student enrollment to the ages between 6 and 17 (target public of the PBF), the results defended by the authors underestimated the correlation between school infrastructure and poverty in the country, whose importance is evidenced by the data presented here.
5. Conclusions
The use of school attendance data from students
benefiting from the Bolsa Família Program (Programa Bolsa Família - PBF) proved to be efficient in differentiating the socioeconomic level of the educational institutions. In addition to presenting a simple and easily interpreted methodology, the development of the Poverty Indicator in School (Indicador de Pobreza na Escola - IPE) made it possible to classify even the smallest schools. As there are few data available on small educational institutions, many studies produce socioeconomic level indicators that do not include the smallest schools [20], a group that presents the most vulnerable schools.
Some considerations can also be made regarding the use of data from the School Census to characterize the infrastructure of the educational institutions. As a positive aspect, one can highlight the fact that because the School Census is a census survey, it presents information on all educational establishments in the country. On the other hand, the questionnaire does not address aspects such as use, conservation, maintenance or quality of the surveyed school infrastructure items. The information collected by the School Census pertains to the existence or not of certain infrastructure elements in each school. Concerning some of the surveyed items, the research reports on the quantity available in each institution. This characteristic of the School Census, while meeting the objectives of this study, makes it difficult to identify differences between the educational institutions when they have the surveyed items, especially among urban state schools.
The association between these two databases, namely, the number of students benefiting from the PBF and the infrastructure of educational institutions assessed by the School Census, leads to the discussion about inequalities in the fulfillment of the right to education in Brazil. Furthermore, due to the approach focused on public schools it was possible to verify the significant differences among them.
This paper did not discuss the existence of causality between school infrastructure and student socioeconomic status. However, the results presented here show an unacceptable association between these two aspects. State action via public policies, particularly education, should contribute to mitigating the effects of social inequality. Instead, by offering fewer school opportunities to the most financially disadvantaged, the Brazilian government contributes to the lack of equity in education and to the strengthening of injustice in the country [25].
Furthermore, this study verified that the socioeconomic level of the students is also a dividing factor in terms of access to school infrastructure. This paper has shown that public fundamental education institutions with access offered to the most financially disadvantaged have poorer infrastructure conditions than those available to social groups with a slightly better socioeconomic situation.
In a "system of inequalities", fragile social groups tend to accumulate difficulties: worse conditions of housing, transportation, work, food, health, etc. [27]. In addition to all these adversities deriving from living conditions in a reality of poverty, in Brazil the poor and extremely poor also suffer from the unequal action of the State. Public policies in education in the country offer schools in the worst infrastructural conditions to students coming from families with a lower socioeconomic level.
Thus, the results of this study also indicate that the public policies aimed at broadening the quality of education in Brazil must be focused on the pursuit of equity [28], notably among groups with different socioeconomic levels, showing that it is necessary to combine universalist policies with actions focused on the schools attended by low-income students.
Acknowledgements
This research was partially supported by Secadi, a department of the Brazilian Ministry of Education (MEC). We are also thankful for the contributions received during the Third ISA Forum of Sociology – International Sociological Association (Vienna, 2016).
REFERENCES
[1] C. Maroy. Convergências e divergências dos modos de regulação numa perspectiva européia. In: J. Barroso (Org.). A regulação das políticas públicas de educação: espaços, dinâmicas e atores, Educa, Lisboa, 2006.
[2] J. S. Coleman, et al. Equality of educational opportunity, U.S. Government Printing Office, Washington, 1966.
[3] C. Franco, et al. Qualidade e equidade em educação: reconsiderando o significado de ‘fatores intra-escolares’. Ensaio: Avaliação e Políticas Públicas em Educação, 15, nº 55, 277-298, 2007.
[4] G. R. Jesus, J. A. Laros. Eficácia escolar: regressão multinível com dados de avaliação em larga escala, Avaliação Psicológica, 3, nº 2, 93-106, 2004.
[5] J. L. R. Riani, E. L. G. Rios-Neto. Background familiar versus perfil escolar do município: qual possui maior impacto no resultado educacional dos alunos brasileiros. Brasileira de Estudos de População, 25, nº 2, 251-269, 2008.
[6] J. F. Soares, C. C. Cesar, J. Mambrini. Determinantes do desempenho dos alunos do ensino básico brasileiro: evidências
do SAEB de 1997. In: C. Franco. Avaliação, ciclos e promoção da educação, Artmed, Porto Alegre, 2001.
[7] M. E. F. Barbosa, C. Fernandes. A escola faz diferença? Uma investigação dos efeitos da escola na proficiência em matemática dos alunos da 4ª série. In: C. Franco. Avaliações, ciclos e promoção na educação, Artmed, Porto Alegre, 2001. [8] M. P. Morais, M. A. Costa. Infraestrutura urbana e social no
Brasil: subsídios para uma agenda social de pesquisa e formulação de políticas públicas, IPEA, Brasília, 2010. [9] L. F. Abrúcio. Gestão escolar e qualidade da educação: um
estudo sobre dez escolas paulistas, Estudos & Pesquisas Educacionais, n.1, p.241-74, 2010.
[10] J. Duarte, C. Gargiulo, M. Moreno. School infrastructure and learning in Latin American elementary education: an analysis based on the SERCE. Inter-American: Inter-American Development Bank, 2011.
[11] A. Haguette, M. K. M. Pessoa, E. M. Vidal. Dez escolas, dois padrões de qualidade : uma pesquisa em dez escolas de ensino médio do estado do Ceará, Ensaio : aval. pol. públ. Educ. v.24, n.92, p.609-636, 2016.
[12] J. M. R. Pinto, et al. O desafio da educação do campo.” In: A. M. Bof. A educação no Brasil rural, 236, INEP, Brasília, 2006. [13] N. Sátyro, S. Soares. Infraestrutura das escolas brasileiras e desempenho escolar. In: M. P. Morais, M. A. Costa. Infraestrutura urbana e social no Brasil: subsídios para uma agenda social de pesquisa e formulação de políticas públicas, Vol. 2, IPEA, Brasília, 151-192, 2010.
[14] J. F. Soares, R. J. Andrade. Nível Socioeconômico, qualidade e equidade das escolas de Belo Horizonte, Ensaio: Avaliação e Políticas Públicas em Educação, 14, nº 50, 107-126, jan/mar, 2006.
[15] A. Albernaz, F. H. G. Ferreira, C. Franco. Qualidade e equidade no ensino fundamental brasileiro. Pesquisa e Planejamento Econômico, 32, nº 3, 453-476, 2002.
[16] J. J. Soares Neto, et al. Uma escala para medir a infraestrutura escolar, Estudos em Avaliação Educacional, 24, nº 54, 78-99, jan./abr., 2013.
[17] J. J. Soares Neto, et al. A infraestrutura das escolas públicas brasileiras de pequeno porte. Revista do Servidor Público, 64, nº 3, 377-391, 2013.
[18] C. A. Cerqueira, D. R. O. T. Sawyer. Tipologia dos estabelecimentos escolares brasileiros, Brasileira de Estudos de População, 24, nº 1, 53-67, jan./jun., 2007.
[19] L. M. Collins, S. T. Lanza. Latent Class and Latent Transition Analysis: with applications in the Social, Behavioral, and Health Sciences, John Wiley & Sons, Hoboken, 2010. [20] M. T. G. Alves, J. F. Soares, F. P. Xavier. Índice
socioeconômico das escolas de educação básica brasileiras, Ensaio: Avaliação e Política Pública em Educação, 22 , nº 84, 671-704, jul/set, 2014.
[21] S. R. de Freitas. Programa Bolsa Família e condicionalidade educação : primeiras aproximações, Reunião Regional da Anped, Curitiba, 2016.
investigação da escola eficaz, Brasileira de estudos de população, 18, nº 1/2, 111-130, jan./dez., 2001.
[23]P. Fletcher. À procura da escola eficaz. MEC/DAEB, Brasília, 1998
[24]J. F. Soares, J. F. Candian. O efeito da escola básica brasileira: as evidências do PISA e do SAEB, Revista Contemporânea de Educação, 2, nº 4, 1-12, 2007.
[25] J. Rawls. A Theory of Justice, Belknap Press of Harvard University Press, Cambridge, 1971.
[26] M. Arretche. Trazendo o conceito de cidadania de volta : a propósito das desigualdades territoriais. In :M. Arretch (Org.). Trajetórias das desigualdades: como o Brasil mudou nos últimos cinquenta anos, Unesp ; CEM, São Paulo, 2015. [27] A. Bihr, R. Pfefferkorn. Le systéme des inégalités, La
Découverte, Paris, 2008.