Open Access
Vol 13 No 6Research
Hemostasis during low molecular weight heparin anticoagulation
for continuous venovenous hemofiltration: a randomized
cross-over trial comparing two hemofiltration rates
Heleen M Oudemans-van Straaten
1,3, Muriel van Schilfgaarde
2, Pascal J Molenaar
2,
Jos PJ Wester
1and Anja Leyte
21Department of Intensive Care Medicine, Onze Lieve Vrouwe Gasthuis, Oosterpark 9, 1091 AC Amsterdam, The Netherlands 2Department of Clinical Chemistry, Onze Lieve Vrouwe Gasthuis, Oosterpark 9, 1091 AC Amsterdam, The Netherlands 3Institutional address: Onze Lieve Vrouwe Gasthuis, PO Box 95500, 1091 AC Amsterdam, The Netherlands
Corresponding author: Heleen M Oudemans-van Straaten, [email protected]
Received: 6 Aug 2009 Revisions requested: 2 Oct 2009 Revisions received: 28 Oct 2009 Accepted: 3 Dec 2009 Published: 3 Dec 2009
Critical Care 2009, 13:R193 (doi:10.1186/cc8191)
This article is online at: http://ccforum.com/content/13/6/R193 © 2009 Oudemans-van Straaten et al.; licensee BioMed Central Ltd.
This is an open access article distributed under the terms of the Creative Commons Attribution License (http://creativecommons.org/licenses/by/2.0), which permits unrestricted use, distribution, and reproduction in any medium, provided the original work is properly cited.
Abstract
Introduction Renal insufficiency increases the half-life of low molecular weight heparins (LMWHs). Whether continuous venovenous hemofiltration (CVVH) removes LMWHs is unsettled. We studied hemostasis during nadroparin anticoagulation for CVVH, and explored the implication of the endogenous thrombin potential (ETP).
Methods This cross-over study, performed in a 20-bed teaching hospital ICU, randomized non-surgical patients with acute kidney injury requiring nadroparin for CVVH to compare hemostasis between two doses of CVVH: filtrate flow was initiated at 4 L/h and converted to 2 L/h after 60 min in group 1, and vice versa in group 2. Patients received nadroparin 2850 IU i.v., followed by 380 IU/h continuously in the extracorporeal circuit. After baseline sampling, ultrafiltrate, arterial (art) and postfilter (PF) blood was taken for hemostatic markers after 1 h, and 15 min, 6 h, 12 h and 24 h after converting filtrate flow. We compared randomized groups, and 'early circuit clotting' to 'normal circuit life' groups.
Results Fourteen patients were randomized, seven to each group. Despite randomization, group 1 had higher SOFA scores (median 14 (IQR 11-15) versus 9 (IQR 5-9), p = 0.004). Anti-Xa
art activity peaked upon nadroparin bolus and declined thereafter
(p = 0.05). Anti-Xa PF did not change in time. Anti-Xa activity was
not detected in ultrafiltrate. Medians of all anti-Xa samples were lower in group 1 (anti-Xa art 0.19 (0.12-0.37) vs. 0.31 (0.23-0.52), p = 0.02; anti-Xa PF 0.34 (0.25-0.44) vs. 0.51
(0.41-0.76), p = 0.005). After a steep decline, arterial ETPAUC tended
to increase (p = 0.06), opposite to anti-Xa, while postfilter ETPAUC increased (p = 0.001). Median circuit life was 24.5 h (IQR 12-37 h). Patients with 'short circuit life' had longer baseline prothrombin time (PTT), activated thromboplastin time (aPTT), lower ETP, higher thrombin-antithrombin complexes (TAT) and higher SOFA scores; during CVVH, anti-Xa, and platelets were lower; PTT, aPTT, TAT and D-dimers were longer/ higher and ETP was slower and depressed.
Conclusions We found no accumulation and no removal of LMWH activity during CVVH. However, we found that early circuit clotting was associated with more severe organ failure, prior systemic thrombin generation with consumptive coagulopathy, heparin resistance and elevated extracorporeal thrombin generation. ETP integrates these complex effects on the capacity to form thrombin.
Trial registration Clinicaltrials.gov ID NCT00965328
Introduction
Acute kidney injury (AKI) is a severe complication of critical ill-ness, generally developing as a component of multiple organ failure. If renal replacement therapy is required, continuous techniques are often preferred especially in patients with insta-ble circulation. To prevent clotting in the extracorporeal circuit, continuous anticoagulation is needed and heparins are the classic choice. Both unfractionated heparin and low molecular weight heparins (LMWHs) are used. LMWHs have the advan-tage that their pharmacokinetics are more predictable due to less binding to proteins and cells [1]. Their clearance is, how-ever, slower. In addition, renal insufficiency increases half-life of smaller heparin fragments resulting in accumulation of anti-Xa activity, but not of anti-IIa activity [2,3]. Bleeding complica-tions increase when glomerular filtration rate falls below 30 ml/ min. The biological activity and behavior of LMWHs during continuous renal replacement therapy is still controversial. Although a previous study found no elimination of LMWHs [4], a recent small study using enoxaparin reported partial removal of anti-Xa activity by filtration and dialysis [5].
Hemostatic changes during continuous renal replacement therapy in the critically ill are complex due to simultaneous pro-and anticoagulant processes. Routine prothrombin time (PTT) and activated partial thromboplastin time (aPTT) assays moni-tor clot formation but are insensitive to hypercoagulant states, especially during anticoagulation. Plasma anti-Xa activity measures anticoagulant activity of LMWHs. The endogenous thrombin potential (ETP) reflects thrombin generation beyond the initiation of clot formation and may be more informative with regard to the presence of an anti- or procoagulant state [6].
The aim of this explorative study in patients with AKI receiving the LMWH nadroparin for anticoagulation of the continuous venovenous hemofiltration (CVVH) circuit was to determine whether anti-Xa activity accumulates, whether it is removed by filtration, and to determine whether ETP could have a role in monitoring hemostasis and circuit clotting. As heparins are a heterogenic mixture of molecules, drug concentrations cannot be measured directly. We therefore assessed its anticoagu-lant activity (anti-Xa), which is its clinically relevant effect.
Materials and methods
Study design and setting
This prospective randomized cross-over trial was conducted in a 20-bed closed format general intensive care unit (ICU) of a teaching hospital. CVVH is the only renal replacement modality used in the unit and is performed under responsibility of the intensivists. Nadroparin is the standard anticoagulant for CVVH in patients without an increased risk of bleeding. The institutional review board approved the study according to European and Dutch legislation. Written informed consent was acquired from the patient or his legal representative.
Patients and randomization
Adult critically ill patients with acute renal failure requiring CVVH were eligible for inclusion. Exclusion criteria were (recent) bleeding or a suspicion of bleeding necessitating transfusion, need of therapeutic anticoagulation or (sus-pected) heparin-induced thrombocytopenia. CVVH was initi-ated when, after resuscitation of the circulation, oliguria persisted and was accompanied by a steep rise in serum cre-atinine, or at a non-declining rise in creatinine in non-oliguric patients. Randomization was computer-based. When inclu-sion and excluinclu-sion criteria were checked in the patient data management system (MetaVision®, IMDSoft, Tel Aviv, Israel),
the system automatically randomized the patients.
Study protocol
Patients were randomized to one of two groups. In group 1, postdilutional CVVH was initiated at a filtrate flow of 4 L/h (blood flow 220 ml/min), which was converted to 2 L/h (blood flow 150 ml/min) after 60 minutes. In group 2, postdilutional CVVH was initiated at a filtrate flow of 2 L/h and converted to 4 L/h after 60 minutes. The cross-over design was chosen to detect differences in plasma and ultrafiltrate anti-Xa activity in case of elimination of anti-Xa activity by filtration. The 4 L/h dose is our default starting dose in the unit, which is normally reduced to 2 L/h if uremic toxins are low and circulation has stabilized.
We used a 1.9 m2 cellulose triacetate hollow fiber membrane
(UF 205, Nipro, Osaka, Japan), bicarbonate buffered replace-ment fluids heated to 39°C, and the Aquarius device (Edwards LifeSciences, S.A., Saint-Prex, Switzerland). Nadroparin (Sanofi-Synthelabo, Maassluis, the Netherlands) was added to the one-liter priming solution (2850 IU). Patients received an intravenous bolus of 2850 IU nadroparin at initiation of CVVH, or 3800 IU when body weight exceeded 100 kg, followed by a continuous infusion in the extracorporeal circuit before the fil-ter of 380 or 456 IU/h, respectively.
Biochemical measurements
Blood was collected into a 4.5 ml tube containing 0.105 M sodium citrate for coagulation measurements and in a 4 ml tube containing 7.5% potassium EDTA for hemocytometry (Becton Dickinson, Plymouth, UK). Citrated blood was centri-fuged at 1500 g for 10 minutes, and plasma aliquots were stored at -80°C. Aliquots of ultrafiltrate samples were frozen at -80°C until use. The following assays were performed immedi-ately after sampling: PTT (Innovin), aPTT (Actin FS) and anti-thrombin (Berichrom ATIII) on a Sysmex CA-1500 coagulation analyzer (all Siemens Healthcare Diagnostics, Deerfield, IL, USA), and platelet counts on a Sysmex XE-2100 hematology analyzer (Sysmex, Kobe, Japan).
Anti-Xa activity was determined in ultrafiltrates and citrated plasma to assess the anticoagulant activity of the LMWH nadroparin using the Coamatic Heparin kit (Chromogenix, Instrumentation Laboratory Company, Lexington, MA, USA). For determination of anti-Xa in ultrafiltrate, anti-Xa activity was determined after addition of an equal volume of normal plasma (Standard Human Plasma, Siemens Healthcare Diagnostics Deerfield, IL, USA) to the ultrafiltrate to provide for a suitable matrix and the presence of antithrombin. The sensitivity of our anti-Xa assay, (detection limit 0.01 U/ml) albeit negatively influ-enced by a factor 2 when measuring ultrafiltrate because of the need to add normal plasma, is sufficient to demonstrate relevant anti-Xa removal. Analytical precision, characterized by a coefficient of variation percentage of less than 2.5 at the higher anti-Xa levels, is adequate to detect relevant accumula-tion in plasma if present.
The ETP was measured as an overall indicator of hemostasis. The ETP monitors the thrombin-forming capacity of plasma, including the generation and inhibition of thrombin generation beyond the initiation of fibrin clot formation providing an overall assessment of hemostasis and potential extra-hemostatic effects of the generated thrombin [6]. The ETP is character-ized by 'lag time' (ETPTlag (s)), 'time to maximal activity' (ETP T-max (s)), 'maximal activity' (ETPCmax (mA/min)) and the main
parameter: 'area under the curve' (ETPAUC (mA)); the latter
rep-resents the total thrombin formation. ETP was determined on the BCS-XP (Siemens Healthcare Diagnostics, Deerfield, IL, USA) using the ETP-B protocol and reagents as provided and described by the manufacturer. In this protocol, thrombin for-mation is triggered via the addition of Innovin up to a final con-centration of 300 pM tissue factor, also providing for phospholipids. We have established a provisional reference range in our laboratory in 20 adults, representing +/- three standard deviations from the mean ETPTlag 14.4 to 22.1 s,
ETOTmax 48.5 to 60.0 s, ETPCmax 115 to 148 mA/min, and ETPAUC 346 to 520 mA.
Coagulation activation was additionally assayed by measuring the concentration of F1+2 and TAT. F1+2 are specifically gen-erated during the conversion of prothrombin to thrombin.
F1+2 levels were determined using the Enzygnost F1+2 (monoclonal) ELISA kit (Siemens Healthcare Diagnostics, Deerfield, IL, USA). Normal F1+2 values are reported to range from 69 to 229 pmol/l (kit insert information as provided by the manufacturer).
Once thrombin is generated one of the mechanisms of the body to down-regulate thrombin is to form TAT. TAT therefore reflects combined pro- and anticoagulant activity. TAT was determined using the Enzygnost TAT micro test kit. Normal val-ues are reported to range from 1 to 4.1 μg/l (kit insert informa-tion). D-dimers are early fibrin degradation products, and therefore markers of recent thrombus formation. D-dimer con-centrations were determined using the Tina-quant assay (Roche Diagnostics, Indianapolis, In, USA). Normal values are less than 0.5 μg/ml (kit insert information).
Clinical measurements
Severity of illness was scored using the Acute Physiology and Chronic Health Evaluation (APACHE) II and III systems and the Simplified Acute Physiology Score (SAPS) II system over the first 24 hours of ICU admission. The Sequential Organ Failure Assessment (SOFA) score as defined by the Dutch National Intensive Care Evaluation [7] was taken at the start of CVVH [8-11]. Renal function was classified according to the RIFLE (Risk, Injury, Failure) System [12]. Risk was scored as 1, injury as 2 and failure as 3.
Data analysis
In this explorative study, the data are analyzed for the rand-omized groups separately, for the entire group of patients, for patients with early circuit clotting compared with those with normal circuit life and for patients with high and low SOFA score separately. 'Early circuit clotting' was defined a circuit life less than the lower quartile, high SOFA score as SOFA score higher than the median. The data are presented as medi-ans (interquartile ranges (IQR)). We used the Friedman test to detect changes of a variable in time, the Mann-Whitney U test (asymptomatic two-tailed) to compare samples between groups, the Wilcoxon Signed Rank test to compare paired samples and the Spearman rank correlation coefficient (two-tailed) to determine whether variables were related. A P-value less than 0.05 was considered statistically significant. Because of the explorative nature of the study we did not cor-rect for multiple testing. We used SPSS 17.0 (SPSS Inc., Chi-cago, IL, USA) for analysis.
Results
transfusion, two in each group, none of the patients received plasma or platelet transfusion.
Coagulation markers in randomized groups
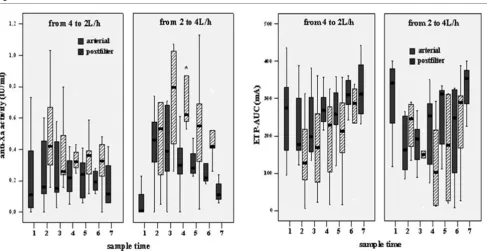
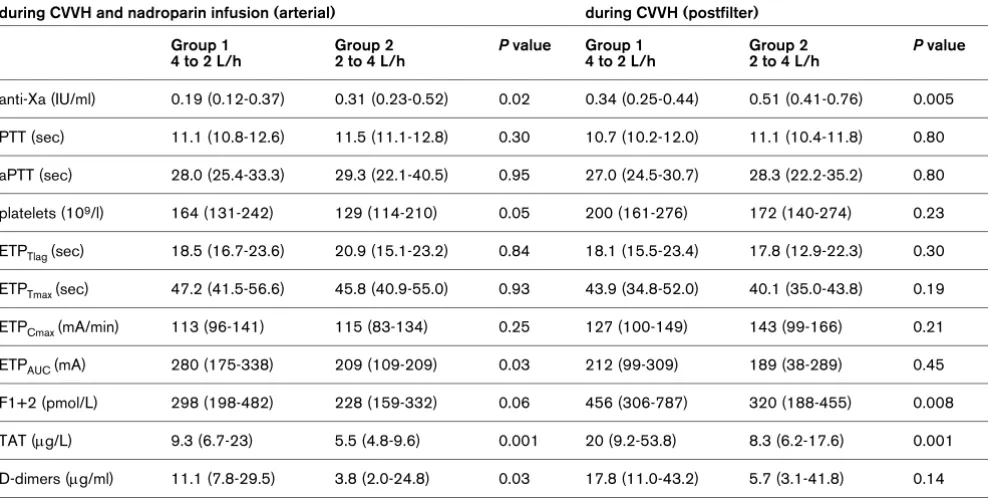
[image:4.612.60.551.114.596.2]The course of arterial and postfilter anti-Xa and ETPAUC is pre-sented for the two randomized groups separately in Figure 1. Median anti-Xa of all samples during CVVH was significantly lower in group 1 than in group 2, both in arterial blood and in Table 1
Patient characteristics
Group 1 4 L to 2 L/h
Group 2 2 L to 4 L/h
n = 7 N = 7
Age (years) 65 (38-69) 65 (60-75)
Male/female (n) 5/2 5/2
Body weight (kg) 75 (72-80) 75 (60-98)
Cause of ARF (n)
sepsis 5 5
cardiogenic shock 2 1
liver failure 1
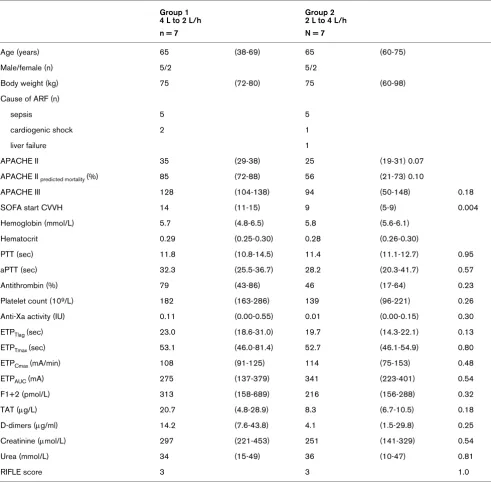
APACHE II 35 (29-38) 25 (19-31) 0.07
APACHE II predicted mortality (%) 85 (72-88) 56 (21-73) 0.10
APACHE III 128 (104-138) 94 (50-148) 0.18
SOFA start CVVH 14 (11-15) 9 (5-9) 0.004
Hemoglobin (mmol/L) 5.7 (4.8-6.5) 5.8 (5.6-6.1)
Hematocrit 0.29 (0.25-0.30) 0.28 (0.26-0.30)
PTT (sec) 11.8 (10.8-14.5) 11.4 (11.1-12.7) 0.95
aPTT (sec) 32.3 (25.5-36.7) 28.2 (20.3-41.7) 0.57
Antithrombin (%) 79 (43-86) 46 (17-64) 0.23
Platelet count (109/L) 182 (163-286) 139 (96-221) 0.26
Anti-Xa activity (IU) 0.11 (0.00-0.55) 0.01 (0.00-0.15) 0.30
ETPTlag (sec) 23.0 (18.6-31.0) 19.7 (14.3-22.1) 0.13
ETPTmax (sec) 53.1 (46.0-81.4) 52.7 (46.1-54.9) 0.80
ETPCmax (mA/min) 108 (91-125) 114 (75-153) 0.48
ETPAUC (mA) 275 (137-379) 341 (223-401) 0.54
F1+2 (pmol/L) 313 (158-689) 216 (156-288) 0.32
TAT (μg/L) 20.7 (4.8-28.9) 8.3 (6.7-10.5) 0.18
D-dimers (μg/ml) 14.2 (7.6-43.8) 4.1 (1.5-29.8) 0.25
Creatinine (μmol/L) 297 (221-453) 251 (141-329) 0.54
Urea (mmol/L) 34 (15-49) 36 (10-47) 0.81
RIFLE score 3 3 1.0
Values in median (interquartile range) unless indicated differently.
APACHE = Acute Physiology and Chronic Health Evaluation; aPTT = activated thromboplastin time; CVVH = continuous venovenous
hemofiltration; ETP = endogenous thrombin potential; ETPAUC = area under the curve of the thrombin generation curve; ETPCmax = maximal activity of ETP; ETPTlag = ETP lag time = ETPTmax = time to max ETP activity; F1+2 = prothrombin fragment; PTT = prothrombin time; SOFA = Sequential Organ Failure Assessment; TAT = thrombin-antithrombin complexes.
postfilter blood (Table 2). Anti-Xa activity was not detectable in the ultrafiltrate. Median ETPAUC during CVVH, was higher in group 1, while postfilter ETPAUC values were not significantly
different (Table 2). Ranges were large. ETP activity was not detected in ultrafiltrate.
In patients of group 1, median values of F1+2 and TAT were (or tended to be) higher in group 1 than in group 2. Arterial D-dimers were higher in group 1, while postfilter D-D-dimers were not significantly different between groups (Table 2).
Differences remained after correction for different degrees of hemoconcentration in postfilter blood (0.70 at 4 L/h and 0.78 at 2 L/h).
Anti-Xa and ETP activity in all patients
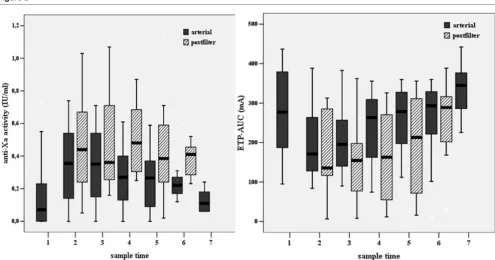
Arterial anti-Xa activity peaked upon the administration of the intravenous bolus of nadroparin, followed by a gradual decline during the course of CVVH (P = 0.05). Postfilter anti-Xa did not significantly change in time. Postfilter anti-Xa activity was significantly higher than arterial anti-Xa with a median ratio of 1.7 (IQR 1.4 to 2.1; Figure 2).
The course of arterial ETPAUC was opposite to anti-Xa activity with lowest value after the nadroparin bolus. During CVVH, arterial ETPAUC tended to increase again (P = 0.06), whereas
postfilter ETPAUC significantly increased in time (P = 0.001).
Postfilter ETPAUC was significantly lower than arterial ETPAUC (Figure 2).
Medians of postfilter F1+2, TAT and D-dimers were signifi-cantly higher than arterial values. Postfilter ranges were high.
Relation between ETP, anti-Xa, other markers of coagulation and severity of organ failure
Median baseline arterial ETPAUC was 277 mA (IQR 175 to 385). Baseline ETPAUC correlated inversely to PTT (R = -0.80,
P = 0.001), aPTT (R = -0.69, P = 0.006), TAT (R = -0.69, P = 0.06) and SOFA score (R = -0.70, P = 0.001), but not to anti-Xa, F1+2 and D-dimers. During CVVH and nadroparin infusion, arterial ETPAUC correlated inversely to aPTT at all sample times (R = -0.60 to -0.82, P = 0.03 to 0.001) and to PTT at t2 and t4 (R = -0.77, P = 0.001 and R = -0.64, P = 0.01, respectively); postfilter ETPAUC did not correlate with aPTT except at t5 (R = -0.65, P = 0.02), and not with PTT, anti-Xa, F1+2, TAT and D-dimers.
[image:5.612.61.548.92.343.2]Arterial anti-Xa at t1 and t2 (one hour after the nadroparin bolus) correlated with antithrombin (R = 0.54, P = 0.048 and R = 0.48, P = 0.08). Anti-Xa activity was not related to body weight. There was a positive correlation between arterial anti-thrombin and ETPCmax at t1 and t2 (R = 57, P = 0.03 and R = Figure 1
Arterial and postfilter anti-Xa activity and ETPAUC are presented for the two randomized groups
0.79, P = 0.001) and ETPAUC at t1 and t2 (R = 0.46, P = 0.10 and R = 0.41, P = 0.14). ETP and anti-Xa correlated negatively if all samples were taken together (R = -0.36, P = 0.001).
Relation between markers of coagulation, severity of organ failure and circuit life
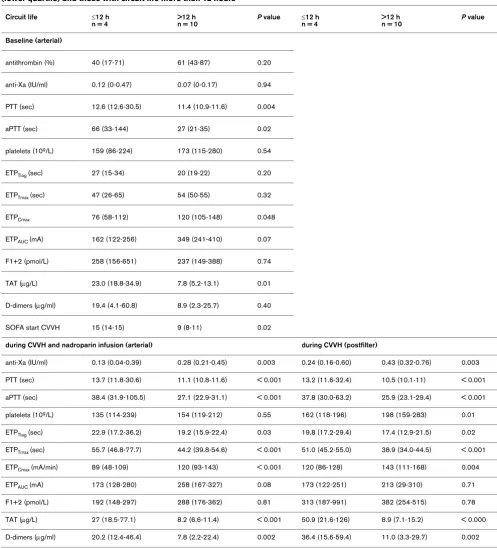
Median circuit life was 24.5 hours (IQR 12 to 37 hours). Short circuit life was defined as 12 hours of less (the lower quartile). At baseline, patients with short circuit life had a longer PTT, aPTT, higher TAT and lower ETP. They also had higher SOFA scores (Table 3). During CVVH and nadroparin infusion, anti-Xa and platelets were significantly lower in patients with short circuit life, PTT, aPTT, TAT and D-dimers were significantly longer or higher and ETP was slower and depressed (Table 3).
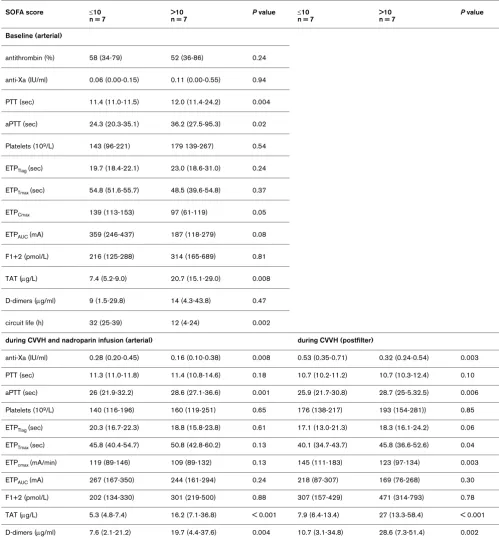
Median SOFA score was 10. Patients with high SOFA score (>10) had longer PTT, aPTT, a depressed ETP, high TAT and D-dimers and a significantly shorter circuit life. During CVVH anti-Xa was lower and postfilter ETP was slow and depressed (Table 4).
Discussion
This randomized cross-over study in critically ill patients with AKI compared the hemostasis during anticoagulation with the LMWH nadroparin between two doses of CVVH using a cel-lulose tri-acetate filter. We found no signs of accumulation of anticoagulant activity in arterial blood and no signs of removal
by filtration. Anticoagulant activity was quantified by anti-Xa activity. In arterial blood, anti-Xa levels peaked upon the intra-venous nadroparin bolus and gradually declined thereafter despite the continuous infusion of the LMWH in the circuit, while postfilter anti-Xa activity remained constant. Anti-Xa activity was not detected in the ultrafiltrate.
[image:6.612.61.555.120.369.2]It should be noted that we did not measure nadroparin con-centration but its anticoagulant activity. If hemofiltration would remove the drug we would expect higher drug concentrations in group 1 with the lower CVVH, and assuming a linear relation between dose and effect, also a higher anti-Xa activity. The opposite was the case. Differences in anti-Xa activity between groups can therefore not be explained by a different handling of nadroparin by filtration. Another explanation is needed. Although the present study is of limited duration, a longer dura-tion will likely not confer different results, because plasma anti-Xa activity did not tend to increase, it declined. Given the ana-lytical precision of our test, relevant accumulation in plasma if present would have been detected. Corresponding to our find-ings, Joannidis and colleagues [13] found no accumulation of anti-Xa activity using the LMWH enoxaparin. The absence of removal of anticoagulant activity by filtration corresponds with a previous study [4], but not with a recent study [5]. The latter used a different LMWH (enoxaparin) and different membranes (polysulphone and acrylonitrile). LMWH are derived from unfractionated heparin by diverse ways of depolymerization, Table 2
Comparison of markers of coagulation during CVVH in arterial and postfilter blood between randomized groups
during CVVH and nadroparin infusion (arterial) during CVVH (postfilter)
Group 1 4 to 2 L/h
Group 2 2 to 4 L/h
P value Group 1 4 to 2 L/h
Group 2 2 to 4 L/h
P value
anti-Xa (IU/ml) 0.19 (0.12-0.37) 0.31 (0.23-0.52) 0.02 0.34 (0.25-0.44) 0.51 (0.41-0.76) 0.005
PTT (sec) 11.1 (10.8-12.6) 11.5 (11.1-12.8) 0.30 10.7 (10.2-12.0) 11.1 (10.4-11.8) 0.80
aPTT (sec) 28.0 (25.4-33.3) 29.3 (22.1-40.5) 0.95 27.0 (24.5-30.7) 28.3 (22.2-35.2) 0.80
platelets (109/l) 164 (131-242) 129 (114-210) 0.05 200 (161-276) 172 (140-274) 0.23
ETPTlag (sec) 18.5 (16.7-23.6) 20.9 (15.1-23.2) 0.84 18.1 (15.5-23.4) 17.8 (12.9-22.3) 0.30
ETPTmax (sec) 47.2 (41.5-56.6) 45.8 (40.9-55.0) 0.93 43.9 (34.8-52.0) 40.1 (35.0-43.8) 0.19
ETPCmax (mA/min) 113 (96-141) 115 (83-134) 0.25 127 (100-149) 143 (99-166) 0.21
ETPAUC (mA) 280 (175-338) 209 (109-209) 0.03 212 (99-309) 189 (38-289) 0.45
F1+2 (pmol/L) 298 (198-482) 228 (159-332) 0.06 456 (306-787) 320 (188-455) 0.008
TAT (μg/L) 9.3 (6.7-23) 5.5 (4.8-9.6) 0.001 20 (9.2-53.8) 8.3 (6.2-17.6) 0.001
D-dimers (μg/ml) 11.1 (7.8-29.5) 3.8 (2.0-24.8) 0.03 17.8 (11.0-43.2) 5.7 (3.1-41.8) 0.14
Values are medians (interquartile range) of all samples. Postfilter values are actual values, not corrected for hemoconcentration
resulting in different mixtures with different molecular struc-tures and feastruc-tures. Furthermore, Isla and colleagues [5] used membranes with a higher negative charge than the cellulose triacetate membrane used in our study [14]. Moreover, the sensitivity of our anti-Xa assay is sufficient to demonstrate rel-evant anti-Xa removal if present. Discrepancies between stud-ies may therefore be related to the use of different types of LMWH and different membranes. Finally, nadroparin might also be removed by adsorption to the membrane. However, membranes are generally saturated after a couple of hours and accumulation would be expected thereafter. In addition, the present cellulose tri-acetate membrane has low adsorptive capacity. The absence of accumulation and removal, and the finding that the 2 L/h dose was not associated with higher anti-Xa activity indicates that nadroparin is cleared or inactivated in the body of these critically ill patients despite renal failure. This finding is striking because previous studies and a recent meta-analysis showed that renal insufficiency increases half-life of smaller heparin fragments causing accumulation of anti-Xa activity when glomerular filtration rate falls below 30 ml/min [2,3]. This seeming contradiction may be explained by other findings of this study.
Although arterial anti-Xa activity tended to decrease in time, postfilter anti-Xa activity was stable. Median postfilter anti-Xa activity was 1.7 times the arterial anti-Xa activity due to the extracorporeal administration of the LMWH. This finding cor-responds to the results of Joannidis and colleagues [13]. It therefore seems rational to administer the LMWH in the
extra-corporeal circuit, especially because longer circuit life was associated with higher anti-Xa activities. However, other fac-tors than nadroparin dose seem to influence anti-Xa activity and circuit life as well.
[image:7.612.59.554.91.351.2]First, anti-Xa activity varied widely between patients. In addi-tion, after correction for a difference in hemoconcentraaddi-tion, postfilter anti-Xa activity was higher in group 2 while nadroparin dose/blood flow ratio was lower. This discrepancy needs to be explained. Heparins mainly confer their anticoag-ulant effect by potentiating antithrombin, which primarily inhib-its factor IIa and Xa. Heparin resistance may be due to low antithrombin concentrations. Supplementation of antithrombin to patients with low plasma concentrations does increase cir-cuit life [15,16]. In our patients, baseline antithrombin corre-lated with anti-Xa activity. However, antithrombin was not lower in group 1, which had the lower Xa activity, and anti-thrombin was not significantly lower in the patients with early filter clotting. Differences in anti-Xa activity between patients and groups may also be explained by the binding of heparin to proteins other than antithrombin, limiting the amount of heparin available to bind to antithrombin and thus decreasing the anti-coagulant effect [17]. This heparin resistance was related to severity of disease: patients with high SOFA scores had lower anti-Xa activity. So called heparin-binding proteins are released from storage sites in endothelial cells [18]. Among these are acute-phase reactants such as platelet factor 4, his-tidine-rich glycoprotein, vitronectin, fibronectin and lipopoly-saccharide-binding protein, which increase in sepsis [19,20]. Figure 2
Arterial and postfilter anti-Xa activity and ETPAUC for all patients
Table 3
Comparison of baseline markers of coagulation and severity of organ failure between patients with circuit life of 12 hours or less (lower quartile) and those with circuit life more than 12 hours
Circuit life ≤12 h
n = 4
>12 h n = 10
P value ≤12 h n = 4
>12 h n = 10
P value
Baseline (arterial)
antithrombin (%) 40 (17-71) 61 (43-87) 0.20
anti-Xa (IU/ml) 0.12 (0-0.47) 0.07 (0-0.17) 0.94
PTT (sec) 12.6 (12.6-30.5) 11.4 (10.9-11.6) 0.004
aPTT (sec) 66 (33-144) 27 (21-35) 0.02
platelets (109/L) 159 (86-224) 173 (115-280) 0.54
ETPTlag (sec) 27 (15-34) 20 (19-22) 0.20
ETPTmax (sec) 47 (26-65) 54 (50-55) 0.32
ETPCmax 76 (58-112) 120 (105-148) 0.048
ETPAUC (mA) 162 (122-256) 349 (241-410) 0.07
F1+2 (pmol/L) 258 (156-651) 237 (149-388) 0.74
TAT (μg/L) 23.0 (18.8-34.9) 7.8 (5.2-13.1) 0.01
D-dimers (μg/ml) 19.4 (4.1-60.8) 8.9 (2.3-25.7) 0.40
SOFA start CVVH 15 (14-15) 9 (8-11) 0.02
during CVVH and nadroparin infusion (arterial) during CVVH (postfilter)
anti-Xa (IU/ml) 0.13 (0.04-0.39) 0.28 (0.21-0.45) 0.003 0.24 (0.16-0.60) 0.43 (0.32-0.76) 0.003
PTT (sec) 13.7 (11.8-30.6) 11.1 (10.8-11.6) < 0.001 13.2 (11.6-32.4) 10.5 (10.1-11) < 0.001
aPTT (sec) 38.4 (31.9-105.5) 27.1 (22.9-31.1) < 0.001 37.8 (30.0-63.2) 25.9 (23.1-29.4) < 0.001
platelets (109/L) 135 (114-239) 154 (119-212) 0.55 162 (118-196) 198 (159-283) 0.01
ETPTlag (sec) 22.9 (17.2-36.2) 19.2 (15.9-22.4) 0.03 19.8 (17.2-29.4) 17.4 (12.9-21.5) 0.02
ETPTmax (sec) 55.7 (46.8-77.7) 44.2 (39.8-54.6) < 0.001 51.0 (45.2-55.0) 38.9 (34.0-44.5) < 0.001
ETPCmax (mA/min) 89 (48-109) 120 (93-143) < 0.001 120 (86-128) 143 (111-168) 0.004
ETPAUC (mA) 173 (128-280) 258 (167-327) 0.08 173 (122-251) 213 (29-310) 0.71
F1+2 (pmol/L) 192 (148-297) 288 (176-362) 0.81 313 (187-991) 382 (254-515) 0.78
TAT (μg/L) 27 (18.5-77.1) 8.2 (6.6-11.4) < 0.001 50.9 (21.6-126) 8.9 (7.1-15.2) < 0.000 D-dimers (μg/ml) 20.2 (12.4-46.4) 7.8 (2.2-22.4) 0.002 36.4 (15.6-59.4) 11.0 (3.3-29.7) 0.002 Values in median (interquartile range). Values during CVVH are medians of all samples. Postfilter values are actual values, not corrected for hemoconcentration. aPTT = activated thromboplastin time; CVVH = continuous venovenous hemofiltration; ETP = endogenous thrombin potential; ETPAUC = area under the curve of the thrombin generation curve; ETPCmax = maximal activity of ETP; ETPTlag = ETP lag time = ETPTmax = time to max ETP activity; F1+2 = prothrombin fragment; PTT = prothrombin time; SOFA = Sequential Organ Failure Assessment; TAT = thrombin-antithrombin complexes.
Furthermore, heparin avidly binds to apoptotic and necrotic cells to discrete domains released from the nucleus into the membrane during apoptosis [21]. Apoptosis is a key mecha-nism in sepsis-related multi-organ failure [22]. Altogether, our
Table 4
Comparison of baseline markers of coagulation and circuit life between patients with SOFA score of 10 or less (median) and those with SOFA score of more than 10
SOFA score ≤10
n = 7
>10 n = 7
P value ≤10 n = 7
>10 n = 7
P value
Baseline (arterial)
antithrombin (%) 58 (34-79) 52 (36-86) 0.24
anti-Xa (IU/ml) 0.06 (0.00-0.15) 0.11 (0.00-0.55) 0.94
PTT (sec) 11.4 (11.0-11.5) 12.0 (11.4-24.2) 0.004
aPTT (sec) 24.3 (20.3-35.1) 36.2 (27.5-95.3) 0.02
Platelets (109/L) 143 (96-221) 179 139-267) 0.54
ETPTlag (sec) 19.7 (18.4-22.1) 23.0 (18.6-31.0) 0.24
ETPTmax (sec) 54.8 (51.6-55.7) 48.5 (39.6-54.8) 0.37
ETPCmax 139 (113-153) 97 (61-119) 0.05
ETPAUC (mA) 359 (246-437) 187 (118-279) 0.08
F1+2 (pmol/L) 216 (125-288) 314 (165-689) 0.81
TAT (μg/L) 7.4 (5.2-9.0) 20.7 (15.1-29.0) 0.008
D-dimers (μg/ml) 9 (1.5-29.8) 14 (4.3-43.8) 0.47
circuit life (h) 32 (25-39) 12 (4-24) 0.002
during CVVH and nadroparin infusion (arterial) during CVVH (postfilter)
anti-Xa (IU/ml) 0.28 (0.20-0.45) 0.16 (0.10-0.38) 0.008 0.53 (0.35-0.71) 0.32 (0.24-0.54) 0.003
PTT (sec) 11.3 (11.0-11.8) 11.4 (10.8-14.6) 0.18 10.7 (10.2-11.2) 10.7 (10.3-12.4) 0.10
aPTT (sec) 26 (21.9-32.2) 28.6 (27.1-36.6) 0.001 25.9 (21.7-30.8) 28.7 (25-5.32.5) 0.006
Platelets (109/L) 140 (116-196) 160 (119-251) 0.65 176 (138-217) 193 (154-281)) 0.85
ETPTlag (sec) 20.3 (16.7-22.3) 18.8 (15.8-23.8) 0.61 17.1 (13.0-21.3) 18.3 (16.1-24.2) 0.06
ETPTmax (sec) 45.8 (40.4-54.7) 50.8 (42.8-60.2) 0.13 40.1 (34.7-43.7) 45.8 (36.6-52.6) 0.04
ETPcmax (mA/min) 119 (89-146) 109 (89-132) 0.13 145 (111-183) 123 (97-134) 0.003
ETPAUC (mA) 267 (167-350) 244 (161-294) 0.24 218 (87-307) 169 (76-268) 0.30
F1+2 (pmol/L) 202 (134-330) 301 (219-500) 0.88 307 (157-429) 471 (314-793) 0.78
TAT (μg/L) 5.3 (4.8-7.4) 16.2 (7.1-36.8) < 0.001 7.9 (6.4-13.4) 27 (13.3-58.4) < 0.001 D-dimers (μg/ml) 7.6 (2.1-21.2) 19.7 (4.4-37.6) 0.004 10.7 (3.1-34.8) 28.6 (7.3-51.4) 0.002 Values in median (interquartile range). Values during CVVH are medians of all samples. Postfilter values are actual values, not corrected for hemoconcentration. aPTT = activated thromboplastin time; CVVH = continuous venovenous hemofiltration; ETP = endogenous thrombin potential; ETPAUC = area under the curve of the thrombin generation curve; ETPCmax = maximal activity of ETP; ETPTlag = ETP lag time = ETPTmax = time to max ETP activity; F1+2 = prothrombin fragment; PTT = prothrombin time; SOFA = Sequential Organ Failure Assessment; TAT = thrombin-antithrombin complexes.
Some experiments demonstrate that LMWH binds less to plasma proteins than unfractionated heparin [19]. However, clinical studies report lower anti-Xa activity in response to LMWH in patients with deep vein thrombosis compared with
vasopres-sors [26]. The lower anti-Xa response in the above mentioned patients groups may be caused by non-specific binding of the LMWH to acute-phase proteins. Although our study is small, results are in accordance with those mentioned above. It sug-gests that the anticoagulant effects of LMWHs are inhibited in severely ill patients leading to anticoagulant failure, which goes undetected without anti-Xa monitoring. To optimize LMWH anticoagulation, monitoring of anti-Xa is therefore advocated in patients with high SOFA scores exhibiting early filter clotting.
We also aimed to explore whether ETP could have a role in monitoring systemic anticoagulation and circuit clotting. We found low baseline ETP compared with healthy volunteers. The pattern of ETP in arterial blood was opposite to anti-Xa activity with a strongly significant but weak correlation, likely reflecting LMWH anticoagulation. Postfilter ETP was lower than in arterial blood reflecting the extracorporeal administra-tion of nadroparin. However, although postfilter anti-Xa activity was stable during CVVH, postfilter ETP increased in time. This indicates that ETP is not simply a marker of LMWH anticoag-ulation. Apparently, the capacity to generate thrombin gradu-ally increased in postfilter blood despite 'adequate' anticoagulation. Increasing ETP in the hemoconcentrated blood leaving the filter likely reflects circuit-induced hyperco-agulability due to a time dependent increase in procoagulant activity despite constant LMWH anticoagulant activity. This corresponds to the literature reporting that ETP is increased in various hypercoagulable states [6,27]. APTT and PTT reflect circulating coagulation factor concentrations, but do not reflect or predict an activated state of these factors or the abil-ity to generate activated factors. ETP, by measuring plasma thrombin generation in time far beyond clot formation, is thought to fill that information gap. Finally, arterial ETP was inversely related to PTT, aPTT, TAT and SOFA score, suggest-ing that low ETP reflects consumption of coagulation factors due to increased thrombin generation as a result of critical ill-ness. This assumption is supported by a clinical study report-ing that ETP was lower in patients with overt disseminated intravascular coagulation [28] and by our observation that baseline ETP was lower in patients with early circuit clotting. Increasing postfilter ETP in time and lowered arterial ETP val-ues with high TAT complexes may be two sides of the same coin, i.e. activation of coagulation factors in the extracorporeal circuit, causing a running coagulation cascade in the patient with net consumption of coagulation factors during increased thrombin formation. Altogether, our study confirms that ETP reflects interplay of the effects of low concentrations of coag-ulation factors due to consumption and heparin anticoagula-tion, both decreasing the capacity to form thrombin, and of extracorporeal hypercoagulability, which increases this capac-ity. Further studies are needed to determine which soluble fac-tors cause this increased extracorporeal thrombin-generating capacity.
The present study further shows the complex relation between coagulation, anticoagulation, fibrinolysis, severity of disease and circuit clotting. Patients with early circuit clotting had longer PTT, aPTT and lower ETP. These prolonged coagula-tion times did not, however, protect against filter clotting. They were associated with early filter clotting indicating consump-tive coagulopathy. Indeed, higher TAT complexes and D-dim-ers were also found, signaling higher prior thrombin generation. Most importantly, patients with early circuit clotting had higher SOFA scores. Short circuit life and high SOFA scores were additionally associated with lower levels of anti-Xa, despite a similar LMWH dose. Therefore, early circuit clot-ting in patients with high SOFA scores seems to be related to prior activation of coagulation with consumptive coagulopathy, heparin resistance and high extracorporeal thrombin genera-tion.
Although our study is small and the results need to be con-firmed, the finding of early filter clotting and heparin resistance in patients with severe organ failure corresponds to clinical experience and has a biochemical explanation. The finding suggests that heparins are not ideal for circuit anticoagulation in the most severely ill patients. In these patients regional anti-coagulation with citrate may be preferred. In our recent rand-omized controlled trial in critically ill patients with acute renal failure comparing anticoagulation for CVVH with citrate to nadroparin anticoagulation, patient survival was better in those receiving citrate [29]. This difference was present in the entire group, but especially in the subgroups of patients with sepsis and higher SOFA score. Heparin resistance may be a second reason for not using heparins in the most severely ill patients.
Conclusions
The present explorative randomized cross-over trial comparing hemostasis during anticoagulation with the LMWH nadroparin between two doses of CVVH showed no accumulation of anti-coagulant activity and no signs of removal by filtration. How-ever, the study suggests inactivation of the LMWH in patients with severe organ failure. Severe organ failure appeared as a major determinant of early circuit clotting due to prior systemic thrombin generation with consumptive coagulopathy, heparin resistance and elevated extracorporeal thrombin generation. In this setting the interpretation of ETP is complex, because it integrates the effects of low concentrations of coagulation fac-tors due to prior thrombin generation and heparin anticoagula-tion, both decreasing the capacity to form thrombin, and extracorporeal activation of coagulation factors, which increases this capacity. Further studies are needed to define the role of ETP in monitoring circuit clotting.
Competing interests
Authors' contributions
HMO was involved in the concept and design of the study, in the analysis and interpretation of the data, and in the drafting and writing of the manuscript. MvS contributed to the bio-chemical measurements and the biobio-chemical part of the data-base, the interpretation of the data and the writing of the manuscript. PJM performed the biochemical measurements and contributed to the interpretation of the data. JPJW contrib-uted to the design of the study, the interpretation of the data and to the writing of the manuscript. AL contributed to the design of the study, in particular of the biochemical measure-ments, the interpretation of the data and the writing of the man-uscript. All authors read and approved the final manman-uscript.
Acknowledgements
We are grateful to Matty Koopmans (research nurse) for her efforts to collect the clinical data and the creation of the database.
References
1. Hirsh J, Warkentin TE, Shaughnessy SG, Anand SS, Halperin JL, Raschke R, Granger C, Ohman EM, Dalen JE: Heparin and low-molecular-weight heparin: mechanisms of action, pharmacok-inetics, dosing, monitoring, efficacy, and safety. Chest 2001, 119:64S-94S.
2. Mismetti P, Laporte-Simitsidis S, Navarro C, Sie P, d'Azemar P, Necciari J, Duret JP, Gaud C, Decousus H, Boneu B: Aging and venous thromboembolism influence the pharmacodynamics of the anti-factor Xa and anti-thrombin activities of a low molecular weight heparin (nadroparin). Thromb Haemost 1998, 79:1162-1165.
3. Lim W, Dentali F, Eikelboom JW, Crowther MA: Meta-analysis: low-molecular-weight heparin and bleeding in patients with severe renal insufficiency. Ann Intern Med 2006, 144:673-684. 4. Singer M, McNally T, Screaton G, Mackie I, Machin S, Cohen SL: Heparin clearance during continuous veno-venous haemofil-tration. Intensive Care Med 1994, 20:212-215.
5. Isla A, Gascon AR, Maynar J, Arzuaga A, Corral E, Martin A, Solinis MA, Munoz JL: In vitro and in vivo evaluation of enoxaparin removal by continuous renal replacement therapies with acry-lonitrile and polysulfone membranes. Clin Ther 2005, 27:1444-1451.
6. Hemker HC, Al Dieri R, De Smedt E, Beguin S: Thrombin gener-ation, a function test of the haemostatic-thrombotic system. Thromb Haemost 2006, 96:553-561.
7. Nationale Intensive Care Evaluatie [http://www.stichting-nice.nl]
8. Knaus WA, Draper EA, Wagner DP, Zimmerman JE: APACHE II: a severity of disease classification system. Crit Care Med 1985, 13:818-829.
9. Knaus WA, Wagner DP, Draper EA, Zimmerman JE, Bergner M, Bastos PG, Sirio CA, Murphy DJ, Lotring T, Damiano A: The APACHE III prognostic system. Risk prediction of hospital mortality for critically ill hospitalized adults. Chest 1991, 100:1619-1636.
10. Le Gall JR, Lemeshow S, Saulnier F: A new Simplified Acute Physiology Score (SAPS II) based on a European/North Amer-ican multicenter study. JAMA 1993, 270:2957-2963.
11. Vincent JL, Moreno R, Takala J, Willatts S, de Mendonca A, Bruin-ing H, Reinhart CK, Suter PM, Thijs LG: The SOFA (Sepsis-related Organ Failure Assessment) score to describe organ dysfunction/failure. On behalf of the Working Group on Sep-sis-Related Problems of the European Society of Intensive Care Medicine. Intensive Care Med 1996, 22:707-710. 12. Bellomo R, Ronco C, Kellum JA, Mehta RL, Palevsky P: Acute
renal failure - definition, outcome measures, animal models, fluid therapy and information technology needs: the Second International Consensus Conference of the Acute Dialysis Quality Initiative (ADQI) Group. Crit Care 2004, 8:R204-R212. 13. Joannidis M, Kountchev J, Rauchenzauner M, Schusterschitz N, Ulmer H, Mayr A, Bellmann R: Enoxaparin vs. unfractionated heparin for anticoagulation during continuous veno-venous hemofiltration: a randomized controlled crossover study. Intensive Care Med 2007, 33:1571-1579.
14. Chanard J, Lavaud S, Randoux C, Rieu P: New insights in dialysis membrane biocompatibility: relevance of adsorption proper-ties and heparin binding. Nephrol Dial Transplant 2003, 18:252-257.
15. Cheyron du D, Bouchet B, Bruel C, Daubin C, Ramakers M, Char-bonneau P: Antithrombin supplementation for anticoagulation during continuous hemofiltration in critically ill patients with septic shock: a case-control study. Crit Care 2006, 10:R45. 16. Lafargue M, Joannes-Boyau O, Honore PM, Gauche B, Grand H,
Fleureau C, Roze H, Janvier G: Acquired deficit of antithrombin and role of supplementation in septic patients during continu-ous veno-vencontinu-ous hemofiltration. ASAIO J 2008, 54:124-128. 17. Manson L, Weitz JI, Podor TJ, Hirsh J, Young E: The variable
anti-coagulant response to unfractionated heparin in vivo reflects binding to plasma proteins rather than clearance. J Lab Clin Med 1997, 130:649-655.
18. Liu S, Hoke D, Julian J, Carson DD: Heparin/heparan sulfate (HP/HS) interacting protein (HIP) supports cell attachment and selective, high affinity binding of HP/HS. J Biol Chem 1997, 272:25856-25862.
19. Young E, Podor TJ, Venner T, Hirsh J: Induction of the acute-phase reaction increases heparin-binding proteins in plasma. Arterioscler Thromb Vasc Biol 1997, 17:1568-1574.
20. Hochart H, Jenkins PV, Preston RJ, Smith OP, White B, O'Donnell J: Concentration-dependent roles for heparin in modifying lipopolysaccharide-induced activation of mononuclear cells in whole blood. Thromb Haemost 2008, 99:570-575.
21. Gebska MA, Titley I, Paterson HF, Morilla RM, Davies DC, Gruszka-Westwood AM, Kakkar VV, Eccles S, Scully MF: High-affinity binding sites for heparin generated on leukocytes dur-ing apoptosis arise from nuclear structures segregated durdur-ing cell death. Blood 2002, 99:2221-2227.
22. Sriskandan S, Altmann DM: The immunology of sepsis. J Pathol 2008, 214:211-223.
23. Rommers MK, Van der LN, Egberts TC, Bemt PM van den: Anti-Xa activity after subcutaneous administration of dalteparin in ICU patients with and without subcutaneous oedema: a pilot study. Crit Care 2006, 10:R93.
24. Mayr AJ, Dunser M, Jochberger S, Fries D, Klingler A, Joannidis M, Hasibeder W, Schobersberger W: Antifactor Xa activity in inten-sive care patients receiving thromboembolic prophylaxis with standard doses of enoxaparin. Thromb Res 2002, 105:201-204.
25. Priglinger U, Delle KG, Geppert A, Joukhadar C, Graf S, Berger R, Hulsmann M, Spitzauer S, Pabinger I, Heinz G: Prophylactic anti-coagulation with enoxaparin: Is the subcutaneous route appropriate in the critically ill? Crit Care Med 2003, 31:1405-1409.
26. Dorffler-Melly J, de Jonge E, Pont AC, Meijers J, Vroom MB, Buller HR, Levi M: Bioavailability of subcutaneous
low-molecular-Key messages
• Anticoagulant activity of the LMWH nadroparin does not accumulate in patients with AKI receiving CVVH.
• The LMWH nadroparin is not removed by CVVH using a cellulose tri-acetate filter.
• LMWH seems to be inactivated in patients with severe organ failure.
• Severe organ failure seems a major determinant of early circuit clotting due to consumptive coagulopathy, heparin resistance and increased thrombin generation.
weight heparin to patients on vasopressors. Lancet 2002, 359:849-850.
27. Lincz LF, Lonergan A, Scorgie FE, Rowlings P, Gibson R, Lawrie A, Seldon M: Endogenous thrombin potential for predicting risk of venous thromboembolism in carriers of factor V Leiden. Pathophysiol Haemost Thromb 2006, 35:435-439.
28. Seo JW, Kim HK, Kim JE, Park S, Cho HI: Prognostic values of the factor Xa-activated clotting time and endogenous thrombin potential in patients suspected of having dissemi-nated intravascular coagulation. Thromb Res 2009, 123:565-572.