International Journal of Emerging Technology and Advanced Engineering
Website: www.ijetae.com (
ISSN 2250-2459,
ISO 9001:2008 Certified Journal,
Volume 3, Issue 4, April 2013)
Grid Resource Brokering for High Performance Parallel
Applications
Aditya B. Patel
1, Pratik Thanawala
2, Dr. J G Pandya
31Asst. Professor, 2Lecturer, AES Institute of Computer Studies, Ahmedabad University, Ahmedabad 3Department of Science and Technology, Government of Gujarat, Gandhinagar
Abstract— Compute grid is hardware and software infrastructure providing dependable and consistent computing power. This platform is suitable for running high performance parallel applications which can efficiently use parallel processors of heterogeneous resources in the grid. In order to achieve this, the grid middleware should have a meta-scheduler called grid resource broker for optimized utilization of different resources available in the grid. This paper proposes grid resource broker for parallel applications that uses scheduling strategies and an integrated resource brokering approach for efficient and optimized execution of parallel applications in grid environment. To improve performance of compute-intensive parallel applications on grid system, the application must be scheduled in optimum manner. To obtain the best performance, both grid system and application-specific information can be considered in developing a schedule that meets the desired Quality of Service (QoS) requirements. Grid Resource broker takes the scheduling decision and uses local schedulers of different local resources to allocate jobs to distributed resources. The proposed QoS scheduling algorithm for parallel application considers application as compound task and uses a combination of task-flow and application-level scheduling within virtual organization of Grid. We have implemented grid resource broker in our grid test bed to solve parallel application problems of Histogram calculation and Monte Carlo Simulation and have obtained favorable experiment results.
Keywords— Compute Grid, Grid Resource Brokering, High Performance Application, Parallel Computing, QoS Oriented Scheduling
I. INTRODUCTION
Super computers have been widely used to execute high performance computing applications. The emergence of distributed computing has made it possible to provide the high compute capacity by using commodity computers in form of compute grid. Compute Grids are very suitable for efficient execution of compute and data intensive application. Resource brokering and scheduling is an important component of grid systems.
Grid resource brokering involves converting application
requirements into resource requirement, resource
discovery, job submission, resource matchmaking with
application requirements, resource negotiation and
[image:1.612.330.559.419.543.2]allocation based on QoS requirement, scheduling and co-allocation, resource monitoring, resource reservation capability and performance prediction capability. Scientific applications have workflow structure and can be executing efficiently by parallel execution of various jobs to take advantage of compute nodes available in the grid, especially in the case when there is no or a very limited exchange of data among the jobs. From an initial job, a number of jobs are launched to execute on pre-selected or dynamically assigned nodes of the grid based on grid resource brokering algorithm.
Figure 1: Structure of parallel applications
International Journal of Emerging Technology and Advanced Engineering
Website: www.ijetae.com (
ISSN 2250-2459,
ISO 9001:2008 Certified Journal,
Volume 3, Issue 4, April 2013)
In this paper, we have explored the grid platform for efficient execution of high performance parallel application scenarios.
II. STUDY OF RELATED WORK
Widely used scheduling strategy in grid computing is based on policy and set of rules for resource use and assignment of task or job to a specific node depending on load balance and need of resource [1]. Various task and application scheduling approaches for grid have been published in the literature [2]. Various performance modeling strategies for predicting execution times of parallel applications has been proposed in [3]. Economic based scheduling heuristic for utility grids has been proposed in [4], which has been validated using GridSim simulator. The above approaches do not consider the inherent nature of parallel application in efficient scheduling of high performance scientific parallel applications. Buyya et. al. [5] has proposed cost-time optimization algorithm and Abramason et. al. [6] has proposed Nimrod/G. These systems are useful for scheduling parameter sweep parallel applications with deadlines and cost constraints. They do not consider users’ different QOS requirements and their deadline constraints.
III. SCHEDULING PARALLEL APPLICATIONS
The goal of grid scheduling is to match the application needs with the available grid resources with desired attributes to fulfill user QoS constraints. There are three main phases of scheduling an application on grid [4]:
1. Phase one is resource discovery, which generates a list of potential resources.
2. Phase two involves gathering information about those resources and choosing the best set to match the application requirements.
3. In phase three, the job is executed, which includes file staging and input output.
4. Monitoring Grid resources over time for efficient execution of jobs.
Scheduling QoS oriented parallel application requires below additional considerations [4]:
Division of application into multiple sub-jobs (processes)
A parallel compute intensive application needs to be executed in form of multiple sub jobs (processes) on different processors of compute nodes. Different processes needs to be assigned to processor of different nodes to balance the load of grid system.
Dynamic load sharing is important system function designed to distribute workload among the available processors and to improve the overall performance [7].
Application and System-specific information
Schedules of grid applications are based on the knowledge of available resource and their capabilities, knowledge of the structure and QoS requirements of the application. The frequency of communication and computation, the amount of memory required, the number, type, and size of application data structures are matched with the granularity of the computational platforms, network speed and bandwidth, and other system attributes to develop a performance-efficient schedule.
Assigning process to machines according to their load
Depending on the machines and their current load i.e. whether machine is heavily or lightly loaded, the grid scheduler can use this information to schedule the jobs of parallel application. Machines with less load and higher resources can be assigned more processes (jobs) of the parallel application to optimize the scheduling.
Prediction of application and system performance
Prediction provides the basis for most types of scheduling decisions. The user predicts how their application will execute on the system and uses this prediction to choose a performance-efficient schedule. Such predictions are difficult to make accurately since the system varies over time due to contention, and application performance may be dependent on both data and system load.
Quality of Service (QoS) considerations
User specified QoS parameters can be: job resource requirements with associated quality levels, resource reservation, execution deadline and budget.
IV. SYSTEM ARCHITECTURE FOR GRID RESOURCE BROKERING
International Journal of Emerging Technology and Advanced Engineering
[image:3.612.52.280.148.426.2]Website: www.ijetae.com (
ISSN 2250-2459,
ISO 9001:2008 Certified Journal,
Volume 3, Issue 4, April 2013)
Figure 2: System Architecture for Grid Resource Brokering
V. QOSORIENTED GRID RESOURCE BROKERING ALGORITHM FOR PARALLEL APPLICATIONS
A parallel application is executed in form of multiple processes on different processors of compute nodes in the cluster and grid environment [9] [10]. The proposed algorithm shown in Figure 3 works on grid environment and assigns set of tasks in parallel application to distributed resources in the grid as per the QoS requirements and current status of resources in the grid.
Input: Parallel application with executable and no of
processes Steps:
Do until all Jobs in JobQueue are completed For each Job in JobQueue
Select the job with highest priority Retrieve the job QoS requirements and no of processes
Query MDS to retrieve the list of nodes with their resource status (CPU speed, main memory and processor load) and support for parallel application library
Perform matchmaking and assign the no. of parallel processes (task) to the hosts according to their CPU load
For each task i in Job
Schedule the task i of parallel application to the selected host Transfer the job executable to destination using Grid FTP protocol
Monitor the status of job execution
If (JobStatus = completed) Download the results to client node
Remove the job from JobQueue Else if (JobStatus = failed)
Reschedule the job end For
) end For end Do
Figure 3: Proposed Grid resource brokering algorithm
VI. PROTOTYPE AND EXPERIMENTAL SETUP
The grid test-bed consists of multiple linux and windows machines running Ubuntu linux 9.10 and window-XP systems connected with network. The multiple nodes with different configuration (CPU speed, architecture, Operating system, RAM) have been used to represent the heterogeneity in the grid. The Globus toolkitis used as grid middleware in the implementation. We have tested the proposed grid resource brokering algorithm on two parallel application problems of histogram and Monte Carlo simulation of PI.
International Journal of Emerging Technology and Advanced Engineering
Website: www.ijetae.com (
ISSN 2250-2459,
ISO 9001:2008 Certified Journal,
Volume 3, Issue 4, April 2013)
MPICH-G2 also selects the appropriate communication method (high-performance local interconnect, Internet protocol, etc.) depending on whether messages are being passed between local or remote systems.
Parallel Application Problem Scenario of Histogram For experiments and evaluation of parallel application on Grid resource broker, we have considered the parallel application scenario of histogram calculation having large range of numeric array elements of a parallel application to generate the histogram. The histogram application takes as input an array with maximum number of elements. Enter the number of processes to generate histogram for that array. Input number of histogram bins (index). Application will count the frequency of elements in a range to generate histogram. The output should generate a histogram of the block along with number of elements within the range of block. This problem can be solved very efficiently by parallelizing the histogram application on Grid. We apply the above Grid resource brokering algorithm for scheduling distributed histogram application and present experiment results. Depending upon maximum and minimum value of array element, main process computes the bin size as
Binsize = (max – min ) / no of bins
We parallelize the problem using a heterogeneous network of machines in grid. The master process (rank 0) accepts the size of array elements, number of histogram blocks and total number of processes. The same process fills the data (dynamic array) with the following function
Fill (Data, Size, Lo, Hi)
Typically the histogram computation is parallelized by partitioning the size of array elements into various segments and then assigning each segment to different processor.
Derive partition that optimizes the performance
Grid resource brokering algorithm will assign more segments of the histogram to processors such that the segment matches the performance capability of the processor to which it is assigned. Faster processors will compute more segments than slower ones. In particular, computational time is optimized when the ratio of each segment of the array to the total segments most closely matches the ratio of the power of the processor to which the segment is allocated to the total processing power available.
Depending upon number of processes, divide the number of array element among the number of processes to compute the histogram in parallel. The task performed by main process and various other process to be executed by different processor in parallel is as follows:
Main process: Divide the array elements into number of processes and distribute it on other processors including itself to compute bin and generate partial histogram. The main process receives the partial histogram computed by various processor and integrates the result.
Other processes: Read array element and compute bin using following equation
bin = 1 + (int) ( abs (a[i] – min ) / binsize)
If bin > number of bins then set bin to number of bins. Once bin is computed update the histogram for that bin as
Histogram[bin] += 1
VII. RESULTS AND EVALUATION
The grid resource broker algorithm is evaluated by executing the above parallel application on our grid testbed. We have performed the scheduling experiment by executing the parallel application on different grouping of nodes in the grid and its effect on the execution efficiency.
TABLEI
COMBINATIONOFGRIDNODESINDIFFERENTGROUPS
Group Nodes in Grid
G1 Node 1 Node 2
G2 Node 1 Node 2 Node 3
G3 Node 1 Node 2 Node 3 Node 4
G4 Node 1 Node 2 Node 3 Node 4 Node 5
TABLEII
EXECUTIONTIMEFORDIFFERENTGROUPS
Nodes (execution time in ms)
No. of
Processes G1 G2 G3 G4
10 253 237 213 185
20 230 210 190 166
30 215 195 173 159
40 219 205 179 169
International Journal of Emerging Technology and Advanced Engineering
Website: www.ijetae.com (
ISSN 2250-2459,
ISO 9001:2008 Certified Journal,
Volume 3, Issue 4, April 2013)
Improvement in execution time
0 50 100 150 200 250 300
G1 G2 G3 G4
Groups
P
ro
ce
ss
E
xe
cu
ti
o
n
ti
m
e(
m
s) Process = 10
Process = 20
Process = 30
Process = 40
[image:5.612.52.288.145.271.2]Process = 50
Figure 4: Improvement in Execution time of processes
The chart shows that for a given number of array elements when number of nodes in Grid increases the time initially decreases for given number of processes. But as number of processes increases the computational time taken by nodes also increases. The improvement in execution time is depicted in Figure 4.
Monte Carlo Simulation of PI using Parallel Processing on Grid
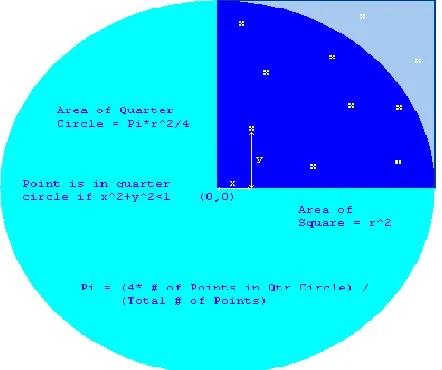
[image:5.612.60.281.519.704.2]Monte Carlo (MC) methods are stochastic techniques-meaning they are based on the use of random numbers and probability statistics to investigate problems [12]. Monte Carlo methods use statistical simulation using sequences of random numbers generation to perform the simulation. When performing this experiment, I realized that it takes a very large number of throws to get a decent value of pi, well over 1,000. So, we distribute the number of trials the user wants to attempt among all the available nodes in the grid.
Figure 5: Monte Carlo Simulation of PI
It should be apparent that of the total number of darts that hit within the square, the number of darts that hit the shaded part (circle quadrant) is proportional to the area of that part. In other words [13],
The simulation problem involves large amount of processing which can be parallelized on multiple nodes in the grid using Message passing interface (MPI). In the Parallel simulation of PI, We have divided the number of attempts to hit the dartboard (input by the user) evenly distributed among all the processors. The successful attempt from each processor is then consolidated to compute the value of PI. It takes as input the following simulation parameters:
Seed for the random number generator.
Number of attempts to hit the dartboard.
Number of processors available to execute the PI program.
x=(random#) y=(random#) dist=sqrt(x^2 + y^2)
if dist.from.origin (less.than.or.equal.to) 1.0 let hits=hits+1.0
The program keeps track of how many points it's picked so far (N) and how many of those points fell inside the circle (M). Pi is then approximated as follows:
N
M
PI
(
4
)
The parameters which we consider as variables in the different scheduling experiments are:
TABLEIII
INPUTPARAMETERSFORMONTECARLOSIMULATION
Parameter Meaning
Seed It’s a random number generator
Iteration No. of trials
Assigned Processors
No. of processors which we are assigning for calculation
[image:5.612.327.564.594.653.2]International Journal of Emerging Technology and Advanced Engineering
Website: www.ijetae.com (
ISSN 2250-2459,
ISO 9001:2008 Certified Journal,
Volume 3, Issue 4, April 2013)
TABLE IV
OUTPUT PARAMETERS FOR MONTE CARLO SIMULATION
Parameter Meaning
PI Estimated PI value which is calculated by
program
Deviation (Original PI – Estimated PI)
Difference between original PI value and program generated PI value
Time taken (in Milliseconds)
Time taken by the program processing
TABLE V
RESULTSOFEXPERIMENTTRIALSOFSIMULATIONV/S DEVIATIONINPICALCULATEDVALUE
Experiment Trials
Computed PI Value
Deviation Time Taken
(in ms)
1000 3.180000000 0.038407346 0.0203950
10000 3.142799999 0.001207346 0.0245678
100000 3.129000000 0.012592653 0.0300960
1000000 3.141863999 0.000271346 0.1531660
10000000 3.141016800 0.000575853 1.4606480
100000000 3.142152480 0.000559826 15.385494
0 0.01 0.02 0.03 0.04 0.05
1000 10000 100000 1000000 10000000 100000000
Dev
iatio
n
in PI
Calc
u
lated
Experiment Trials
Experiment Trials v/s Deviation in PI Calculated
Figure 6: Monte Carlo Simulation Result
The above simulation results indicate that increasing the number of trials to large value helps to get more accurate value of PI.
TABLEVI
EXPERIMENTS RESULTS -NUMBER OF PROCESSORS USED V/S TIME TAKEN (NO. OF ITERATIONS=1000)
Experiment-2(No. Of iteration=1000, Seed=10)
Available Processor
4 4 4 4
Assigned Processors
1 2 3 4
PI Estimated 3.128000 3.240000 0.132000 3.040000 Deviation
(Original PI – Estimated PI)
0.013593 0.098407 0.009593 0.101593
Time Taken (ms)
0.112799 0.115204 0.114051 0.111565
Number of processors used v/s time taken for Monte Carlo Simulation
0.108 0.11 0.112 0.114 0.116
1 2 3 4
No. of Processors Used
T
im
e
T
ak
en
(
m
s)
Assigned Processors
Figure 7: Number of processors v/s time taken (No of iterations=1000)
Above experiment results indicate that when we increase the number of processors, the calculation time is decreasing comparatively. We fix the iteration parameter as 1000 for the Monte Carlo PI approximation problem. Step by step, we are assigning more number of processors and the calculation time is decreased. Here, we obtain the least time when we assign the maximum number of 4 processors available for our experimental study.
VIII. CONCLUSION AND FUTURE WORK
[image:6.612.319.571.169.433.2] [image:6.612.43.297.314.619.2]International Journal of Emerging Technology and Advanced Engineering
Website: www.ijetae.com (
ISSN 2250-2459,
ISO 9001:2008 Certified Journal,
Volume 3, Issue 4, April 2013)
Our proposed QoS oriented grid resource broker for parallel application uses integrated approach for optimized scheduling of parallel applications in the compute grid. We have implemented the parallel application problems of histogram and Monte Carlo Simulation using the proposed grid resource broker for parallel applications and have obtained favorable experiment results. Future work will focus on service level agreements and performance modeling and evaluation of high performance computing parallel applications on cloud platforms like Amazon Elastic Compute Cloud (EC2).
REFERENCES
[1] Fran Berman, Rich Wolski, Application-level Scheduling on Distributed Heterogeneous Network, Proceedings of Super computing, 1996.
[2] Fangpeng Dong et. al., Scheduling Algorithms for Grid Computing: State of the Art and Open Problems, Technical Report No. 2006-504, 2006.
[3] Sanjay, HA and Vadhiyar, Sathish, Performance modeling of parallel applications for grid scheduling. In: Journal of Parallel and Distributed Computing, 68 (8). pp. 1135-1145, 2008.
[4] Saurabh Kumar Garg, Rajkumar Buyya, Scheduling Parallel Applications on Utility Grids: Time and Cost Trade-off Management, Proceedings of the Thirty-Second Australasian Conference on Computer Science - Volume 91, Pages 151-160, 2009.
[5] R. Buyya, M. Murshed, D. Abramson, S. Venugopal, Scheduling parameter sweep applications on global grids: A deadline and budget constrained cost-time optimization algorithm, Software Practice and Experience 35 (5) (2005) 491_512.
[6] D. Abramson, R. Buyya, J. Giddy, A computational economy for grid computing and its implementation in the Nimrod-G resource broker, Future Generation Computer Systems 18 (8) (2002) 1061_1074.
[7] Jennifer M. Schopf, ―A General Architecture for Scheduling on the Grid‖, special issue of JPDC on Grid Computing, April, 2002. [8] Application-level Resource Provisioning , Gurmeet Singh, Carl
Kesselman, Ewa Deelman, in 2nd IEEE International Conference on E-Science and Grid Computing, 2006.
[9] Sanjay, HA and Vadhiyar, Sathish, Performance modeling of parallel applications for grid scheduling, Journal of Parallel and Distributed Computing, 2008.
[10] Globus MDS (Monitering and Discovering System), Available URL: http://www.globus.org/toolkit/mds, accessed on 10th November, 2012.
[11] Globus Toolkit MPICH-G2,
http://www.globus.org/grid_software/computation/mpich-g2.php, accessed on 15 March, 2012.
[12] PI Monte Carlo Simulation, http://math.fullerton.edu/mathews/n2003/montecarlopimod.html, accessed on 14th September, 2012.