SIMULATION OF DYNAMIC LOAD EFFECT ON POWER SYSTEM FREQUENCY
ABDUL RAHMAN BIN AZIZAN
This report is submitted in partial fulfillment of the requirment for the award of the Master of Electrical Engineering with Honours
Fakulti Kejuruteraan Elektrik dan Elektronik Universiti Tun Hussein Onn Malaysia
ABSTRACT
TABLE OF CONTENTS
PAGE
DECLARATION ii
DEDICATION iii
ACKNOWLEDGEMENT iv
ABSTRACT v
ABSTRAK vi
TABLE OF CONTENT vii
LIST OF FIGURE x
LIST OFTABLE xii
CHAPTER 1 INTRODUCTION
1.1 Background 1
1.2 Problem Statement 2
1.3 Objectives 2
1.4 Scope of Study 2
1.5 Expected Result 3
2.1 Introduction 4 2.2 Stability of power system 5 2.3 Basic load concept in term of
frequency dependent model 5 2.4 Frequency variations 7
2.5 Review preview case 8
2.6 Load modeling 12
2.7 Power electronic loads 16
CHAPTER 3 METHODOLOGY
3.1 Introduction 18
3.2 Modeling the three phase dynamic load 20
3.2.1 Load selection 21
3.3 Initial simulation and result 22 3.4 Test case IEEE 9 bus test system 24
CHAPTER 4 RESULT AND ANALYSIS
4.1 Introduction 27
4.2 Result and analysis of dynamic load 27
CHAPTER 5 CONCLUSION
5.1 Conclusion 35
REFERENCES 37
LIST OF FIGURE
PAGE
2.1 Frequency records Sept.9 2003 7
2.2 Eastern interconnection frequency (Feb 1, 2011) 8 2.3 Eastern Interconnection Frequency Response during
LaSalle Unit 1 Trip on (Feb 1, 2011) 9
2.4 Rapid frequency instability. 10
2.5 The model of the IEEE 9 bust test system 11 2.6 Block diagram of the dynamic load model 15 2.7 Model of power system without control 15 2.8 Power electronic frequency dependent load 17
3.1 Methodology flow chart 19
3.2 Diagram indicating the mixture of static and dynamic
loads used for stability studies. 20
3.3 Dynamic load modeling 22
3.4 Model of load (dynamic) and frequency dependent 23
3.5 Frequency variation 23
3.6 IEEE 9 bus test system 24
3.7 Frequency variations IEEE bus test system 25
3.8 Model of time constant (Tp2) 26
4.10 Active power = 46625000 Watt , Tp1= 0 , Tp2= 0.9 33
LIST OF TABLE
PAGE
3.1 Input load 21
4.1 Power supply and load specifications 28
CHAPTER 1
INTRODUCTION
1.1 Background
Power system load component is a variety of equipment transforming electrical energy into other forms of energy (Benson and Wohlgemuth, 1963). The characteristic of load which active and reactive power are varying with the system frequency and voltage respectively have been attracted attentions. The study of load model justification in dynamical analysis of power system seems to demand more interest (Karisson and Hill, 1994).
Dynamic load characteristics changes with the changing of load composition with the time of day and week, seasons and weather. The dynamic load effect will bring significant impact to the power system in term of frequency.
In order to reduce these risks, power system studies have to be developed with better models for system components including better load models (Mota, 2004). Dynamic load modeling had been used as an indicator to the power system stability and more important is, it will leads to reducing the risk by improving quality.
1.2 Problem statement
With the variation of load especially induction motor and power electronic control circuits which is frequency dependent, it can lead the changing the frequency of power supply. Simulation of dynamic load effect will be modeled.
1.3 Objectives
(a) To model a dynamic load model using dynamic load devices.
(b) To simulate the varying parameters which effect power system frequency. (c) To observe the changes in power supply frequency caused by varying
dynamic load.
1.4 Scope of Study
1 Simulate the dynamic load using component-based model especially affected power system frequency.
1.5 Expected result
CHAPTER 2
LITERATURE REVIEW
2.1 Introduction
Rapid dynamic load variations effect the power system. The dynamic load effect will bring significant impact to the power system in term of frequency. Dynamic load modeling is widely used as a model to analyse power system reliability problem. The parameters which affect the power system frequency are to be determined. However, the accurate modelling of load continues to be a difficult task (Price et al., 1992) due to several factors, including:
Large number of diverse load components
Ownership and location of load devices in customer facilities not directly accessible to the electric utility
Changing load composition with time of day and week, season, weather, and through time
Lack of precise information on the composition of the load
Development of the new load technology
2.2 Stability of Power System
Power system stability is the ability of an electric power system, for a given initial operating condition, to recover a state of operating equilibrium after being subjected to a physical disturbance, with most system variables bounded so that practically the entire system remains intact (Sigrist et al., 2010).
Analysis of stability, including identifying key factors that contribute to instability and devising methods of improving stable operation, is greatly facilitated by classification of stability into appropriate categories.
Power system stability can be categorized to rotor angle, frequency and voltage stabilities. As happened in Pacific Northwest, its power system exhibit a random variation overlaying a background oscillatory characteristics with an occasional tendency for oscillations to build up to appreciable magnitudes (Benson and Wohlgemuth, 1963). These oscillatory buildups, or period of frequency instability, were familiar occurrences which usually lasted only a minute or two, where they lasted for an appreciable period of time. Since this study is related with dynamic load effects on power system frequency therefore, more concentration will be made in this context.
2.3 Basic Load Concept in Term of Frequency Dependent Model
many different devices, in control and stability studies, load models must represent their composite behaviors. An overall load model should represent the intrinsic load characteristics (Mauricio and Semlyen, 1971).
The term ‘Load’ can have several meanings in power system engineering, including:
A device, connected to a power system that consumes power
The total power (active and / or reactive) consumed by all devices connected to a power system
A portion of the system that is not explicitly represented in a system model, but rather is treated as if it were a single power consuming device connected to a bus in a system model
Below are some explanations about the term of load:
Load component – A load component is the aggregate equivalent of all devices of a specific or similar type e.g., TV, room air conditioner, fluorescent lighting.
Load class – A load class is a category of load, such as, residential, commercial or industrial. For load modeling purposes, it is useful to group loads into several classes, where each class has similar load composition and load characteristic.
Load composition – The fractional composition of the load by load components.
This term may be applied to a specific load class.
2.4 Frequency Variations
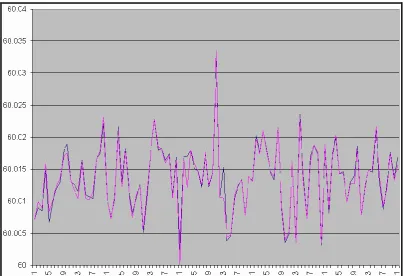
Frequency variation as shown in figure 2.1 is extremely rare in stable utility power systems, especially systems interconnected via a power grid (Zhang et al., 2000).
[image:15.595.117.522.400.676.2]Frequency variation is more common especially if the generator is heavily loaded. Existing equipment which is frequency tolerant does not affected by minor shifts in local generator frequency. However, there are some devices would be affected such as motor device or sensitive device that relies on steady regular cycling of power over time. Frequency variations may cause a motor to run faster or slower to match the frequency of the input power. This would cause the motor to run inefficiently and/or lead to added heat and degradation of the motor through increased motor speed and/or additional current draw.
2.5 Review Previous Case
Case I: Dynamic load scenario in power system
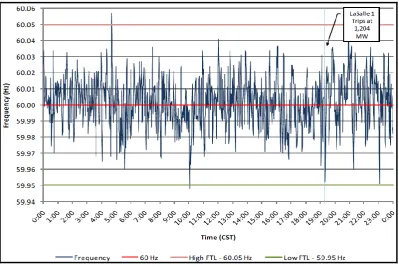
The frequency response performance of the Eastern Interconnection during the period of February 1 through February 5, 2011 was reviewed. Analysis showed that for large unit trips that occurred during that cold snap timeframe, frequency response in the interconnection was within the range of normal performance. Further, frequency was well within normal frequency bounds throughout the period. Therefore no further detailed analysis of frequency response for the Eastern Interconnection was warranted.
[image:16.595.120.520.447.714.2]Figure 2.2 and figure 2.3 show the frequency for the Eastern Interconnection from February 1-5 with the largest generator trip annotated. For perspective, the 5-minute High and Low Frequency Trigger Limits (FTLs) for the Eastern Interconnection are shown.
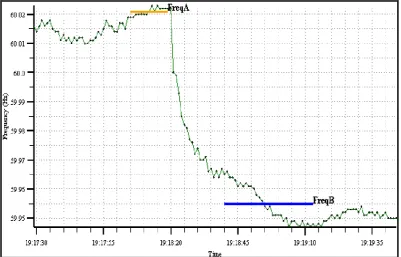
During that period, the largest generating unit trip recorded in the Eastern Interconnection was the loss of LaSalle Unit 1 at 19:18 CST while loaded to 1,204 MW. The frequency response of the interconnection for that event was calculated to be -2,406 MW/0.1 Hz.
Figure 2.3: Eastern Interconnection Frequency Response during LaSalle Unit 1 Trip on (Feb 1, 2011)
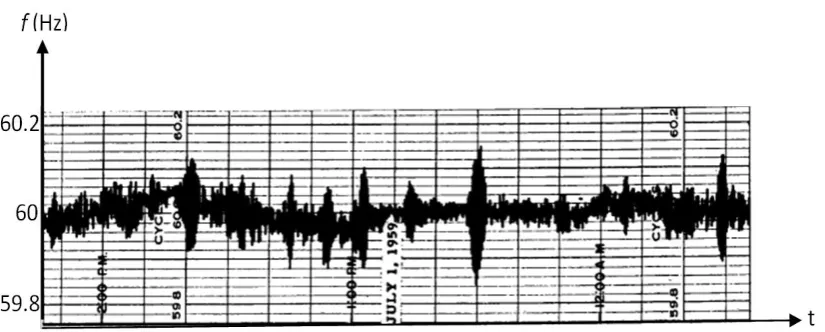
Case II: Frequency growth in Pacific Northwest
Figure 2.4: Rapid Frequency Instability.
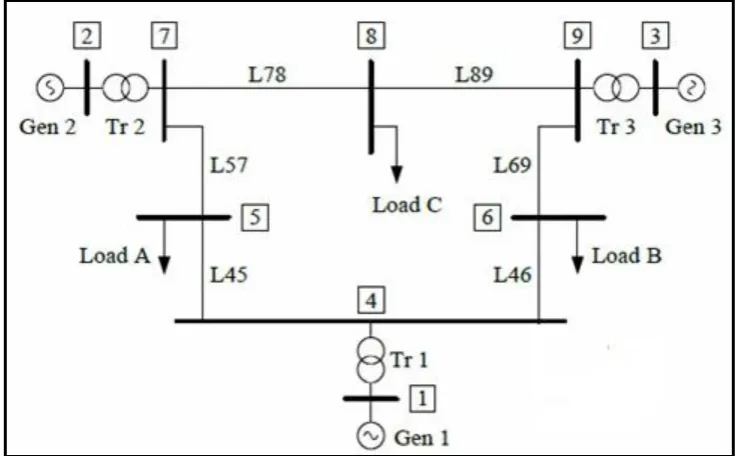
Case III: 9 bus system
[image:19.595.134.504.237.465.2]Figure 2.5 shows the one line diagram of an IEEE 9 bus test system (Anderson and Fouad, 1994). The model consists of three synchronous generators together with corresponding block transformers, six transmission lines and three loads.
Figure 2.5: The model of the IEEE 9 bus test system
2.6 Load Modeling
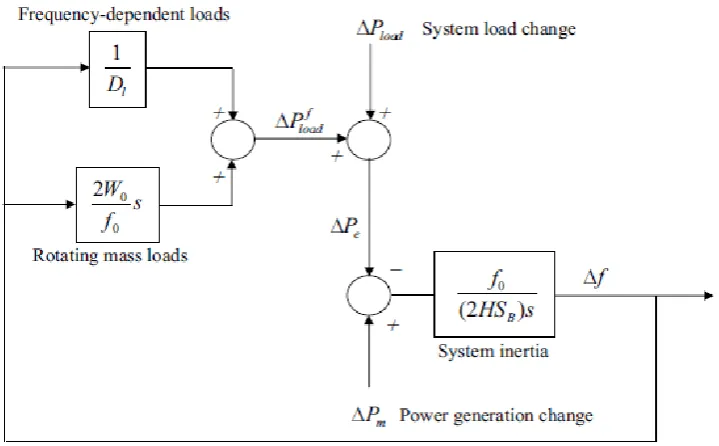
Loads are either frequency-dependent or frequency-independent. In real power systems, a frequency dependency of the aggregated system load is clearly observable. This has a stabilizing effect on the system frequency f, as will be shown in the outcome. Apart from a component depending directly on f, large rotating motor loads cause an additional contribution depending on ḟ. This is due to the fact that kinetic energy can be stored in the rotating masses of the motors.
A load model that captures both effects is given by (Anderson, 2009);
(2.1)
where
: Load power when f = f0
: Frequency dependency
: Function that models the loads with rotating masses
The function g(∆ḟ) will now be derived. The rotating masses have the following
kinetic energy:
(2.2)
(2.3)
and
(2.4)
∆W can be approximated by:
=
(2.5)=
(2.6)=
(2.7)≈
(2.8)The frequency dependency of the remaining load can also be written as:
(2.10)
The values of W0 and Dl are obviously highly dependent on the structure of the load and can be variable over time. Especially W0 is only a factor in power systems with large industrial consumers running heavy rotating machines. The constant Dl has typical values such that the variation of the load is equal to 0 . . . 2 % per % of frequency variation.
The power system without control model derived so far is shown in Figure 2.7.
Figure 2.6: Block diagram of the dynamic load model
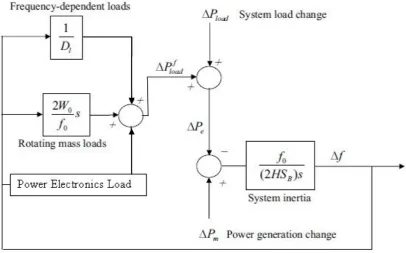
[image:23.595.140.500.318.541.2]2.7 Power Electronic Loads
Currently in the United States, only 15 to 20% of the utility distribution loading consists of linear loads. It is projected over the next ten years that non-linear loads will comprise approximately 70 to 85% of the loading on nation's utility distribution systems (Larsson, 2006).
[image:24.595.117.524.436.689.2]Power quality and high frequency interference problems have increased in power networks during the past few years with the introduction of sophisticated devices, whose performance is very sensitive to the quality of power supply. The explosion of power electronic devices and nonlinear loads and the occurrence of electrical faults causes significant amount of power quality problems in distribution network (Tao and Alexander, 2006). However, these power electronic devices have considerable effect on power system frequency being on active power consuming devices as modelled in figure 2.8 (Anderson, 2009).
CHAPTER 3
METHODOLOGY
3.1 Introduction
A dynamic load is modeled using an approach of composite-based model. Load components are selected among general electrical devices such as induction motor.
Figure 3.1: Methodology flow chart Start
Devices/Load component selection
Dynamic load modelling using Simulink
Simulation successful
Output data collection and calculation
Analysis and discussion
Conclusion
Finish Yes
No
3.2 Modeling the Three Phase Dynamic Load
[image:28.595.172.462.234.388.2]A three-phase load was modeled as a percentage of static and dynamic loads. The static portion is modeled as constant impedance whereas the dynamic load can be modeled as either a linear load or a non-linear load as shown in figure 3.2.
Figure 3.2: Diagram indicating the mixture of static and dynamic loads used for stability studies.
(3.1)
(3.2)
Where
V0 is the initial positive sequence voltage
P0 and Q0 are the initial active and reactive powers at the initial voltage V0
V is the positive-sequence voltage
Tp1 and Tp2 are time constants controlling the dynamics of the active power P
Tq1 and Tq2 are time constants controlling the dynamics of the reactive power Q
3.2.1 Load Selection
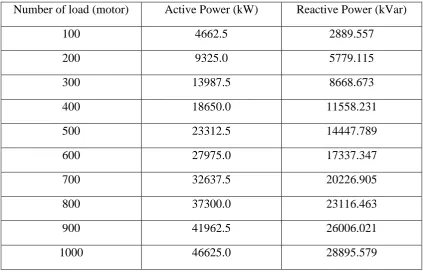
In this simulation, induction motors have been used as a load to dynamic load. Induction motors chosen because it consumes very high power. Specification of load as below (table 3.1):
η (efficiency) = 80% pf (power factor) = 0.85 lag
[image:29.595.107.531.490.762.2]Pout = 50 HP ≈ 37300 W
Table 3.1: Input load
Number of load (motor) Active Power (kW) Reactive Power (kVar)
100 4662.5 2889.557
200 9325.0 5779.115
300 13987.5 8668.673
400 18650.0 11558.231
500 23312.5 14447.789
600 27975.0 17337.347
700 32637.5 20226.905
800 37300.0 23116.463
900 41962.5 26006.021
3.3 Initial Simulation and Result
Figure 3.3: Dynamic load modelling
The work was started with one bus connected with the generator and the composite load. The frequency measurement was obtained by using Phase Locked Loop (PLL) as shown in figure 3.3.
Figure 3.3 shows the block diagram of the simulation of the dynamic load. This dynamic load model uses a Three-Phase Dynamic Load block connected on a power network. The network is simulated by its Thevenin equivalent. The source internal voltage is modulated in order to simulate during a power swing.
Frequency measurements were placed at the power supply and at the current event of the dynamic load. The results obtained are shown in figure 3.5. The obtained results are based on the parameters as given in table 3.1.
From the power system behavior, frequency will be captured by using 3 phase PLL and figure 3.4 below shows how the frequency captured based on the Vabc (pu).
Figure 3.4: Model of load (dynamic) and frequency dependent
[image:31.595.135.503.400.685.2]Figure 3.5 shows the changes in frequency. Simulation starts at 0.2 seconds to 1.2 seconds. At the early stages of the simulations from 0 second to 0.2 seconds, there are high variations in frequency magnitude but in short period of time. This current event may activate the sensitive protection system and cause disconnection of load from supply. If there is difference between equilibrium of supply and demand, the frequency drop can lead to islanding. On the other side, which timing between 0.2 seconds to 1.2 seconds, the frequency variations magnitudes are quite small but in longer time. This kind of situation also called frequency transient which can lead power system collapse.
[image:32.595.138.503.379.655.2]3.4 Test Case IEEE 9 Bus Test System
REFERENCES
A. Larsson, “High frequency distortion in power grids due to electronic equipment”,Licentiate dissertation, Luleå University of Technology, kellefteå, Sweden, 2006.
Akhtar, M.Y. (1969). Comprehensive consideration of transient frequency deviation in power system transient stability studies. PROC. IEEE, 166 (11), 1920-1969.
Benson, A.R., and Wohlgemuth, D.G. (1963). System Frequency Stability in the Pacific Northwest. System Frequency Stability, 765-769.
D. Karlsson and D. J. Hill, “Modelling and identification of nonlinear dynamic loads in power systems,” IEEE Trans. Power Syst., vol. 9, no.1, pp. 157–166, Feb. 1994
G. Andersson: Modelling and Analysis of Electric Power Systems, ETH Zurich, 2009.
G. L. Skibinski, R. J. Kerkman and D. Schlegel, “EMI emissions of modern PWM AC rives,” IEEE Industry Applications Magazine, vol. 5, Issue: 6, pp. 47 - 80, 1999.
Karisson, D., and Hill, D.J. (1994). Modeling and Identification of Non-linear Dynamic Load in Power System. IEEE Transaction on Power Systems, 9 (1), 157-166.
Klien, M., Rogers, G.J., and Kundur , P. (1991). A Fundamental Study of Inter-area Oscillations in Power Systems. Transaction on Power Sysytems, 6 (3), 914-921.
Liang, Y., Nwankpa C.O., Fischi, R., DeVito, A., and Readinger, S.C. (1998). Dynamic Reactive Load Model. IEEE Transaction on Power Systems, 13 (4), 1365-1372.
M. D. Illic, J. R. Lacalle-Melero, F. Nishimura, W. Schenler, “Short-term Economic Energy Management in a Competitive Utility Environment,” IEEE transactions on Power Systems, vol. 8, no. 1, pp. 198-206, February 1993.
Mauricio, W., and Semlyen, A. (1971). Effect of Load Characteristics on the Dynamic Stability of Power Systems. The IEEE Winter Meeting in New York.
Mayer, F.J., and Lee, H.Y. (1982). Improved Dynamic Load Model for Power System Stability Studies. IEEE Transaction on Power Systems, PAS-101 (9), 3303-3309.
Milanovic, J.V., and Hiskens, I.A. (1995). Effect of dynamic load model parameters on damping of oscillations in power systems. Electric power Systems Research, 33. 53- 61.
Milanovic, J.V., and Hiskens, I.A. (1995). Effect of dynamics on power system damping. IEEE Transaction on Power Systems, 10 (2), 1022-1028.
Mota, L.T.M., and Mota, A.A. (2004). Load modeling at electric power distribution substations using dynamic load parameters estimation. Electrical Power and Energy Systems, 26, 805-811.
IEEE Press, 1994.
Price, W.W., Chiang, H.D., Clark, H.K., Concordia, C., Lee, D.C., Hsu, J.C., Ihara, S., King, C.A., Lin, C.J., Mansour, Y., Srinivasan, K., Taylor, C.W., and Vaahedi, E. (1992). Load Presentation for Dynamic Performance Analysis. IEEE Transaction on Power Systems, 8 (2), 472-482.
Sigrist, L., Egido, I., and Rouco, L. (2010) Frequency Stability Boundary of Small Isolated Power Systems. IEEE 26-th Convention of Electrical and Electronics Engineers in Israel.
Tao L, Alexander D, 2006, “Real time Measurement of Power Disturbances: Part 1. Survey and a Novel Complex Filter Approach”. Electric Power Systems Research. Vol. 76.)
Vellano N, Soletto K, 2007, “PLC Systems Performance Analysis Regarding Power Quality Disturbances”. IEEE International Symposium. Vol. 10.
Wang, J.C., Chiang, H.D., Chang, C.L., Liu, A.H., Huang, C.H., and Huang, C.Y. (1994) Development of a Frequency-dependent Composite Load Model using the measurement Approach. IEEE Transaction on Power Systems, 9 (3), 1546-1556.
Zhao, B., Tang, Y., Zhang, W., and Wang, Q. (2010). Modeling of Common Load Components in Power System Based on Dynamic Simulation Experiment. International Conference on Power System Technology.