Journal of Chemical and Pharmaceutical Research, 2014, 6(3):543-548
Research Article
CODEN(USA) : JCPRC5
ISSN : 0975-7384
Studies on three dimensional point spread function energy distribution of
biological microscopic imaging system
Chen Hua*, Cai Yi, Yang Fengjuan and Wei Wei
School of Computer, Electronics and Information in Guangxi University, Nanning, China
_____________________________________________________________________________________________
ABSTRACT
This paper conducted the theoretical analysis on 3D-PSF constitution, 3D-PSF energy distribution of different defocus amount and radial amount of focal-plane of digital biological confocal microscopic imaging system at first. In the study of 3D-PSF energy distribution of biological microscopic imaging system, it proposed the concept of energy ratio, conducted simulation experiments and calculated the energy ratio values of three groups with different magnifications, finally established its energy ratio spatial distribution model. Results showed that, 3D-PSF axial and radial energy rapidly decays with the axial and radial increasing, and the greater the magnification, the faster the energy attenuation, the more concentrated the energy.
Key words:Biological Microscopic Imaging System; 3D-PSF; Space Size; Energy Ratio; Energy Distribution _____________________________________________________________________________________________
INTRODUCTION
In the Digital Confocal Microscopy Technology, the three-dimensional biological specimen are moved along the optical axis to obtain two-dimensional slice images of the sequence through the objective lens focal plane of bio-optical microscope, which are then processed through three-dimensional microscopic image restoration algorithm to obtain the clear two-dimensional image sequence and three-dimensional images [1]. The space size of 3D-PSF (Three Dimensional Point Spread Function) used for biological image restoration processing determines the restoration effect and restoration time [2]. Since most energy of 3D-PSF is concentrated in the area close to the cone top of double cone in the center, how much the space area in the center of 3D-PSF should be selected, and what kind of relationship exists between the restoration effect and restoration time of images are still the problems to be studied and solved.
This article studied the 3D-PSF energy distribution in biological optical microscopic imaging system, identified its characteristics, and established its energy spatial distribution models, thereby laying the foundation for the studies of relationship among 3D-PSF energy ratio and image restoration effect and restoration time as well as for the establishment of 3D-PSF optimization selection model.
BIOLOGICAL MICROSCOPIC IMAGING SYSTEM 3D-PSF
Proposal of 3D-PSF Energy Ratio Concept
defocusing optical transfer function is expressed as follows [4]:
1
( , ) (2 sin 2 ) jinc 4 (1 ) c c
q q
H w q kw
f f
(1)
Wherein, w is the defocus error, w=
z NA
2/ 2
,
z
is the defocus amount; q is the frequency,f
c is thecut-off frequency of the system,
q
2
u
2
v
2,
NA
f
c2
, fc
q 1 cos
, 2 k ,1( )
jinc( ) 2x J x x
。
Through calculating the optical transfer function with different defocus amount, a series of corresponding defocus 2D-PSFs can be obtained, thereby constituting the biconical 3D-PSF [4, 5].
Theoretical Analysis of 3D-PSF Energy Distribution
Under the narrowband incoherent illumination of central wavelength λ, the focal plane 2D-PSF of circular aperture lens with the diameter a can be expressed as [4]:
2
1 0
0
( [ ])
h( )
2
[ ]
r
J
r
r
r
r
(2)Wherein, the constant
r
0 is a scale factor with the dimension, 0i
d
r
a
,
r
is the radial distance from theoptical axis of image plane,
2 2
i i
r
x
y
.
The relationship between the energy E of a function f(r) in the infinite space with this function f(r) is an integral [6]:
2
[image:2.595.78.544.87.211.2] [image:2.595.206.408.612.705.2]0
| ( ) |
E
f r dr
(3)The energy Er of this function f(r) in the limited discrete space can be expressed as:
2
0
| ( ) |
rr
E
f r
r
(4)
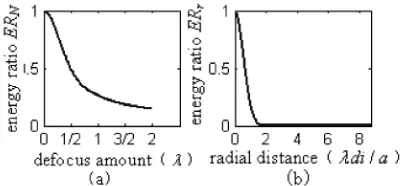
Through the calculation of Formula (1) and (4), the energy ratio of ERN for 2D-PSF with different defocus amounts can be obtained. Through the calculation of Formula (2) and (4), the energy ratio ERr of focal plane 2D-PSF at different radial distances can be obtained, as shown in Fig.1 (a) and (b) below.
Fig. 1 Impact of Defocus Amount and Radial Distance on the PSF Energy
SIMULATION EXPERIMENT AND ANALYSIS
3D-PSF Spatial Energy Distribution
1) Simulation Production of Optical System 3D-PSF
Three groups of microscope objective lens parameters with different magnification are set: (1) the magnification M=40x, the numerical aperture NA=0.6; (2) the magnification M=20x, the numerical aperture NA=0.45; (3) the magnification M=10x, the numerical aperture NA=0.25.
The mechanical tube length of microscope is 160mm; the light source wavelength is 550nm; CCD parameters: 1/4 inch, the pixel value 640×480.
3D-PSF space size is set as r×r×N, r is 3D-PSF diameter, and N is the number of layers. 3D-PSF layer distance L is taken as 0.2μm.
Three 3D-PSF with the magnifications of 40x, 20x and 10x respectively and with the same space size of 101×101×101 are produced according to Formula (1). The diameter r is 101, the number of layers N is 101 layers, and the layer distance is taken as 0.2μm, which are all expressed as h 101*101*101.
2) Simulation Production of 3D-PSF with Different Space Size
In each h101*101*101, the diameter r is taken from the center as 3, 5, 7, ..., 101, the number of layers N is 3, 5, 7, ..., 101, and then it obtains three groups each containing 2500 3D-PSF and where the space size is 3×3×3, 3×3×5, ..., 3×3×101, 5×5×3, 5×5×5, ..., 5×5×101, ..., 101×101×101.
3) 3D-PSF Space Size and Energy Ratio
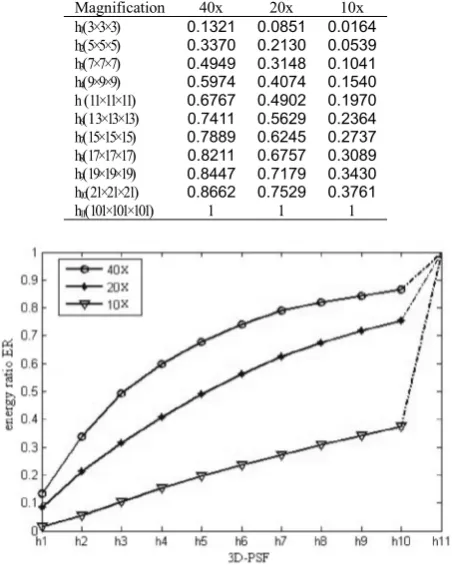
[image:3.595.193.420.414.698.2]By the use of 3D-PSF spatial point energy value accumulating method, each of the three groups containing 2500 3D-PSFs’ energy is calculated respectively, and conducted with its respective h101*101*101 energy as 1, obtaining the energy ratio ER of these three groups 3D-PSF with different space size. Table 1 shows the ratio of energy of three groups of some 3D-PSF with different space size, and Fig.2 is the curve between energy ratio and space size.
Table 1 Relationship between Energy Ratio and Space Size of Some 3D-PSF under Three Kinds of Magnification
Magnification 40x 20x 10x
h1(3×3×3) 0.1321 0.0851 0.0164
h2(5×5×5) 0.3370 0.2130 0.0539
h3(7×7×7) 0.4949 0.3148 0.1041
h4(9×9×9) 0.5974 0.4074 0.1540
h (11×11×11) 0.6767 0.4902 0.1970
h6(13×13×13) 0.7411 0.5629 0.2364
h7(15×15×15) 0.7889 0.6245 0.2737
h8(17×17×17) 0.8211 0.6757 0.3089
h9(19×19×19) 0.8447 0.7179 0.3430
h10(21×21×21) 0.8662 0.7529 0.3761
h11(101×101×101) 1 1 1
Fig. 2 Diagram between Energy Ratio and Space Size of Some 3D-PSF under Three Kinds of Magnification
small (areas close to the origin of coordinates), its energy ratio shows the relatively rapid-growing trend with the increase of space size, and the greater the magnification, the faster the energy ratio increase, such as 40x. When its space size increases to a certain extent, the degree of this growth is slowed down. This indicates that, for 3D-PSF with the greater magnification, its energy is more concentrated in the central area; while for 3D-PSF with the smaller magnification, its energy is more spread over a wide space area.
Axial Energy and Radial Energy
1) Energy Attenuation in Optical Axis and Central Layer of 3D-PSF
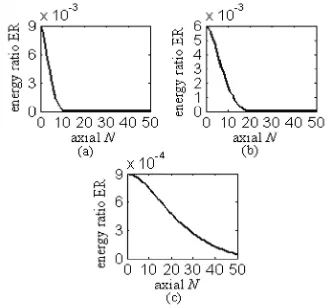
[image:4.595.224.389.209.363.2]For the above three 101×101×101 3D-PSF, we respectively calculated the energy ratio value in its optical axis with the axial size N and the energy ratio value of focal plane 2D-PSF in central layer (N is 0) with the radial size r, Fig. 3 and Fig..4 are respectively the corresponding curve diagram between axial N and radial r with energy values.
Fig. 3 3D-PSF Axial Energy Attenuation Diagram of Optical Axis (a) M=40 (b) M=20 (c) M=10
Fig. 4 3D-PSF Radial Energy Attenuation Diagram of Central Layer (a) M=40 (b) M=20 (c) M=10
As seen from Fig. 3, and Fig. 4, 1) The axial energy along the optical axis and the radial energy in the central layer of 3D-PSF decay rapidly with the axial and radial increase. 2) The greater the magnification, the larger the energy in 3D-PSF center point and nearby areas, and the energy at 40x center point is nearly 10 times of the energy at 10x center point. This also proves that, for 3D-PSF with the greater magnification, its energy is more concentrated in the central areas.
2) Energy Distribution along the Optical Axis Cross-section and Center Layer of 3D-PSF
[image:4.595.225.391.395.577.2]Fig. 5 Axial Cross-section Energy Gray-scale Diagram (a) M=40 (b) M=20 (c) M=10
From Fig. 5, it can be seen that, the energy of 3D-PSF spreads from the center to the right and left sides, the shape is similar to the shape of double cone, and the brightest place in the center is the top of double cone. Comparing Fig. 5(a), Fig. 5(b) and Fig. 5(c), it can be seen that, with the reduction of magnification, the cone angle gradually becomes smaller, and under the same defocus amount, the radial spread degree of energy is reduced; and the bright area in the central area of 3D-PSF spreads towards the left and right sides in the axial direction, the energy of 3D-PSF also spreads along both sides of optical axis.
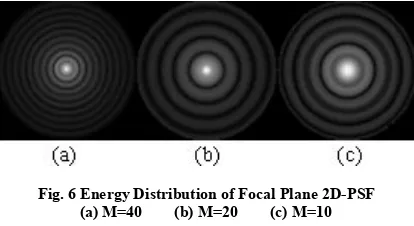
The focal plane 2D-PSF is taken respectively for three 3D-PSF h101*101*101, and the energy value of each point is calculated. The energy distribution of focal plane 2D-PSF is shown in Fig. 6 (in order to show the energy distribution, the logarithmic conversion processing is conducted for energy values in Fig.6).
Fig. 6 Energy Distribution of Focal Plane 2D-PSF (a) M=40 (b) M=20 (c) M=10
As seen from Fig. 6, the energy of focal plane 2D-PSF shows the annular wave spreading from the center to the surrounding. Comparing Fig. 6(a), Fig. 6(b) and Fig. 6(c), it can be seen that the central bright spot of 40x focal plane 2D-PSF is the smallest, and the central bright spot of 10x focal plane 2D-PSF is the largest, indicating that, with the decrease of magnification, the energy spread degree of focal plane 2D-PSF from the center to the surrounding increases.
3D-PSF ENERGY RATIO SPATIAL DISTRIBUTION MODEL
In order to clarify the change relationships between 3D-PSF energy and space size under the conditions of fixed parameter variables, this article conducted the fitting on the spatial distribution of energy ratios of three groups containing 2500 3D-PSFs, three 3D-PSF energy distribution models were obtained, which are respectively Formula (5), (6) and (7).
2 40
5 2 6 3
7 2 9 2 6 3
0.333 0.01027r 0.02177 0.00019 3.7 10 0.00035 1.045 10 2.5 10 1.8 10 r 1.7 10
E N r
rN N r
r N N N
(5)
2 20
5 2 7 3
7 2 8 2 6 3
0.0727 0.0083r 0.034 0.00016 2.94 10 0.00052 9.47 10 2.63 10 6.8 10 r 2.5 10
E N r
rN N r
r N N N
(6)
5 2 10
5 2 7 3
8 2 8 2 7 3
0.061 0.0027r 0.022 4.65 10 1.79 10 0.00018 +2.5 10 7.398 10 4.16 10 r 5.3 10
E N r
rN N r
r N N N
(7)
[image:5.595.203.410.311.424.2]error (SSE) of Formula (7) was 0.2711, and the root mean square error (RMSE) was 0.01043.
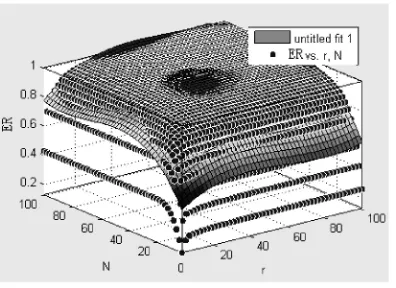
[image:6.595.209.407.116.260.2]6-order polynomial fitting surface plot of 3D-PSF with 40x magnification is shown in Fig. 7.
Fig. 7 6-order Polynomial Fitting Surface Plot of 3D-PSF with 40x Magnification
In Fig. 7, the lattice is the actual energy ratio distribution, and the surface is the fitting surface. Through the 3D-PSF energy ratio spatial distribution model, each 3D-PSF energy ratio of different space size can be obtained, thereby laying the foundation for the studies of 3D-PSF energy ratio and image restoration effect and restoration time as well as for the optimization selection of 3D-PSF.
CONCLUSION
In the study of 3D-PSF energy distribution of biological microscopic imaging system, this paper proposed the concept of energy ratio. The simulation experiments were conducted for 3D-PSF of three optical biological imaging system with 40x, 20x and 10x magnification, the energy ratio values of three groups each containing 2500 3D-PSF with different magnifications and different space size were calculated, the energy distribution status and its characteristics were identified, and its energy ratio spatial distribution model was established. Simulation experiment results showed that, the axial and radial energy of 3D-PSF rapidly decays with the axial and radial increasing, the greater the magnification, the faster the energy attenuation. Moreover, for 3D-PSF with the greater magnification, its energy is more concentrated in the central area; while for 3D-PSF with the smaller magnification, its energy is more spread over a wide space area.
Acknowledgements
This research was supported by The National Natural Science Foundation of China(No. 61164019)and Guangxi Natural Science Foundation (No. 2012GXNSFAA053216).
REFERENCES
[1] Su,B.H., etal,2000.Optical Technology, 26(5).
[2] Chen,H., Jin,W.Q, Wang,X.,2006.Optical Technology, 32 (3), pp:434-439.
[3] Chen,H.,2005.9.Research on the Image Restoration Algorithms of Digital Confocal Microscopy and system dev elopment. D. Beijing: PhD Thesis of Beijing Institute of Technology.
[4] Kenneth,R,C. ,2002.Digital image processing. Beijing:Publishing House of Electronics Industry , pp:471-483. [5] Gu.M.,2000. Principles of Three-Dimensional Imaging in Confocal Microscopes.Beijing: The new era of press.pp:1-13.