RELATIVE DISTANCE PERCEPTION
OF SOUND SOURCES IN CRITICAL
LISTENING ENVIRONMENT VIA
BINAURAL REPRODUCTION
FOTIS GEORGIOU
School of Computing, Science and Engineering University of
Salford, Salford, UK
Contents
Abbreviations ... v
Dedication ... vi
Acknowledgments ... vii
Abstract ... viii
1. Introduction ... 1
1.1 Research motivation and project objectives ... 1
1.2 Methodology ... 3
2. Basic Theory ... 4
2.1 Head and Torso related cues ... 4
2.3 Head and Torso Simulator and Binaural Synthesis ... 6
2.3.1 Head and Torso Simulator ... 6
2.3.2 Binaural synthesis ... 6
2.4 Room Impulse Response and the importance of its anatomy ... 7
2.6 Conclusion ... 9
3. Perception of distance ... 10
3.1 Distance perception cues ... 10
3.1.1 Source level ... 10
3.1.2 Reverberation and direct to reverberant ratio ... 12
3.1.3 Binaural cues ... 14
3.1.4 Spectral changes due to source location ... 17
3.1.5 Familiarity and learning ... 17
3.1.7 Vision ... 19
3.1.8 Physical vs perceived distance ... 19
3.1.9 Individual HRTF and head tracking ... 20
3.2 Externalisation ... 20
3.2.1 Early stages of inside head locatedness (IHL) research ... 20
3.2.2 Individual cues ... 21
3.2.3 Decorrelation of ear signals ... 22
3.2.4 Head Tracking ... 22
3.2.5 Reverberation ... Error! Bookmark not defined. 3.2.6 Headphone equalisation ... 23
3.2.7 Virtual vs Real source ... 25
3.3 Conclusion ... 25
4. Modelling and Measuring the BRIR ... 27
4.1 Modelling of BRIR ... 27
4.1.1 Design of the direct part ... 27
4.1.2 Design of the early reflections ... 28
4.1.4 Combining Early Reflections and Reverberation ... 32
4.1.5 Code block diagram ... 32
4.2 Measurement of BRIR ... 33
4.3 Match modelled BRIRs with Measured BRIRs ... 34
5. Listening Tests Methodology ... 37
5.1 Review on relative and absolute distance judgments ... 37
5.2 Experimental Definitions ... 38
5.3 Design of the test stimuli ... 39
5.3.1 Source signal ... 39
5.3.2 Listening Tests: Part 1 ... 40
5.3.3 Listening Test: Part 2 ... 43
5.3.5 Listening Test: Part 3 ... 46
5.4 Listening Test Methodology ... 47
5.4.1 Subjects ... 47
5.4.2 Procedure ... 47
5.4.3 Organization of test samples ... 49
5.5 Conclusion ... 51
6. Results analysis ... 52
6.1 Distance perception of synthesized sources with normalized level ... 52
6.2 Effect of D/R and reflections TOA ... 55
6.3 Distance perception of synthesized sources with level differences ... 57
6.4 Conclusion ... 58
7. Discussion ... 59
8. Conclusion ... 61
9. Further work ... 63
References ... 64
APPENDIX ... 78
APPENDIX A ... 79
APPENDIX B ... 82
[image:3.595.85.512.92.580.2]
List of Figures
Figure 2.1: Interaural Time Difference (ITD) and Interaural Level Difference (ILD) ... 5Figure 2.2: Binaural synthesis ... 6
Figure 2.3: Room Impulse Response ... 7
Figure 3.1: RMS pressure at the near ear as a function of source distance) ... 11
Figure 3.2: Impulse Reponses of a close and a far source. ... 13
Figure 3.4: Acoustic parallax. ... 16
Figure 3.5: Headphone Transfer Function of HD 800 measured with B&K 4100 ... 24
Figure 4.1: Image source example ... 29
Figure 4.2: Modelled early response ... 30
Figure 4.3: BRIR reverb tail octave bands ... 31
Figure 4.4: Receiver and speaker inside the listening room ... 33
Figure 4.5: Direct-to-reverberant ratio of modelled and measured BRIRs .... ... 36
Figure 5.1: Spectrogram of anechoic Italian speech ... 40
Figure 5.2: Signals convolved with measured BRIRs without RMS normalization .... 41
Figure 5.3: Signals convolved with measured BRIRs after RMS matching ... 42
Figure 5.4: D/R ratio manipulation vs real source displacement ... 44
Figure 5.5: Delay manipulation… ... 45
Figure 5.6: Level manipulation ... 46
Figure 5.7: Example of scaling relative distance.... ... 48
Figure 5.8: User interface for relative distance evaluation. ... 48
Figure 6.1: Estimated relative distances between sources wth normalized level. ... 53
Figure 6.2: Estimated relative distances between sources whose D/R was ……...manipulated. ... 55
Figure 6.3: Relative distance estimation of virtual sources with level differences. .... 57
Figure A.1: Listening room's measured and modelled right ear BRIR… ... 79
Figure A.2: Listening room's measured and modelled left ear BRIR ... 79
Figure A.3: Frequency response of measured and modelled right ear BRIR ... 80
Figure A.4: Frequency response of measured and modelled left ear BRIR ... 80
Figure A.5: Energy decay curves of right ear measured BRIR ... 81
Figure A.6: Energy decay curves of right ear modelled BRIR ... 81
List of Tables
Table 5.1: List of abbreviations ... 49Table 5.2: Comparison pairs of listening tests Part 1 ... 50
Table 5.3: Comparison pairs of listening tests Part 2 ... 50
Table 5.4: Comparison pairs of listening tests Part 3 ... 50
Table 6.1: Percentage cases where the second virtual source was perceived farther, …….. closer or at the same distance from the first source (virtual sources with …….. normalized level)… ... 53
Table 6.2: Level of significance between different relative distances of sources with …….. normalized level. ... 54
Table 6.3: Level of significance of relative distances between modelled and mea- ……...sured virtual sources with normalized levels………..…..54
Table 6.4: Percentage cases where the second source was perceived farther, closer ………or equal to the first source when D/R or reflections TOA were the only …………...factors manipulated from the BRIRs. ... 55
Table 6.5: Level of significance of relative distances between source whose D/R was …………...manipulated. ... 56
Table 6.7: Percentage cases where the second virtual source was perceived farther,
……. .closer or equal from the first source (virtual sources with level differences
…….. between them).. ... 57
Table 6.8: Level of significance of relative distances between sources with level …….. differences. ... 57
Table 6.9: Level of significance between the same virtual source with and without …….. level differences ... 58
List of Equations
Equation 3.1: Inverse square law ... 10Equation 4.1: Direct sound modelling ... 28
Equation 4.2: Processing of image source ... 30
Equation 4.3: Octave band decay function ... 31
Equation 5.1: RMS Normalization ... 42
Abbreviations
BRIR Binaural Room Impulse Response
D/R Direct to Reverberant Ratio
HATS Head and Torso Simulator
HRIR Head Related Impulse Response
HRTF Head Related Transfer Function
IACC Interaural Cross Correlation
ILD Interaural Level Difference
ITD Interaural Time Difference
RMS Root Mean Square
Dedication
This dissertation is dedicated to my parents, Kaiti Germanou and Apostolos Georgiou. Their support, encouragement, and constant love have sustained me throughout my life.
Acknowledgments
I am most grateful to the project supervisor, Dr. Bruno Fazenda for his time, guidance, and encouragement.
A special thanks is owned to Artemis who was close to me and her support has been precious.
I would like to thank the staff members from the Acoustics Department at the University of Salford for providing me technical support and all the required equipment for the implementation of the project, and all the twenty-three subjects who participated in the listening experiment.
I would also like to thank my aunt Maro who helped me during the most difficult period of the project, my friends Andreas, Trifon, Dimitris, and Manos who encouraged me all these years, and all my friends from Skopelos who always believed in me and helped me to succeed in my goals.
Abstract
1. Introduction
1.1 Research motivation and project objectives
Humans localise sound sources in three-dimensions. The egocentric location of a source is specified in terms of the two parameters: its direction, dependent on azimuth (lateral direction with respect to the facing direction of the head) and elevation (direction with respect to the ear-level plane); and its distance (how far or close is the source from the listener's head).
Distance perception of sound sources has received little attention in comparison to directional localisation and other spatial hearing mechanisms. Distance perception is a more complicated task than directional localisation. The mechanisms and the way people perceive distances are not yet fully understood. However, over the past fifteen years there has been an increased interest in this research area and researchers have managed to identify many acoustic and non-acoustic cues that are related to distance perception.
There are two factors in distance perception, the egocentric and the exocentric. Exocentric or relative factors influence the differences in distance perception of the relative positions between sound sources and do not themselves provide absolute distance information unless the listeners have previous information about the characteristics of the source. Egocentric or absolute cues, on the other hand, are the variables that provide information about the absolute location of the sound source. Also, egocentric distance is the apparent distance of a sound source and exocentric or relative distance is referred to as the relative distance between sound sources. Basically, the "relative" part means that there is some external reference to the listener (Mershon 1979, Zahorik 2002a, Shinn-Cunningham 2000b, Nielsen 1993).
distance cue and cannot, by itself, provide information about the absolute source distance unless the listener has previous information about the characteristics of the sound source (Mershon 1975). Conversely, D/R is a strong absolute distance cue (Zahorik 2002a, 2000c; Larsen 2008). Interaural level differences (level difference between signals arriving at the left and right ear due to the shadowing effect of the head and the extra path that the sound has to travel to reach the farther ear relative to the sound source) can provide also distance information for sources outside the median plane. Interaural level difference can serve both as relative and absolute distance cues for near distances (Fukuda 2003; Brungart 1999). Other acoustic distance cues are the change in spectrum of the source due to air absorption; and low frequency absorption of the materials of a room (Butler 1980; Blauert 1976). Two non-acoustics cues that strongly affect distance perception are the familiarity (how familiar the listener is with the listening environment and the source signal) and vision (Devalez 2008; Zahorik 2001; Mershon 1980). Vision plays a primary role in distance perception, but visual information cannot always be provided to the listener. For example, in the work presented here listeners were listening to binaural reproduced sound sources but they were not given any visual information either for the source or the modelled environment.
When the source is synthesized binaurally, the information about the source location within the room is provided from the binaural room impulse response (BRIR). The BRIR describes the sound transfer from the source to the receiver ears. The BRIR includes the effects of the sound reflections from boundaries and the effects of the diffractions on the listener's head and body including the microreflections of the pinna. Therefore, BRIR's are very important on the auralisation techniques such as binaural reproduction through headphones.
sensitivity. Kim (2001) and Shinn-Cunningham (2000b) looked into the effect of binaural cues in distance perception for nearby sources. Shinn-Cunningham (2000b) examined distance perception under reverberant and anechoic conditions for nearby sources. Fukuda (2003) researched the effect of ILD in relative distance perception. Other researchers investigated the effect of non-acoustic cues, such as vision and learning, in distance perception (Mershon 1980; Zahorik 2001; Schoolmaster 2003a).
In this project BRIRs were modelled and measured in a critical listening room with dimensions 6.6m×5.8m×2.8m and reverberation time of 0.27 seconds. These BRIRs were used to investigate the project's main objectives which are listed below:
1. Investigate the effect of D/R on relative distance perception.
2. Evaluate differences between modelled and measured BRIRs in providing relative distance cues.
3. Examine the effect of early reflections TOA on relative distance perception.
1.2 Methodology
One pairwise listening test was performed which was separated in three parts. Subjects were asked to indicate in a continuous dimensionless scale how far or close they perceive the second sound of the pair in comparison to the first sound. The source signal was a 4 seconds long Italian speech sample.
In the first part of the listening test, relative distance perception was evaluated both for measured and modelled BRIRs and overall level normalized. In the second part the effect of D/R and reflections TOA in relative distance perception was investigated. The third part was exactly the same as the first but the overall level between virtual sources was not normalized. The results were analysed by a non-parametric ANOVA called Kruskal–Wallis.
2. Basic Theory
In this section basic theory that is directly related to the project is briefly demonstrated. This section includes aspects on binaural cues, including the concept of binaural synthesis and room acoustics.
2.1 Head and Torso related cues
The three main head related cues are the interaural time difference (ITD), the interaural level difference (ILD), and the head and torso spectral cues. Interaural time difference is a consequence of the physical separation of the two ears (figure 2.1). ITD occurs due to the extra path that the sound wave has to travel to reach the ear that is farther from the sound source. Interaural level difference (ILD) refers to the amplitude differences between the two ears, which occurs due to the shadowing effect of the head when the source moves away from the median plane (Blauert 1976; Howard and Angus 2009).
Figure 2.1: Interaural Time Difference (ITD) and Interaural Level Difference (ILD)
Spectral cues occur due to the reflections at the outer ear (pinna), torso and head. The complex construction of the outer ear causes a unique set of micro delays, diffractions, and resonances that form a comb filter effect. These effects occur typically at frequencies above 5kHz. Spectral cues are the main cues for front-back and elevation localisation and are unique for every person (Møller 1995). The combination of these three cues is known as Head-Related Transfer Function (HRTF). HRTFs have a very important role in 3D sound reproduction.
These three head related cues, and especially the spectral cues, have singular characteristics for each source location. Consequently, there is a singular HRTF for each sound source position. In the time domain, the HRTFs are referred to as Head Related Impulse Responses (HRIR). The head related transfer function combined with the reflections from boundaries and other obstacles is referred as Binaural Room Impulse Response (BRIR).
2.3 Head and Torso Simulator and Binaural Synthesis
2.3.1 Head and Torso Simulator
Measurement of HRTFs can be made near the eardrum, within the ear canal, or at the entrance of the ear canal (blocked). Møller (1995) argues that blocked ear canal measurements vary less across individuals compared to open ear canal measurements.
Nonetheless, measuring individual HRTFs is very time consuming and in most cases, measurements cannot be made at the listener's own ears (e.g. consumer applications for video game audio). For this purpose more generalized HRTFs measured with Head and Torso simulators (HATS) are used. HATS have constructed features of the head, pinna, and torso of an average human and use fixed microphones at the entrance or inside the ear canals to obtain the pressure response at the measuring points.
2.3.2 Binaural synthesis
If a sound is recorded at the ears of a person and then this recording is played back to that listener through headphones, a complete auditory experience will occur (Carline 1996). The same results can be achieved with the use of Binaural Synthesis. This technique is based on the idea that any sound source can be modelled simply by filtering dry signals with the left and right ear HRTFs corresponding to the desirable virtual source location (Figure 2.2). Thus, in theory, two audio channels are enough to provide a 3D sound experience.
Figure 2.2: Binaural synthesis
designed to take advantage of this principle. Some examples are virtual monitoring studios, virtual sound systems, and audiovisual interactive software. The quality of such a system is based on its directional and distance localisation performance, on the room model (how realistic it sounds), on the quality of the head tracking system and on how well it can work in real time.
2.4 Room Impulse Response and the importance of its anatomy
Impulse response is the pressure-time response function at the receiver position inside a room as a result of an impulse excitation (Figure 2.3).
Figure 2.3: Room Impulse Response (Red: direct sound, Blue: early reflections, Black: late reverberation)
The three main parts of the impulse response are:
The Direct sound: The direct sound dominates in the aspect of localisation of the source due to precedence effect.
• Precedence effect: When the same source arrives within 30ms delayed
relative to the direct sound due to a reflection off a room boundary only the direction of the direct sound is perceived (Wilslon K. 2005).
• Summing localisation: If a reflection arrives within 2ms after the direct sound,
it is grouped together with the direct sound and causes an image shift (the direction of the sound source is perceived somewhere between the early reflection and the direct sound) (Blauert 1976).
• If the initial time gap between the first reflection and the direct sound is long,
the reflection is separated from the direct sound and is perceived as an echo.
• If strong reflections arrive at short delay time (approximately 20ms), comb
filtering effect occurs which can cause coloration on the perceived sound
• Reflections arriving within 50ms to 100ms support the direct sound.
Reflections up to 50ms are important for speech intelligibly as they increase the amount of speech energy arriving at the listener. Reflections up to 80ms are important for music clarity.
• First order reflections are also important for the apparent source width and
listener envelopment.
Late reverberation: After approximately 80ms the reflection density increases rapidly forming the reverberation tail. Early energy decays quickly and late energy decays exponentially (Figure 2.3). Reverberation is frequency dependant due to absorption characteristics of the materials inside the room and air absorption. Therefore, different frequency bands have different decaying times. The late reverberation is spread uniformly around the room and in an ideal field it may be considered diffuse.
For the implementation of this project BRIRs were modelled. The anatomy of the BRIRs is exactly the same as the anatomy of the impulse responses. The only difference between them is that BRIRs are specifically made up of the head related impulse responses (HRIRs) combined with the room response.
2.6 Conclusion
In this section basic theory about head related transfer function, anatomy of room impulse responses, effect of early reflection and reverberation, binaural synthesis, were discussed.
3. Perception of distance
In this section the literature review related to the main subject of this dissertation is addressed. It covers the topics of distance perception and externalisation of sound sources in headphone listening.
3.1 Distance perception cues
3.1.1 Source level
The level of a sound source can provide a strong distance cue. The level of a source decreases with distance and thus sources with lower level tend to be perceived farther away than those with higher level (Mershon 1975; Gardner 1968). In free field environments and for distances above 1.0m, the sound level follows an inverse square law where the level of the sound source is proportional to 1/r (r: distance in metres). This implies a 6dB reduction for every doubling of distance (Equation 3.1). The above relationship is applicable only for outdoors sound propagation. Indoors, the reflected energy from the room boundaries affects the way sound pressure level decreases with distance in such a way that the inverse square relationship is no longer maintained. In this situation the perception of distance is no longer directly correlated with source level but with the D/R, which is discussed in subsection 3.1.2 below.
!!
=
20
×!"#
!"!
!!
!Equation 3.1: Inverse square law
Where:
r1: Distance (in metres) between receiver and first sound source r2: Distance (in metres) between receiver and second sound source
ΔL: Level difference between two identical sound sources at r2 and r1
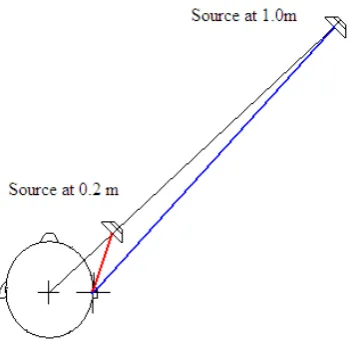
Figure 3.1 shows how the root mean square level (RMS) at the near ear varies with source distance and angle. The level at the near ear decreases faster at closer distances when the source is located at 90° compared to the source at 0°. For example, the level difference at the near ear between source at 0.2m and 1.0m is much larger when the source is located at 90° than at 0°. Since a very strong relative distance cue is different in the two angle orientations, distance perception becomes angle depended. It is also clear that the lines presenting the RMS level at the near ear over distance have the same slope above 1.0m, and level cue is no longer angle dependent.
[image:19.595.134.453.266.517.2]
Figure 3.1: RMS pressure at the near ear as a function of source distance (relative to the centre of the head) for sources at various directions in the horizontal plane.
Lines show predictions for a perfectly rigid, spherical head. Symbols show measured RMS pressure at the ear canal of a human subject.
(Shinn-Cunningham 2000b)
Humans are very sensitive to level differences. It is argued that the smallest perceptible distance change of a median plane source corresponds to the smallest perceptible change in the overall level of a broadband source which is 0.4dB (Strybel 1984).
alterations are not dependent on source displacement. As such, level is mainly reliable only as a relative cue for distance estimation unless the listener has a previous experience about the level of the source (Zahorik 2005; Mershon 1975).
In terms of perception, the sensation that humans perceive is loudness and not sound pressure level. Loudness is basically the level of sound as perceived by each individual. The loudness of a sound can depend on a variety of factors in addition to level differences caused by physical distance. Loudness does not vary linearly with level while it also depends on the spectrum and the duration of the sound (Howard and Angus 2009). Loudness of speech in reverberant environments is based both on the D/R (see subsection 3.2.2) as well as on the level of the direct and reverberant components (Warren 1973).
3.1.2 Reverberation and direct to reverberant ratio
In anechoic conditions, absolute distance judgments can be made for sources at distances up to 1.0m (section 3.1.3) and level can only serve as a relative distance cue. In natural (reverberant) conditions other cues are provided which underlie distance perception both for near and far sources.
Mershon (1975) investigated the effect of reverberation in distance perception. He conducted the experiment under anechoic and reverberant conditions. The source was a loudspeaker generating 5 seconds long white noise and the subjects were asked to judge the apparent distance of the different sound sources. The result shows that in reverberant environments judgments were much more accurate. This is also supported (for nearby sources) by Shinn-Cunningham (2005) and Santarelli (2001). Mershon concluded that reverberation may serve both as an absolute and as a relative distance cue.
source distance for distances above the critical distance (Critical distance is the distance from a source at which the direct and reverberant sound levels are equal). Therefore, in a room, the D/R is inversely proportional to the source distance and may be used as an absolute cue for distance perception. Reverberation is also produced in outdoor environments due to reflection from trees, buildings etc, so D/R can also vary in some outdoor conditions (Zahorik 2005).D/R may be considered an absolute cue, providing distance information with only one presentation of the sound source (Zahorik 2002a).
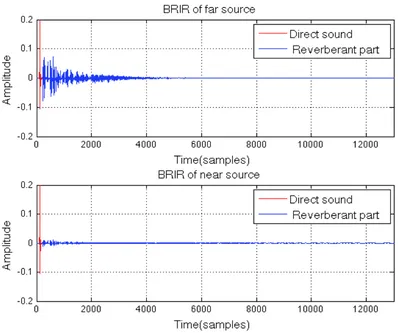
[image:21.595.100.498.258.591.2]
Figure 3.2: Impulse Reponses of a close and a far source. Demonstrating the D/R changes due to source location (‘Close source D/R’ > ‘Far source D/R’)
3ms). The levels of the sound sources were normalized across all cases, and subjects were informed to ignore small level differences and focus on the D/R discrimination. The main outcomes showed that the just noticeable differences (JDN) of D/R were 2dB to 3dB for D/R values of 0dB and 10dB and at least 5dB to 6dB for D/R values of 10dB and 20dB. Zahorik (2002c) performed similar experiments to Larsen's. However he differed in one respect: instead of scaling the direct part of the BRIRs in order to manipulate the D/R, he scaled the reverberant part. He found a constant JND of 5dB to 6dB for D/R values between 0dB and 10dB, which differed from Larsen's (2dB to 3dB). These findings are important because they show that D/R sensitivity is lower for sources with extreme D/R value (sources too far and too close respectively) and higher for sources with small D/R value (medium distances). Interestingly, Zahorik (2005) argues that the role of D/R is to provide absolute distance information rather than discriminations between relative distance changes, which are signalled with small changes in the amplitude where the human ear is very sensitive. He supports this argument of the D/R JDN he obtained in his earlier work (2002c). He further supports his argument on the large trial-to-trial variability on distance judgments observed in the listening test he performed previously (2002a) using virtual acoustics where D/R was the primary distance cue available.
The way our brain uses D/R information to localise distance is not very well understood yet. Possibly listeners are not able to separate direct and reverberant sound explicitly, so they cannot compute D/R directly (Kopčo 2011). However, there are other parameters that vary with D/R which are possibly used by the human brain to process information from the D/R. These parameters are the spectral variance, interaural coherence, interaural cross correlation (Larsen 2008) and early-to-late power ratio (Kopčo 2011).
3.1.3 Binaural cues
sources near the median plane. The level difference between the ears is increased dramatically across all frequencies (even at low frequencies) when the source is at a distance below 1.0m (Brungart 1999a; Kim 2001; Shinn-Cunningham 2000b). These near field ILD changes can provide absolute distance information for close sources (Kim 2001; Shinn-Cunningham 2000b). Fukuda (2003) examined the effect of ILD on relative distance perception via binaural reproduction. The virtual space was modelled with a very low reverberation time (0.1 seconds). The results indicate that the perceived relative distance of lateral angles (greater than 30°) can be altered with ILD manipulation. This shows that ILD can provide relative as well as absolute distance information in acoustic dead spaces in the near field and outside the median plane.
Figure 3.3: ILD increases at lateral angles when the same source is placed at distance closer to the head.
Interaural Time Differences (ITD), on the other hand, has been shown to be independent of distance changes (Brungart 1999a).
compared to the ILD cue that was mentioned before (Brungart 1999) and is thus considered less significant for distance perception.
[image:24.595.207.384.140.312.2]
Figure 3.4: Acoustic parallax. The angle of the source relative to the centre of the head remains the same for booth distances but the angle of the farther source
relative to the ipsilateral ear is increased
Reverberation has the effect of reducing the ILD at all frequencies (Ihlefeld 2004). Shinn-Cunningham (2000b) examined distance perception under reverberant and anechoic conditions for nearby sources. The sources were virtually synthesized with individual HRTFs and BRIRs. The main outcome from Shinn-Cunningham's experiment is that listeners based their judgment on reverberation and naïve listeners could not learn to use the ILD cue to localise distance even when reverberation was absent. This indicates that reverberation is a more robust cue than ILD for nearby sources.
Finally, Shinn-Cunningham (2000b, 2000c) argues that distance judgments are similarly good both under monaural and binaural conditions suggesting that binaural cues are not used for distance perception in echoic environments even for nearby sources. There is further evidence that binaural cues are not strong enough to be useful in D/R discrimination (Larsen 2008). Larsen mentions that this does not imply that distance perception is equally good via binaural and monaural listening.
3.1.4 Spectral changes due to source location
In natural environments the reflective surfaces and obstacles absorb the high frequencies more than the low frequencies. Additionally, when the source moves away from the listener, the proportion of reflected energy increases compared to the direct sound. By conflation, when the proportion of reflected energy increases (sound source is farther), the changes effected on the spectrum are more noticeable (Zahorik 2005). Also, for distances greater than 15m, low pass filtering occurs due to air absorption (Blauert 1976). Butler (1980) suggested that low pass filtered sounds are perceived farther away than high pass filtered. This difference is related to our lifetime auditory experience where air absorption decreases the high frequency spectrum of sound sources that are located at far distances. Thus, it is expected that manipulation of the high frequency spectral content of a source affects its distance perception.
Finally, it is important to note that the spectral changes discussed will be unable to provide distance localisation cues unless the listener has prior knowledge of the source characteristics (Zahorik 2005; Brungart 1998). They are thus considered as relative cues. This leads to the next topic, which relates to how familiar a certain source is to the listener.
3.1.5 Familiarity and learning
The learning factor is directly related to familiarity. Familiarity is the stored knowledge about the characteristics of sound sources (e.g. speech) and the acoustic conditions. Learning is the process during which the listeners familiarize themselves with the acoustic environment and stimulus conditions, in order to be able to localise accurately both distance and direction of the sound source.
In virtual systems learning seems to be an important non-acoustic cue and its absence degrades the performance quality of the systems (Cunningham B. 2003; Schoolmaster 2003a).
When a listener is exposed to an unfamiliar environment for the first time, without having any acoustic reference, he/she would find it very hard to judge the correct distance. However, once exposed to several different sounds with level differences, distance judgments become more accurate (Shinn-Cunningham B. 2003).
Distance perception in virtual systems is also improved with reverberation, but it can be enhanced even further with experience (Shinn-Cunningham 2000a; Devallez 2009). Schoolmaster (2003a, 2003b) performed experiments in order to investigate the effect of learning in distance perception under varying and constant room conditions. The results from his test suggest that if the room conditions are manipulated during the distance perception tests, the responses are less accurate; on the contrary, if the conditions are held constant, the responses are much more accurate. This indicates that listeners construct a "map" of distance based on recent experience (over the test session). However, in both cases (varying and constant) distance perception improved through experience.
3.1.7 Vision
The interaction between audio and visual has also been shown to affect auditory perception. In directional localisation, the direction of an auditory target is moved into the direction of the closer visual target for angular separations between the two of more than 30°. This effect is called vetriloquism effect (Gardner 1968). Similar effects have been reported in distance perception (Devalez 2009; Mershon 1980). There is also evidence that vision improves distance judgment accuracy and lowers judgment variability (Zahorik 2001).
Devalez (2008) studied the impact of visual cues in spatial impression. In a subjective test, Devalez used different types of samples which were convolved with dummy head BRIRs. The subjects were asked to adjust the D/R according to the visual cues. The D/R was manipulated by adjusting the first 2.5ms of the BRIR. Under all tested conditions, the subjects adjusted the D/R at greater values than what was originally measured.
Sound can also bias visual perception in the temporal domain. This effect is known as temporal ventriloquism (Morein-Zamir 2003).
3.1.8 Physical vs perceived distance
The distance of a sound source is much more difficult to be identified than its directional location. In many experiments it has been shown that there is no linear relationship between perceived distance and physical distance (Zahorik 2002a; 1997 Nielsen 1993; Mershon 1975)
is known as auditory horizon. An opposite effect exists where the distances are overestimated for physical distances very close to the listener (Zahorik 2002a, 2002d; Larsen 2008; Mershon 1975; Bronkhorst 1999; Békésy 1949). The underestimation of far physical distances and the overestimation of close physical distances is referred in the literature as specific distance tendency.
3.1.9 Individual HRTF and head tracking
Individualised HRTFs do not seem to affect distance perception for binaural systems, if reverberation cues are present (Zahorik 2000; Zahorik 2002b). Also, most of the research in the area of distance perception using virtual acoustics was implemented without allowing the subject to move their heads (Zahorik 2002a, 2000; Larsen 2008; Valente 2010; Kopčo 2011; Brugart 1999; Devalez 2008; Fukuda 2003). Simpson (1973) further supports that distance perception is not improved with head movements. In addition, Pelegrini (2001) argues that head-tracking is only necessary when non-individualised HRTFs are used. As such, it appears that there is a trade-off between the use of individual HRTFs against providing subjects with the ability of moving their heads in facilitating correct distance perception.
3.2 Externalisation
A common problem with binaural reproduction systems is the poor sound externalisation. A sound source is externalised when it is perceived outside the radius of the head (Blauert 1976; Begault 2000). If one source is more externalised than the other, it would mean that the virtual auditory event would be perceived farther from the head radius than the other. Thus, distance perception in binaural systems is intrinsically linked to the ability of externalising sound.
3.2.1 Early stages of inside head locatedness (IHL) research
effect; absence of the sound energy presented at the rest of the body besides ears; differences in the transfer characteristics between electrostatic transmission channels; overmodulation of the nervous system; and natural resonances of the headphones.
Green (1988) further suggested that human listeners have ‘pushbuttons’ in their head that detect the presence of headphones and automatically perceive images inside their heads.
3.2.2 Individual cues
Weinrich (1992) designed and tested a system that improves externalisation in a headphone stereophonic system using a cross-feed delay network. He concluded that the frequency range between 4kHz and 12kHz is essential for externalisation. Consequently by introducing individual cues in this frequency range, better externalisation can be achieved.
Individualised HRTFs seem to improve externalisation. Kim (2005) compared the performance of different HRTFs in binaural reproduction. The results for his subjective tests suggest that both non-individualised and individualised HRTFs can provide externalisation but the individualised one to a higher degree. This finding is also supported by Volk (2008). Although some research has been conducted, the effect of non-individualised HRTFs in externalisation is not yet well understood.
The amount of influence of individualised HRTFs on externalisation is highly dependent on the source signal. Begault (2000) investigated the effect of individualised HRTFs on the externalisation of a virtual speech source. The results from the subjective test showed that individualised HRTFs do not improve the localisation accuracy, externalisation and reversal rates. This outcome is also supported by Møller’s (1996) research, which states that individualised HRTFs do not improve localisation accuracy of speech signals. This probably occurs because the spectral energy of speech exists in the frequencies where ITD cue is dominant and pinna cues are very weak (Begault 2000).
3.2.3 Decorrelation of ear signals
Decorrelation of left and right ear signals is a very important factor that affects externalisation. Decorrelation in real life occurs due to the frequency dependent diffraction of the head, early reflections and reverberation (Kendall 1995). In the median plane, where the signals in both ears are very similar, decorrelation can be provided via head movements. Kendall (1995) described the design of decorrelation filters and implemented subjective tests to observe the effect of decorrelation in source externalisation. Some of the advantages of decorrelation filters were described as:
1. Elimination of colouring effects 2. Production of diffuse sound fields.
3. Production of enough externalisation in headphone playback. 4. Elimination of image shift.
5. Removal of Precedence effect.
Brookes T. (2005) studied the effect of left and right ear asymmetry in sound externalisation. This asymmetry decorrelates even further the signals arriving at left and right ears. Brookes used dummy head recordings made in a 250m2 concert hall for distances between 1.0m and 10m, and at 00 azimuth and elevation. The source signal was a 10 seconds long male speech and some percussive instruments. He made the recordings both with symmetric and non-symmetric pinnae. The subjective tests showed that asymmetric pinnae recordings provide significantly greater externalisation over symmetric pinnae recordings. Consequently he proposed slight modification of one of the HATS's pinnae before performing generic HRTFs or BRIRs measurements in order to produce this desirable asymmetry.
3.2.4 Head Tracking
can provide externalisation even with the pinna cue absent. Wersenyi (2008) performed subjective test with HRTFs of a good localiser and the result of the subjective test showed an improvement of approximately 30% on externalisation with the head tracking on.
3.2.5 Reverberation
Addition of reverberation improves externalisation and realism in headphone simulation significantly (Begault 2000, 1992; Durlach 1992; Shinn-Cunningham B. 2000a).
Völk F. (2009) examined the effect of the BRIR length in sound externalisation. He used a measured BRIR of a good localiser. The results suggest that high order reflections up to 25ms increase the perceived externalisation but reverb time over 100ms does not provide extra externalisation.
Finally the value of D/R, which is directly related to reverberation, also seems to be important in externalisation (Sakamoto 1975)
3.2.6 Headphone equalisation
Figure 3.5: Headphone Transfer Function of HD 800 measured with B&K 4100
In order to equalise the headphones, the output signal of the headphones has to be convolved with the inverse Headphone Transfer Function (HpTF).
The HpTF can be measured on a HATS or on an individual by inserting miniature microphones inside its ears. The HATS HpTF can produce artifacts because it will differ significantly from the individual’s HpTF. Variations in HpTF can lead to unwanted effects that can influence externalisation and localisation performance. Therefore, single HpTF is not a good solution (Hammershøi 2005; Griesinger D. 2008). Additionally the spectral differences on the individual HpTF due to the headphone fitting can create noticeable effects (Paquier 2010). In order to overcome this problem, technicians suggest measuring individual HpTF for different headphone fitting positions and then averaging them. Massiero (2011) proposed a robust headphone equalisation method that can minimize most of the problems of the previous equalisation methods.
equalisation is crucial for externalisation and that individual HRTFs are important for consistent distance perception. This result contrasts with Zahorik’s (2003) paper whose listening test results support that individualised HRTFs are unimportant for correct distance localisation (2) lateral angles are easier to externalise, which is also supported by Völk (2008).
Good externalisation without headphone equalisation has been achieved previously in distance perception tests under reverberant conditions (Zahorik 1997; Kopčo 2011).
3.2.7 Virtual vs Real source
Some researchers have defined externalisation, as a measure of how indistinguishable is a virtual from a real source. Hartman (1996) and Langendijk (2000) performed direct comparisons of virtual sources presented through headphones and real sources reproduced through loudspeakers. The drawback with this method is the interference of the sound wave generated from the loudspeaker and the earpad. A novel method to eliminate this effect has been proposed by Moore (2008). Moore used a DSP technique in order to make the headphones acoustically transparent so that the signal reaching the listener from the loudspeaker would sound as if the headphones were absent. The analysis of the results showed that headphone transparification works well for fixed listener position but the high frequencies are attenuated. Further work is needed in order to minimize this effect.
3.3 Conclusion
In this section the literature review related to the project is addressed. It covered distance perception and the cues that affect it, which is the main subject of this research project, as well as the topic of sound externalisation.
I) For distance perception the most important cues are:
D/R: The ratio between direct and reverberant energy is a strong absolute distance cue.
Binaural cues: ILD and acoustic parallax can provide absolute distance information for close distances (below 1.0m). However, when reverberation is present, subjects tend to rely on the D/R instead of the binaural cues.
Signal spectrum: Low frequency sounds are perceived farther away because they are associated with low frequency air absorption. This is a relative distance cue unless the listener has previous knowledge about the source spectrum.
Familiarity: Familiarity with the characteristics of the source can facilitate humans make better distance judgments.
Learning: After having been exposed to the new listening conditions for some time, listeners calibrate their perception to these new conditions and are able to make better distance judgments.
Vision: Improves accuracy and reduces the variability of the responses.
Individualised HRTFs, head tracking and headphone equalisation do not seem to be very important factors for distance perception under binaural reproduction through headphones, especially when the virtual environment is reverberant.
II) Externalisation of binaural reproduced sound sources can be improved with reverberation, decorrelation of left and right ear signal, headphone equalisation and head tracking. The effect of individualised HRTFs on externalisation is not yet fully understood. Better externalisation occurs at lateral angles.
4. Modelling and Measuring the BRIR
In this section the methods used for modelling and measuring BRIRs will be demonstrated.
4.1 Modelling of BRIR
The BRIR anatomy was described in section 2.4. The three parts of the response (Direct sound, early reflections, late reverberation) were modelled separately. Furthermore, the sound field in each ear was computed individually taking into account their different positions in space.
4.1.1 Design of the direct part
The KEMAR diffuse field equalised HRTF database was used for the BRIRs design (Gardner 1994). The interaural amplitude of the HRTF was corrected using Supper's (2010) method as follows. The HRTF database was measured at distance of 1.4m from the centre of head. When the loudspeaker moves around the listener, the distance between each ear and the loudspeaker changes, which results in a change of sound pressure level at each ear. Should this not be corrected, a distance related ILD cue (see subsection 3.1.3) for a source at 1.4m would remain in the response. Hence, this ILD was removed in order to re-introduce later the correct ILD depending on the new source location. The correction was implemented by calculating the distance between the loudspeaker and each of the ears for every measurement position of the HRTF database. Then according to the source position, the level at the near ear was decreased and the level at the far ear increased. The effective diameter of the head for this correction was assumed to be 21cm. This resulted in a maximum change in ILD (at 900 azimuth) of 1.3dB.
The ILD cue for every given source location can then be approximated by adjusting the signal level on the left and right ear correspondingly (Shinn-Cunningham 2000d), (Equation 4.1). This was applied in every modelled sound source by determining the ratio between the distance of right ear and virtual source (dright) over the distance
distance of the left ear (dleft) and the virtual source over the (dcentre). These ratios were
then multiplied by the right and left ear Head Related Impulse Responses respectively in order to model the distance related ILD. Changes were applied across all frequencies equally.
!"#$%&
!"#!!=
!
!"#!!!
!"#$%"×!"#"
!"#!!!"#$%&
!"#!!=
!
!!"#!
!"#$%"×!"#"
!"#$Equation 4.1: Direct sound modelling
Ideally, distance dependent HRTFs should have been used, as specific features of the HRTF related to distance change are neglected using the above correction (Spors 2011). However, the method used is considered a sufficient compromise since these features do not change dramatically for distances above 1.0m (Brungart 1999) and the nearest source modelled for this project is at 1.10m.
4.1.2 Design of the early reflections
Figure 4.1: Image source example
The method is adequate for wavelengths that are very small compared to the room surfaces (waves that "see" the room surfaces as infinite plates) as the behaviour of sound waves are modelled following the principle of light rays. Sound pressure is obtained by considering energy rays rather than complex pressure waves (Allen 1979; Kapralos B. 2006). Diffusion was ignored and reflections were modelled as ideal specular reflections. Diffraction effects and wave interference are also not considered by this method. As such, the image source method is not the most advanced method for reflections modelling. Other geometric techniques such as Ray Tracing, Beam Tracing or combinations of these methods can provide better predictions (Vorländer 2007). Despite these shortcomings, the method is here considered sufficient to represent sources in a room with no obstacles and at frequencies of interest in a simple and computational efficient way. The model used for this project was programmed in Matlab.
literature that the direction of reflections affects the perception of distance. This is also supported by the outcome of this research project.
An average absorption coefficient was used for all the walls of the modelled rooms and this absorption was the same for all the frequencies. The absorption values were taken from average published data (Cox 2009). Equation 4.2 demonstrates how the obtained image sources were processed.
!"#$%
!=
!
!!
!×
!"#"
!×
1
−
!
!"#$"
!"#$%
!=
!
!!
!×
!"#"
!×
1
−
!
!"#$"
Equation 4.2: Processing of image source
Where:
ImageL: Absorption coefficient of the room walls
ImageR: Order to the image source (how many times it has been reflected on the room boundaries)
rR: Left ear HRIR of the image source location rL: Right ear HRIR of the image source location IR: Distance between image source and left ear IL: Distance between image source and right ear HRIRR: Distance between source and left ear
HRIRL: Distance between source and right ear a: The image source arriving at the right ear order: The image source arriving at the left ear
4.1.3 Modelling reverberation
Menzer (2010) argues that late reverberation of BRIR can be modelled accurately by considering the time-frequency energy decay relief and frequency interaural coherence. In this BRIR model only the first factor was considered. The late reverberation was modelled using uncorrelated Gaussian noise for each ear, which was shaped using separate decaying functions for each octave band within the range 63Hz to 8kHz. The formula for designing the decaying function of the octave band was taken from Zahorik (2009) (Equation 4.3)
!
(
!
)
=
10
!!!!"!Equation 4.3: Octave band decay function
Where: t: time
T60: reverberation time of the octave band
The reverberation time of the octave bands can be estimated using Sabine's reverberation equation with published absorption coefficients at different octave bands or by estimating the reverberation time at each octave band via measured impulse responses.
Figure 4.3 provides an example of the modelled reverberation tail of each octave band. These octave bands are then added together in order to form the reverberation tail.
4.1.4 Combining Early Reflections and Reverberation
The method of combining early reflections and late reverberation was also taken from Zahorik (2009). The combination was performed by matching the RMS level of the
last 15ms of the early response of length Te (= 80ms) with the first 15ms of the
broadband reverberation tail. Then the first Te − 15ms of the late response were
removed and finally the responses were added together (Figure 2.3).
4.1.5 Code block diagram
4.2 Measurement of BRIR
Generic BRIRs were measured. These BRIRs were used to evaluate how well modelled BRIRs described in section 4.1 provide relative distance information in comparison to real BRIRs.
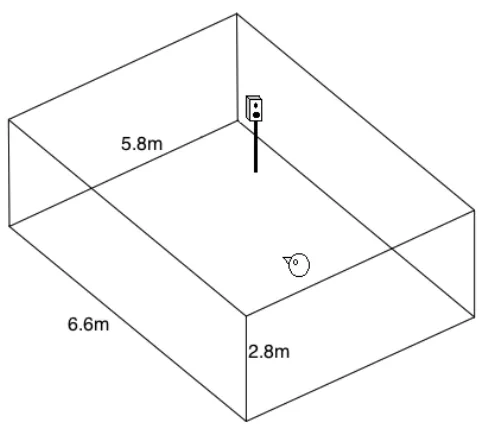
The measurements took place in the listening room at the University of Salford. The dimensions of the room are 6.6m × 5.8m × 2.8m, the background noise level is 5.7dBA, and the reverberation time is 0.27ms. This room is full of diffusers and meets the requirements of ITU-R BS 1116-1 for subjective assessments of small impairments in audio systems
The HATS was placed 5.0m away from the front wall, in the middle of the sidewalls and 1.30m above the floor (Figure 4.4). It was attached to a chair which was placed on a turntable with angles printed on.
[image:41.595.179.420.512.727.2]The speaker used for the measurements was a Genelec 1030A active near field monitor which was driven for all measurements with a fixed power level of 80dB SPL at 0.5m. Three measurements were performed at distances of 1.10m, 1.70m and 2.62m; all at 45°azimuth.
The HATS used for the measurements was a B&K 4128D which has fixed microphones in the blocked ear canals. The outputs of the microphones were connected to a Norsonic front-end type 336 preamp. The outputs of the preamp were sent into Fostex VC-8 DA/AD converter, which in turn were sent to PC-based Adobe Audition 2.0.
BRIRs were extracted with Aurora 4.2, a plug-in for Adobe Audition. The excitation signal for each measurement was a 15th order MLS (Vanderkooy 1994; Farina 2000) repeated 40 times in order to improve signal to noise ratio. D/A and A/D conversion was effected with 16-bit precision at a sampling frequency of 44.1 kHz.
DC components were present in the measurements but were removed using a tool of Aurora 4.2 which is called "remove DC components". This tool actually applies a high-pass filter on the sound file. Finally, the BRIRs were truncated in Matlab using a 13000 samples long rectangular window, resulting in responses 0.29 seconds long.
4.3 Match modelled BRIRs with Measured BRIRs
Modelled BRIRs were designed to match the BRIRs measured in the listening room (section 4.2) in order to test their perceptual differences in providing relative distance cues.
The first order reflections were modelled using the method described in 4.1.2 for a rectangular room with dimensions same as the listening room where the BRIRs were measured. The broadband absorption coefficient of the modelled listening room's walls was estimated from the mean reverberation time of the measured BRIRs octave bands.
Thus, the octave bands reverberation times of the measured BRIRs were used in Equation 4.3 to achieve similar energy decay relief between modelled and measured BRIRs.
The octave analysis worked well up to 8kHz and down to 63Hz, but outside this range the Butterworth filter used for the analysis became unstable. Therefore, octave bands below 63Hz and above 8kHz were excluded. Hence, modelled BRIRs have narrower frequency range.
The energy decay curves of the modelled and real listening room BRIRs differ slightly (graphs A.5, A.6 in Appendix A). Also, their frequency responses differ considerably for frequencies above 8kHz (Figure A.3, A.4). The reasons for these differences are: (1) The broadband absorption coefficient used for the first 80ms of the modelled BRIRs, which was constant across frequency and identical for all room boundaries; (2) All the reflections of the modelled BRIRs were ideal specular reflections which included no diffusion effects; (3) The measured BRIRs were measured with a different HATS, not the KEMAR which was used to model the early reflections and direct sound.
Finally, the near ear and far ear D/R of the modelled and measured BRIRs are not equal (Figure 4.5). However, the maximum difference in the near ear between modelled and measured is 1.4dB. This is smaller than the just noticeable difference, and in the far ear the difference is 2.1dB which is slighter higher than the JND (2dB). However, the far ear D/R is not a strong distance cue (Larsen 2008; Zahorik 2002c).
Figure 4.5: Direct-to-reverberant ratio of modelled and measured BRIRs for both near and far ear. The D/R was determined by performing time windowing in the BRIRs in order to separate the direct and the reverberant part. The direct part was selected as
the first 3ms of the BRIR and the reverberant part as the remainder. Finally, the power ratio between them was calculated.
4.4 Conclusion
In this section, the methods used for modelling and measuring BRIRs were discussed. The modelled BRIRs have some limitations in comparison to real ones. These are: 1) Reflections are idealised as specular, with no diffusion or diffraction effects; 2) All the walls have been modelled with the same broadband absorption coefficient; 3) Reverberation includes octave bands only up to 8kHz; 4) No interaural coherence matching was performed between measured and modelled BRIRs; 5) HRTFs were not fully distance dependent (only the ILD was manipulated).
1.10m 1.70m 2.62m
-5.1 -3.7 -2.8 -1.0 -0.5 1.6 5.3 6.7 8.7 10.1 12.6 D/ R (d B ) Distance (m)
D/R ratio of Modelled and Measured BRIR
5. Listening Tests Methodology
The section starts by reviewing typical methods used for testing auditory distance perception. Later the methodology used for the design and running of the subjective tests together with the design of the test stimuli and the experimental set up are discussed.
5.1 Review on relative and absolute distance judgments
Absolute distance judgment is referred to as the actual egocentric perceived distance of the sound source. For example, ‘source 1’ is perceived at 5.0m. The ‘relative’ term, on the other hand, means that there is some reference external to the listener that he/she can use to compare. Relative distance judgment between two sources may be:
• Categorical: Identifying which sound is closer or farther and not how much
closer or farther the sounds are. Therefore, the answer to such a listening test would be binary, ‘far’ or ‘close’, and no information regarding the absolute distance of the sources or the relative distance between them would be given.
• Continuous: Judging how much closer or farther the sound sources are. This
distance judgment can be either relative or absolute (relative judgment of egocentric distance). For example, if ‘sound 1’ was 2.0m away from the listener and ‘sound 2’ 3.0m away from the listener and the subject indicates that ‘sound 1’ is at 1.0m and ‘sound 2’ at 2.0m, he/she would be inaccurate in an absolute sense but accurate in a relative sense.
For continuous relative distance testing (how much closer or farther sounds are) Devalez (2008) used the MUSHRA method (Bech 2006) in order to perform direct comparison of all the sounds within a set. The subjects had to rate the relative distance of 8 different virtual sources at varying distances between 1.0m to 8.0m against a reference sound, on a scale ranging from 0 to 10 dimensionless units through steps of 0.1 units. Devalez suggests that this method can prevent the bias from learning effect and high variability of responses across trials that would occur if common evaluation methods such as the A/B comparison were used. Fukude (2003) (binaural reproduced sound sources) and Strybel (1984) (loudspeaker sources) conducted pairwise comparisons and asked subjects to judge which source was farther or closer. Zahorik (1997), carried out pairwise comparison of binaural reproduced sound sources using Thurstonian scaling. The main task was to indicate which sound of the pair appeared egocentrically closer.
5.2 Experimental Definitions
The experiment reported here was separated into three parts. In all parts, accuracy of relative distance perception (continuous relative distance judgment) was investigated. Absolute distance of sound source was not part of the experiment.
Listening test Part 1 objectives
1) To investigate accuracy in relative distance perception between two virtual sound sources in the absence of level differences between the sources.
2) To evaluate perceptual differences between modelled and measured BRIRs in providing relative distance cues.
Listening test Part 2 objectives
1) To investigate the effect of direct-to-reverberant ratio on distance perception.
2) To examine the effect of early reflection TOA on distance perception.
Listening test Part 3 objectives
Investigate relative distance perception with level differences between the virtual sound sources.
5.3 Design of the test stimuli
5.3.1 Source signal
(Figure 5.1). The source was always presented at 45° because lateral sources are externalised easier compared to frontal sources, especially when artificial HRTFs are
used (Völk 2008; Kim 2005). The results from this experiment might be less applicable to other types of source signals and angular locations because it is argued that information from each distance cue is processed in different ways depending on source direction and source signal (Zahorik 2002a). The source was chosen to be in the horizontal plane because ILD of lateral angles provides an extra absolute and relative distance cue. Also, externalisation is greater for sources outside the median plane (Volkl 2008; Kim 2005). Finally, the speech sample was selected to be in Italian, in order to ensure that subjects, mostly English speakers, would not focus on the semantic context but rather on the acoustic effects of the presented speech.
Figure 5.1: Spectrogram of anechoic Italian speech
5.3.2 Listening Tests: Part 1
the BRIRs at 1.10m. So by convolving the anechoic signal with the BRIR at 2.62m more energy (greater amplitude) will be added to the signal than when it is convolved with the BRIR for source at 1.10m. These amplitude differences had to be removed (Figure 5.2). The responses were thus normalised using the mean RMS level for the right ear signals. All the mean RMS amplitudes were matched to the lowest mean RMS amplitude of these signals. In order to keep the distance related interaural level differences unaffected, all the stimuli both left and right signals were multiplied by the same ratio. This ratio is the minimum mean RMS amplitude of all the right ear signals over the mean RMS amplitude of the right ear signal of each virtual source (see Equation 5.1 and Figure 5.3). Natural differences on the left ear signals, which occur due to the distance related ILD (Figure 3.3), were thus maintained.