International Journal of Emerging Technology and Advanced Engineering
Website: www.ijetae.com (ISSN 2250-2459,ISO 9001:2008 Certified Journal, Volume 5, Issue 5, May 2015)
448
Combined Transform domain Based Characterization of
Breast Tissues using Nearest Neighbor Classification
Techniques
B. N. Prathibha
1, T. Kavitha
21Assistant Professor, Department of Computer Science and Engineering-PG, National Engineering College, Kovilpatti, India
2
Assistant Professor, Department of Computer Science and Engineering, Regional center Anna University, Tirunelveli, India
Abstract –Mammography is a well established imaging technique for showing tissue abnormalities of breast and has been proven to reduce death rate for breast cancer in screened populations of women. The proposed method classifies the breast tissues into normal and abnormal by using Nearest neighbor (NN) classifiers in combined transform domain. The discrete wavelet transform features are extracted from cosine transformed domain. The method is tested on 216 mammogram images from the MIAS database. Experiments on Hybrid transform space shows its potential for accurate mammogram classification. Further, this paper justifies the classification correctness of NN classification techniques which is simple but exploiting the underlying density structure of the dataset. The study reveals the NN variants classification power when combined with cascaded transforms filters feature test.
Keywords – DWT, DCT, Mammograms, Nearest Neighbor Classifiers, Accuracy.
I. INTRODUCTION
Although many years of effort have been spent in improving surgical and radio therapeutic techniques, the mortality rate from breast cancer remains appalling. It is commonly conceded that early detection is the best means of reducing this mortality.
Fortunately, mammography has finally evolved as a means of achieving this purpose[1].
In addition to providing better images, the digital mammograms have resulted in significant reduction in radiation dose. With the importance of an emphasis on mammography in the role of early detection of breast cancer, it is of utmost importance that meticulous techniques be used. Factors that affect image quality include equipment, image-recording system, processing compression of the breast, and the technologist‟s skill in positioning the patient. The interpretation skills of the radiologist are limited by a suboptimal image. A poor quality image or poor positioning can account for many of the cancers missed by mammography. The Computer-Aided Detection (CAD) systems help radiologists in improving the quality of the image for visual representation. CAD‟s can also be used in place of a second reviewer, thus economically and technically it aids radiologists in giving accurate diagnostics.
II. RELATED WORK
Many studies have been made on breast cancer diagnosis based on digital mammograms. Most of these algorithms are concentrated on discrimination between, benign and malignant MCC or between benign and malignant masses and some on detection of MCC and masses or on shape analysis of MCC and masses. A few study on the classification of normal and abnormal mammograms, detection of architectural distortion and asymmetric density.
The Discrete Wavelet Transform (DWT) is used by Jianhua Yao et al. [2] for breast tumor analysis on Dynamic Contrast Enhanced Magnetic Resonance images. They obtain 0.989 and 0.984 area under the curve values for different training and testing datasets. The support vector machine is used as the classifier for breast tissue classification.
An evaluation on the performance of CAD systems is done by Sheila Timp et al. 3] with double reading on radiologist‟s diagnostics in classifying benign and malign masses. They conclude that CAD systems with temporal analysis have the potential to help radiologists in discriminating benign and malign masses. The curvelet transform is used as a feature extraction technique by Mohamed Meselhy Eltoukhy et al. [4] for breast cancer diagnosis in digital mammograms. The Euclidean distance is then used to construct a supervised classifier. The experimental results gave 98.59% classification accuracy rate, which indicate that curvelet transformation is a promising tool for analysis and classification of digital mammograms. The DCT features are used by Farag A. and Mashali S. [5] in order to discriminate normal from with microcalcification. Classification is done with a three-layer back propagation neural network.
International Journal of Emerging Technology and Advanced Engineering
Website: www.ijetae.com (ISSN 2250-2459,ISO 9001:2008 Certified Journal, Volume 5, Issue 5, May 2015)
449
DWT produces high frequency oscillatory artifacts along sharp edges as well as low frequency artifacts in region with no signals. DCT is efficient at capturing low frequency signals, also compensates for the low frequency artifacts of the wavelet transforms. Obviously the transforms combination compensates the drawbacks of each other and gives more preciseness in mammograms analysis [6]. Hence, the current system experiments on the coefficients space obtained by the combination of different DWT filters and DCT.Rest of the paper is divided into 3 sections, Section III discusses the methodology used in detail, section IV discusses the experimental resulsts and section V gives the conclusion.
III. PROPOSED METHODOLOGY
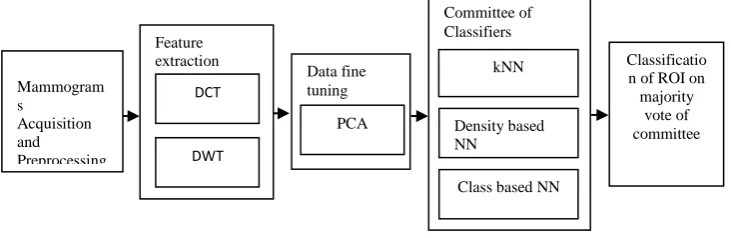
The proposed methodology studies the performance of dual transform features for breast tissues classification into normal and abnormal using Nearset Neighbor classifiers [7]. The classification method is an ensemble of the NN classification techniques, like kNN, density based NN and class based NN. The performance of individual filters in multi transform domain and their combinations, as well as the potentiality of each of NN classifiers and their combination is studied. The proposed
[image:2.595.114.480.297.416.2]method consists of five major steps, as shown in Figure 1.
A.Acquisition and Preprocessing
The mammography data is taken from the Mammographic Image Analysis society (MIAS) [13]. It contains 322 mammogram images of size 1024 × 1024 pixels, out of them 207 are normal and 115 are abnormal. Each file contains ground truth information about the abnormalities, i.e., type of cancer, severity of the diagnosis (Benign or Malign), center coordinates of location of the abnormality and radius of the circle enclosing the abnormality. The proposed method is implemented using MATLAB 10. A region of 32 × 32 has been cropped from each mammogram so that the abnormality is covered.
B.Feature Extraction
Before feature extraction the mammograms are contrast enhanced to improve the quality. Enhancement has the ability to make more visible unseen or barely seen features of a mammogram.
A generalization of Adaptive Histogram Equalization (AHE), contrast limiting AHE is used. It has more flexibility in choosing the slocal histogram mapping function. CLAHE operates on small regions in the image, called tiles, rather than the entire image. The contrast, especially in homogeneous areas, can be limited to avoid any noise amplification, which might be present in the image by selecting the suitable clipping level of the histogram. The clip level specifies the contrast enhancement limit, the higher value of clip level, more the contrast and vice versa.
The Discrete Cosine Transform (DCT) has strong capability to compress all energy of an image, hence one can often reconstruct a sequence very accurately from a few coefficients. The discrete cosine transform [10] of an N×N image, f(x, y) is defined in Eq. 1, and f(x,y) is the intensity of the pixel in row i and column j of original image f
N
v
y
N
u
x
y
x
f
v
C
u
C
v
u
F
N
x
2
1
2
cos
2
1
2
cos
,
,
) 1 (
0
1
where
N
v
C
u
C
1
, foru
,
v
0
,
N
v
C
u
C
2
, foru
,
v
1
,
2
,....
N
1
Mammograms Acquisition and Preprocessing
Feature extraction
DCT
DWT
Classificatio n of ROI on majority
vote of committee Committee of
Classifiers
kNN
Class based NN Density based NN
Data fine tuning
PCA
International Journal of Emerging Technology and Advanced Engineering
Website: www.ijetae.com (ISSN 2250-2459,ISO 9001:2008 Certified Journal, Volume 5, Issue 5, May 2015)
450
The discrete wavelet transform (DWT) highlights structural, geometrical and directional features of objects in an image. To compute wavelet transform[10] the original image is blurred by a low-pass convolution filter to get a low resolution image with loss of some information. A high-pass convolution filter is then applied on the original image and a “detail image” is obtained and added to the low resolution image to balance the loss of information. The convolution and decimation steps are computed recursively on the previously acquired low-resolution stream for the required decomposition level.C.Feature selection
The higher dimensional feature space may result in deterioration of the classifier performance hence a set of minimum number of features, with high discriminating power is selected. PCA is the commonly used statistical technique for dimensionality reduction, in the sense that it replaces a large set of observed variables with a smaller set of new variables in such a way that they highlight their similarities and differences..
D. Committee of NN classifiers and Classification
Classification is performed with supervised nearest neighbor (NN) classifier and its variants each of them is discussed as follows. The NN classifier is an intuitive and easy to learn statistical classifier. The group of these classifiers forms the committee. Each committee member has one vote for classification. The result of each member is dependent on three features discussed in section III. Subsequently, the majority vote is used as decision function of the committee.
IV.EXPERIMENTS AND RESULTS
MIAS database [8] has been used for experimental analysis. A database of 217 ROI extracted from 217 individual mammograms is used after case sample analysis. It consists of 109 normal and 108 abnormal mammograms.
The performance measures considered are based on the confusion matrix in Table 1. It gives True Positive (TP) the number of abnormal cases that are correctly classified as abnormal and True Negative (TN) the number of normal cases that are correctly classified as normal out of P, the number of abnormal cases and N, the number of normal cases. False Positive (FP) is the number of normal cases that are classified as abnormal and False Negative (FN) is the number of abnormal cases misclassified as normal. The positive predictive value (PPV) is calculated to know the probability that the ROI is actually abnormal when the classifier predicts it as abnormal: is found as TP / (TP + FP). Conversely, the false predictive value (FPV) refers to the probability that the ROI is actually normal when the classifier predicts it as normal: is found as TN / (TN + FN).
As per Table I. the classifier yields equal classification rate for normal and abnormal ROIs. The sensitivity or NPV, the fraction of normal cases that the classifier predicted as normal: is calculated as TP / N and the specificity or PPV, the fraction of abnormal cases that the classifier actually calls abnormal: is calculated as
TN / P. Jackknife test is employed to validate the classification power of the proposed method. Table II provides sensitivity, specificity and classification accuracy and MCC of each filter and their combination. The classification accuracy and MCC are calculated as in Eq. 4
P
N
TN
TP
Accuracy
4
TABLE II:
SUCCESSFUL CLASSIFICATION RATE OF DIFFERENT FILTERS AND THEIR COMBINATION
Feature Extraction Techniques
Sensitivity Specificity Accuracy MCC
DCT+DWT+Db2 82.09 85.45 84.11 0.68 DCT+DWT+Db4 88.46 83.64 85.98 0.72 DCT+DWT+Db8 76.92 75.73 76.77 0.59 Combination 94.49 94.44 94.47 0.88
TABLE I:
CONFUSION MATRIX
Predicted group
Actual group
PPV NPV
Abnormal Normal
Abnormal 102 (TP) 6(FN) 0.944 --
International Journal of Emerging Technology and Advanced Engineering
Website: www.ijetae.com (ISSN 2250-2459,ISO 9001:2008 Certified Journal, Volume 5, Issue 5, May 2015)
451
The MCC is considered along with accuracy since it considers failure classification rate along with successful classification rate where as accuracy considers only successful classification rate. The cascaded transforms features are experimented with different filters which makes Deubechies filter, the optimum. The deubechies filter is experimented with different values, for further for performance analysis. Each has its own merits and demerits, Specififcity of feature set combination DCT+DWT+Db2 is better comparing to its sensitivity. But DCT+DWT+Db4 gives specififcity higher than sensitivity, hence a combination of them is experimented along DCT+DWT+Db8.The combination gives equal classification rate 94% for both True Positive and True Negative classification. PCA, the feature selector, capturing the major uncertainties (or variations) in data yields 20 features for
classification among the feature set obtained by transforms combination with filters.
Figure 3 shows the effect of clip limit on accuracy, used in CLAHE on classification accuracy, as discussed in section 3.1. The value of the clip limit is varied from 0.01 to 0.05 and is observed that from 0.01 to 0.03 (lower contrast level) the accuracy is high and stable (94.39), from 0.04 (high contrast level) the accuracy drops (89.72).
The performance of different distance measures with respect to classification accuracy is depicted in Figure 4. The selection of distance metric purely depends on the nature of reference dataset. It is observed that for the current settings the city block distance measure performs the best (94.39) comparing with other distance measures like Bhattacharya (89.72), Euclidean distance (90.38), Jeffrey divergence distance (91.59) and chi square distance (90.65).
Table III shows the classification performance of NN classification techniques and their committee in terms of sensitivity, specificity and accuracy. Each of the classifier is tested with each filter individually and the test sample is assigned to the class with majority vote.
Among the classifiers, the kNN gives best result compared to dNN and cNN. The kNN is tried with various values and is found that for the value k=5 the classifier performance is optimum (90.65). The value of α in dNN is varied from 0 to 1; the classifier gave best classification rate (89.72) for the values of 0.3.
The class based NN classifier also gives good performance (87.85) among the classifiers considered. Finally the committee of the classifiers combines results of all classifiers as discussed in section II.
[image:4.595.376.487.168.246.2]The performance of the proposed method reaches high (94.39) with overall combination of the classifiers by compensating the drawbacks of the one another. Figures 5 show the smoothing effect of bandwidth parameter „h‟ on classification accuracy. The value of h (Eq. 3) has a fair impact on the classification accuracy; it is varied from 0.1 to 1.
Figure 3 Effect of clip limit on accuray 0.06 0.05 0.04 0.03 0.02 0.01 86 88 90 92 94 96
Clip limit
A
c
c
u
r
ac
y
Bhatta Euclid City Jeffrey ChiSq 86
88 90 92 94 96
A
c
c
u
r
ac
y
Figure 4 Effect of distance measures on accuracy
TABLE III:THE CLASSIFIERS PERFORMANCE
Classifiers Sensitivity Specificity Accuracy MCC
kNN (k=5) 94.23 87.27 90.65 0.82 dNN (α=0.3) 92.31 87.27 89.72 0.80 cNN 90.38 85.45 87.85 0.76 Committee
International Journal of Emerging Technology and Advanced Engineering
Website: www.ijetae.com (ISSN 2250-2459,ISO 9001:2008 Certified Journal, Volume 5, Issue 5, May 2015)
452
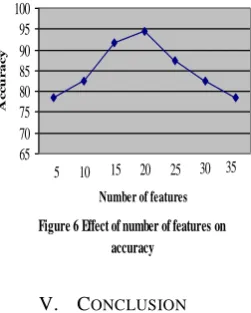
The classification accuracy reaches high for the values of h=0.6. The value of „h‟ depends on the nature of sample set and there exists is no technique to calculate the band width parameter „h‟ directly, hence the optimal value for „h‟ is selected through cross validation.The number of features „D‟ (Eq. 3) used for classification also has great impact on classification accuracy. The variance in classification accuracy for different number of features is illustrated in Figure 6. The number of features used is experimented from 5 to 35. The accuracy of the classifier increases as number of features increases reaches a peak and then begins to decrease. The classifier gives its best accuracy for a total of 20 features.
V. CONCLUSION
The proposed method classifies normal and abnormal mammograms in hybrid transform domain, using nearest neighbor classification techniques.
In the current experiments, DCT emerged as the best discriminator when combined with wavelet transformations. Different DWT with Deubechies filters coefficients and DCT coefficients yields better results. The variants of nearest neighbor classifier techniqes used gives sensitivity oriented partial results, the overall combination also.
The combined transform space has shown a great potential for interpreting useful diagnostic information from the mammograms, more accurately using simple, yet powerful nearest neighbor classifiers.
REFERENCES
[1] American Cancer Society, Inc. Cancer Facts and Figures 2003, Atalnta: ACS, 2003
[2] Jianhua Yao, Jeremy Chen, and Catherine Chow. “Breast tumor analysis in DCE MRI using texture features and wavelet transforms,” IEEE Transactions of Selected Topics in Signal Processing, vol. 3, No.1, pp 94–100, Feb 2009.
[3] Sheila Timp, Celia Varela, and Nico Karssemeijer, “Computer-Aided Diagnosis With Temporal Analysis to Improve Radiologists‟ Interpretation of Mammographic Mass Lesions,” IEEE transactions on information technology in biomedicine, VOL. 7, NO. 4, 2010.
[4] Mohamed Meselhy Eltoukhy, Ibrahima Faye, Brahim Belhaouari Samir, “Breast cancer diagnosis in digital mammogram using multiscale curvelet Transform.” Computerized Medical Imaging and Graphics 34 (2010) 269–276.
[5] Farag, A. Mashali, S. “DCT based features for the detection of micro calcifications in digital mammograms,” IEEE International Symposium on Micro-NanoMechatronics and Human Science, 2003.
[6] B.N.Prathibha and V.Sadasivam, “Characterization of Breast Tissues in combined transforms domain using Support Vector Machines”, ICTACT Journal on Image and Video Processing, Aug. 2011, Issue 1, Vol. 2, ISSN:0976-9102 (Online), PP.254-257 [7] B.N.Prathibha and V.Sadasivam, “Multi-Resolution Texture Analysis of Mammograms using Nearest neighbor classification techniques ”, in International Journal of Information Acquisition (IJIA), World Scientific,July 2010, No. 2,Vol. 7, PP.109-118. [8] http://peipa.essex.ac.uk/ipa/pix/mias/
[9] Gonzalez, Woods, and Eddins , Digital Image Processing Using MATLAB , Prentice Hall, 3rd edition, 2004
[image:5.595.98.230.200.312.2][10] S Mallat. “A theory for multiresolution signal decomposition: The wavelet representation,” IEEE Intelligence. Vol 11, no 7, Jul. 1989, pp 674–693.
Figure 5 Effect of smoothing parameter on accuracy
1.0 0.8 0.6 0.4 0.2 86 88 90 92 94 96
Smoothing Parameter
A
c
c
u
r
a
c
y
Figure 6 Effect of number of features on accuracy
30 25 20 15 10
5 35
65 70 75 80 85 90 95 100
Number of features
A
c
c
u
r
ac
[image:5.595.102.228.429.586.2]