International Journal of Emerging Technology and Advanced Engineering
Website: www.ijetae.com (ISSN 2250-2459, ISO 9001:2008 Certified Journal, Volume 5, Issue 3, March 2015)
580
Antecedents of Quality Management System and Practices in
Construction Works of Metro Rail Project and Managers
Satisfaction
Priyanka Prabhakaran
1, Dr. S. Anandakumar
2, Dr.V. Krishnamoorthy
3 1Final Year M. E. Construction Engineering Management, Kongu Engineering College, Perundurai, India 2Professor-Department of Civil Engineering, Kongu Engineering College, Perundurai, India
3Assistant Professor, School of Management Studies, Kongu Engineering College, Perundurai, India
Abstract - The purpose of the study is to examine the effect of quality management practices in the construction of metro rail project and managers satisfaction. It also aims to compare a multiple regression among various antecedents of quality management practices and managers satisfaction. A cross sectional research on engineers was made through questionnaire method and analyzed using SPSS software. The population of study consists of manager’s views on quality management practices in Tamilnadu. The study was conducted during the period of September 2014 to February 2015.This study identified ten dimensions of quality management practices such as execution difficulties, material specification’s, price hike of materials, replacement methods, design requirements, safety aspects, structural resistance, onsite-efficiency, manpower & work time, satisfactory outcome . Furthermore the study also confirmed that there is significant impact on execution difficulties, material specification’s, price hike of materials, replacement methods, design requirements, safety aspects, structural resistance, onsite-efficiency, manpower & work time, satisfactory outcome. The findings of the study may help the policy makers regarding quality management practices in the construction works of metro rail project.
Keywords-- Quality management, Metro rail project, Construction quality, Highly viewed variables, Manager’s satisfaction
I. INTRODUCTION
The ever growing vehicular and passenger demands coupled with constraints on capacity augmentation of the existing network have resulted in a chaotic condition during peak hours of the day lead to the advancement in construction of metro rail (CMRL 2014). Metro has emerged as top with customer satisfaction in the surveys carried out by Translink (David Pollit 2010). Metro is addressed as an international term under the 12th five year plan covering extensive cities (Paulose. N. kuriakose et.al., 2013).
Confining the area of study to the airport station at Chennai that is connecting on Chennai international airport near Phase I of the project, which consists of two corridors covering a length of 45.1 km is under construction.
Metro carries 2.3 million passengers a day making it one of the most densely utilized track and also responsible for the residential development that has been a part of the rail infra works(Megan Walters 1999).Metro Rail system is recognized as modern, reliable, safe and environment mode of transport system with Lowest carbon emission among various modes of mass transport providing very high passenger capacity using clean technology and is energy efficient with lesser noise level and ensuring enhanced mobility and reduces congestion on roads. Mandate knowledge of crisis management is vital to operators of the public transport system with key factors to ensure safe, comfortable and reliable driving (C. F. Cheung et.al., 2007).
International Journal of Emerging Technology and Advanced Engineering
Website: www.ijetae.com (ISSN 2250-2459, ISO 9001:2008 Certified Journal, Volume 5, Issue 3, March 2015)
581
II. LITERATURE REVIEW
Chan et.al.,(1998) studied about migration of the suburban areas population leads to the increase in the demand of the public transportation. The recent improvement was electrification that took place in 1983. The author thus found out that modernization has increased its carrying capacity and efficiency and the passenger journey grew exponentially after the electrification. Before electrification the passenger journey was less than 5.5 percent per annum.Now it has shoot up to an average annual growth of 15 percent on improving the service quality .C.F.Cheung et.al.,(2007) suggested that a systematic approach for knowledge auditing composed number of stages that focuses the overall framework and trial successfully implemented in a railway company for better management that allows the organization to reveal the KM-knowledge management needs ,strengths,weakness,opportunities,threats and risks. Railway is an effective mass transportation of passengers that leads to huge disasters if met with any accidents. The author came out with a solution that mandate knowledge of crisis management is vital to operators of the public transport company with key factors to ensure safe, comfortable and reliable riding.
Christer Strandberg et.al., (2012) explored the possible usefulness in analyzing how service quality is perceived by customers. Customer perception of service quality is emphasized as a key to customer satisfaction. The model assumed that perceived service quality is a matter of gaps between customer expectations and perceptions. David Pollit (2009)revealed that rail track had been a successful company in its first year after British rail privatization things had started go wrong that led to Ladbroke groove rail crash that led to billions of pounds invested in safety systems that finally led to rocketing costs. Thus Network rail formed partnership with the Warwick university college, London to deliver Msc in project management that provides 20 percent focus on rail industry. His study also indicates that metro has emerged as top with customer satisfaction in the surveys carried out by translink .. Thus Metro‟s service standing has risen by 12 points with an increase of 2 percent passenger numbers even in recession.
Emilio Esposi (2009) studied the research gap by representation of the lack of analysis of industry‟s specific factors affects the customer, supplier relationships and the entire supply chain in the railway manufacturing industry by providing an interpretative framework.
G.Shainesh (2012) investigated how empirically the underlying systems are validated by which consumers develop trust in the service provider and investigate the impact of consumer‟s perceptions of trustworthiness and trust on their loyalty intentions. He also found that service quality and sacrifice affect satisfaction and value that in turn determines loyalty dimensions. Ji-Tsung Ben wu (2009) focussed on high customer retention and maintaining long term relationship and also found that the company will use their profiles to provide customized goods will also lead users to raise their perception of quality.
Megan Walters (1999) investigated ina project that is undertaken with regard to the Mass Transit Railway corporation that runs an underground system. The Metro carries 2.3 million passengers a day making it one of the most densely utilized railway tracks per kilometer in the work. Metro is responsible for the residential development that has developed as a part of the railway infra works. Noel.y.m.Siu et.al.,(2001) – suggested thatdelivery of high service quality can be achieved mainly in six dimensions as personal interaction policy, physical appearance, promises, problem solving and convenience. Among these dimensions the physical appearance and policy have greatest impact on overall service quality and on future consumption. It is addressed that service quality is a global judgment or attitude relating to the overall excellence or superiority of service that involves customer expectation with actual service performance.
International Journal of Emerging Technology and Advanced Engineering
Website: www.ijetae.com (ISSN 2250-2459, ISO 9001:2008 Certified Journal, Volume 5, Issue 3, March 2015)
582
Paulose .n.kuriakose et.al.,(2013)states thatgovernment of India introduced a National urban transport policy (NUTP) in 2006 to co-ordinate urban transport development in India. The author thus found that Metro rail has been found to be so successful under the (ppp) public private partnership. Philip shum (2008) studied the commitment of employee has been operationalized as a three dimensional construct reflecting their psychological states.Robert.Y.Cavana et.al.,(2007) studied that dimensions are measured to check out the different “Zones of tolerance” identifying the areas of quality short fall and managing quality. The extension of an existing 3 column format SERVQUAL instrument to evaluate passenger rail service quality was established. The three column instrument SERVQUAL is extended to evaluate the rail services. Suman Gupta et.al.,(2003)investigated and found that providing excellent service quality and high customer satisfaction are the challenges faced by a service provider and therefore the quality of the service provided is assessed and improved from the viewpoint of the customer. The service expectation of the passengers may differ from the original once thus creating a sense of dissatisfaction. A product has the best quality when it meets requirements and that it suffers a loss of quality.
Thomas Ahren & Aditya Parida (2009) made an attempt to analyze the infrastructure performance to propose an approach to measuring overall railway infrastructure effectiveness(ORIE).This measure the extent to which the railway infrastructure manages to deliver performance indicator that provides important input for effective decision making, ORIE effectiveness is adjusted to meet specific needs of the railway infrastructure system.ORIE is considered to be the key performance indicator for railway infrastructure.
III. RESEARCH GAP
Although several studies have been conducted with regard to quality management practices in the construction works of metro rail project, most of the studies have been conducted in western perspective. Only few studies have been conducted in Indian context. Therefore the researcher would like to fill the gap by way of studying the employee‟s views on quality management practices.
IV. PROJECT RESEARCH MODEL
International Journal of Emerging Technology and Advanced Engineering
Website: www.ijetae.com (ISSN 2250-2459, ISO 9001:2008 Certified Journal, Volume 5, Issue 3, March 2015)
[image:4.612.84.522.135.405.2]583
Fig. 1 Project Research Model
V. OBJECTIVES
This study is confined with the following objectives:
1.To identify the various antecedents of quality management practices in construction works of metro rail project.
2.To examine the highly viewed factors of quality management in the construction of metro rail works among the managers.
3. To measure the impact of quality management practices and manager satisfaction.
International Journal of Emerging Technology and Advanced Engineering
Website: www.ijetae.com (ISSN 2250-2459, ISO 9001:2008 Certified Journal, Volume 5, Issue 3, March 2015)
584
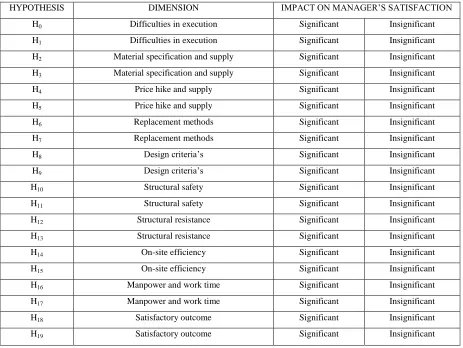
[image:5.612.76.539.173.521.2]VI. PROPOSED HYPOTHESIS
Table 1 Proposed Hypothesis Table
HYPOTHESIS DIMENSION IMPACT ON MANAGER‟S SATISFACTION
H0 Difficulties in execution Significant Insignificant
H1 Difficulties in execution Significant Insignificant
H2 Material specification and supply Significant Insignificant
H3 Material specification and supply Significant Insignificant
H4 Price hike and supply Significant Insignificant
H5 Price hike and supply Significant Insignificant
H6 Replacement methods Significant Insignificant
H7 Replacement methods Significant Insignificant
H8 Design criteria‟s Significant Insignificant
H9 Design criteria‟s Significant Insignificant
H10 Structural safety Significant Insignificant
H11 Structural safety Significant Insignificant
H12 Structural resistance Significant Insignificant
H13 Structural resistance Significant Insignificant
H14 On-site efficiency Significant Insignificant
H15 On-site efficiency Significant Insignificant
H16 Manpower and work time Significant Insignificant
H17 Manpower and work time Significant Insignificant
H18 Satisfactory outcome Significant Insignificant
H19 Satisfactory outcome Significant Insignificant
VII. METHODOLOGY
A. Scope
The scope of the study is confined only to the manager‟s views on quality management practices in Tamilnadu.
B. Period of study
The period of study was conducted during the period of September 2014 to February 2015.
C. Data collection methods
Primary data collection was done through questionnaire method. Secondary data collection was done by JOT form method. The first part of the questionnaire consists of the demographic profile of the respondent.
The second part of the questionnaire was relating to their experience and knowledge about the works on-process in site. The third part of the questionnaire points to the satisfaction level of the work done by the employees.
D. Construct development
International Journal of Emerging Technology and Advanced Engineering
Website: www.ijetae.com (ISSN 2250-2459, ISO 9001:2008 Certified Journal, Volume 5, Issue 3, March 2015)
585
E. Descriptive statistics
The demographic profile in the questionnaire features the experience level of the respondent, their salary level, their level of designation in the department they are working in. The total survey was conducted in 200 out of whom only 140 questionnaires could be collected. The response rate of the survey was 70 percent. Among the survey conducted 7 were deputy manager‟s, 24 were structural engineers, 9 were billing engineers, 14 were safety officer‟s, 30 were planning engineer‟s, 37 were site engineer‟s, 9 were chief engineer‟s, and 10 were assistant engineer‟s.
VIII. ANALYSIS AND DISCUSSION
A. Measure construction
One of the objectives of the research was to construct a scale that measures the quality management system of metro rail construction works
B. Specification of domain and generation of sample items.
In this step the domain of interest i.e.”Quality management in construction of metro rail project” was clarified and a total of 29 items were generated. Literature review and discussions with experts and academics of the metro management team were carried out. Moreover the content analysis was carried out by the members of the metro research team. After the content analysis and careful editing of the initial 29 items were ended up with 25 sentences.
C. First data collection and measure purification.
The items were measured on a five point Likert scale and were included in the questionnaire collected by personal interviews and through the site engineer‟s involved. Data collection is used in order to purify the measure. To establish internal consistency, cronbach‟s alpha value for reliability was calculated. All values were above 0.60 which may be considered as reliable.
D. Reliability analysis.
There is a number of different methods towards assessing reliability of a scale. In this study the method employed is cronbach‟s reliability.
Cronbach‟s α is the most commonly used procedure to estimate reliability. It is highly accurate and has the advantage of only requiring a single application of the scale. Hence cronbach‟s α was obtained and found to be of adequate magnitude.
E. Determinants for a successful quality management implementation
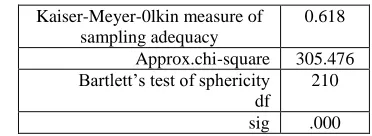
[image:6.612.347.533.327.395.2]In order to identify some broad determinants of quality management system implementation success, factor analysis was utilized on 25 variables created as mentioned previously. Kaiser-Meyer-Olkin measure for sampling adequacy was of an acceptable magnitude (KMO 0.618). Moreover, Bartlett‟s sphericity test gave a significance level of 0.000.
Table 2 Kmo And Bartlett’s Test
Kaiser-Meyer-0lkin measure of sampling adequacy
0.618 Approx.chi-square 305.476
Bartlett‟s test of sphericity df
210 sig .000
Initially all the 25 variables were used. After rejecting those items that have insufficient loadings, we deduced to ten factors. Factor analysis converged after ten iterations. The identified factors explain 66.542 percent of total variance.
The factors are names as follows:
International Journal of Emerging Technology and Advanced Engineering
Website: www.ijetae.com (ISSN 2250-2459, ISO 9001:2008 Certified Journal, Volume 5, Issue 3, March 2015)
[image:7.612.64.551.158.697.2]586
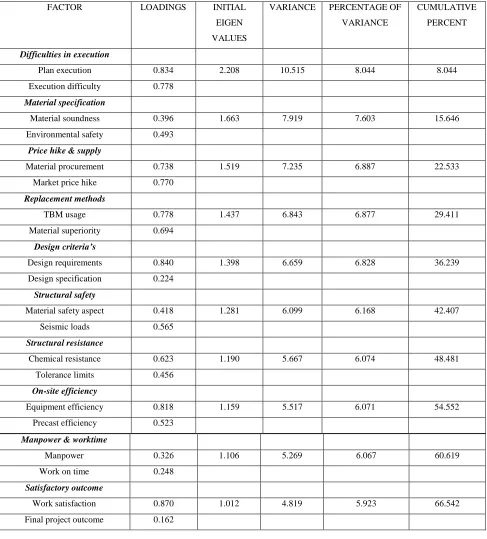
Table 3
antecedents Of Quality Management Practices In The Construction Of Metro Rail Works And Manager’s Satisfaction
FACTOR LOADINGS INITIAL
EIGEN VALUES
VARIANCE PERCENTAGE OF
VARIANCE
CUMULATIVE PERCENT
Difficulties in execution
Plan execution 0.834 2.208 10.515 8.044 8.044
Execution difficulty 0.778
Material specification
Material soundness 0.396 1.663 7.919 7.603 15.646
Environmental safety 0.493
Price hike & supply
Material procurement 0.738 1.519 7.235 6.887 22.533
Market price hike 0.770
Replacement methods
TBM usage 0.778 1.437 6.843 6.877 29.411
Material superiority 0.694
Design criteria’s
Design requirements 0.840 1.398 6.659 6.828 36.239
Design specification 0.224
Structural safety
Material safety aspect 0.418 1.281 6.099 6.168 42.407
Seismic loads 0.565
Structural resistance
Chemical resistance 0.623 1.190 5.667 6.074 48.481
Tolerance limits 0.456
On-site efficiency
Equipment efficiency 0.818 1.159 5.517 6.071 54.552
Precast efficiency 0.523
Manpower & worktime
Manpower 0.326 1.106 5.269 6.067 60.619
Work on time 0.248
Satisfactory outcome
Work satisfaction 0.870 1.012 4.819 5.923 66.542
International Journal of Emerging Technology and Advanced Engineering
Website: www.ijetae.com (ISSN 2250-2459, ISO 9001:2008 Certified Journal, Volume 5, Issue 3, March 2015)
587
The first factor labeled “difficulties in execution “includes aspects of difficulties endured during execution, planning difficulties. It should be noted that providing amenities enhances the employee relationship indirectly to the work. This factor emphasis more on the new expectation with changing mindset and expectation of the customer (Davit Pollit 2010)The second factor labeled “material specification” consists of notions like material soundness, environmental safety. In face of delivery of high service quality that can be achieved mainly in six dimensions as personal interaction policy, physical appearance, promises, problem solving and convenience. Among these dimensions the physical appearance and policy have greatest impact on overall service quality and on future consumption
(Noel.y.m.Siu et.al., 2001).Thus service quality is a global judgment or attitude relating to the overall excellence or superiority of service that involves customer expectation with actual service performance.
The third factor labeled “price hike & supply” includes the critical areas like material procurement and sudden rise in price of materials. Site conditions are vital to successful in implementation of construction work as it is well known in literature (Robert.Y.Cavana et.al., 2007).The different spheres of work may be limited to different zones of tolerance in accordance with the site condition. Therefore a the three column format SERVQUAL is the latest development used by the managers for diagnostic purposes and that which extends to 5 dimensional SERVQUAL instrument to measure the quality in industry. Service quality is divided into direct and indirect category. User category of speed, reliability, comfort, convenience, safety, special services and the non user category that includes efficiency, pollution and demand with attributes of efficiency and effectiveness. The three column instrument SERVQUAL is extended to evaluate the rail services.
The fourth factor labeled “Replacement methods” includes the provision of usage of tunnel boring machine (TBM) and superiority of new over existing materials. Risks at the terminal was reduced by establishing an existing relationship between fire risk, people and fire safety management by use of robust and quantifiable tool for safety at the passenger terminals (Derek.F.Howarth et.al., 1991).
The fifth factor labeled “design criteria‟s” includes the requirements needed for the required design to be carried out and also design specifications
The sixth factor labeled “structural safety” includes factors like the safety that a material is endured with and their withstanding capability in the seismic zone.
The seventh factor labeled “structural resistance” includes highly sensitive areas i.e. the ability of the materials used in the building to withstand the chemicals and their limits of tolerance.
The eighth factor labeled “on-site efficiency” includes the efficiency of the equipments working in the site and also the efficiency of the structures that are fabricated or done by adopting precast methods. The nineth factor labeled “manpower and worktime” includes the workforce in the site and how far the works were done within the scheduled time.
The tenth factor labeled “satisfactory outcome” includes the own level of satisfaction of the manager‟s and how would the final outcome of the project reflect on the society.
Providing excellent service quality and high customer satisfaction are the challenges faced by a service provider and therefore the quality of the service provided is assessed and improved from the viewpoint of the customer (Suman Gupta et.al., 2003). Variety of passengers requires different types of services having different priorities and different attributes of service quality were noted at the station. The service expectation of the passengers may differ from the original once thus creating a sense of dissatisfaction. Service and facilities meeting both physical and functional requirements that does not include behavioral issues like customer friendliness, dress code, managerial issues such as timely running of trains. Selected attributes are accessed such as accessibility, extend of waiting, information availability, passenger amenities, security, and travel associated facilities.
IX. HYPOTHESIS TESTING OF PROPOSED MODEL
International Journal of Emerging Technology and Advanced Engineering
Website: www.ijetae.com (ISSN 2250-2459, ISO 9001:2008 Certified Journal, Volume 5, Issue 3, March 2015)
[image:9.612.74.539.157.472.2]588
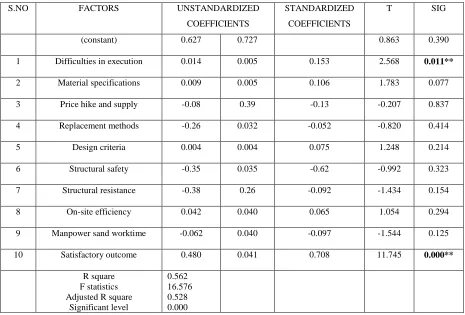
Table 4
Impact Of Different Dimensions Of Quality Management And Manager’s Satisfaction In The Construction Of Metro Rail Project
S.NO FACTORS UNSTANDARDIZED
COEFFICIENTS
STANDARDIZED COEFFICIENTS
T SIG
(constant) 0.627 0.727 0.863 0.390
1 Difficulties in execution 0.014 0.005 0.153 2.568 0.011**
2 Material specifications 0.009 0.005 0.106 1.783 0.077
3 Price hike and supply -0.08 0.39 -0.13 -0.207 0.837
4 Replacement methods -0.26 0.032 -0.052 -0.820 0.414
5 Design criteria 0.004 0.004 0.075 1.248 0.214
6 Structural safety -0.35 0.035 -0.62 -0.992 0.323
7 Structural resistance -0.38 0.26 -0.092 -1.434 0.154
8 On-site efficiency 0.042 0.040 0.065 1.054 0.294
9 Manpower sand worktime -0.062 0.040 -0.097 -1.544 0.125
10 Satisfactory outcome 0.480 0.041 0.708 11.745 0.000**
R square F statistics Adjusted R square
Significant level
0.562 16.576 0.528 0.000
**Significant at 5 percent level
X. ASSOCIATION BETWEEN PROFILE OF RESPONDENT AND
THEIR PERCEPTION ON QUALITY MANAGEMENT PRACTICES
The dimensions corresponding to f-statistics are:
(1) Execution difficulties (2) Material specifications (3) Price hike & supply
International Journal of Emerging Technology and Advanced Engineering
Website: www.ijetae.com (ISSN 2250-2459, ISO 9001:2008 Certified Journal, Volume 5, Issue 3, March 2015)
[image:10.612.47.565.157.275.2]589
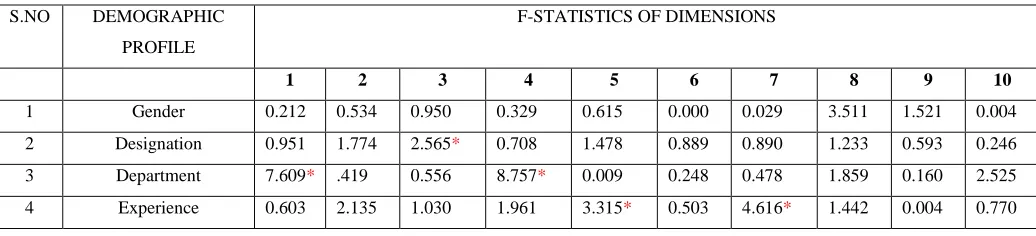
Table 5
Association Between Demographic Profile And Their Perceptions On Quality Management
S.NO DEMOGRAPHIC
PROFILE
F-STATISTICS OF DIMENSIONS
1 2 3 4 5 6 7 8 9 10
1 Gender 0.212 0.534 0.950 0.329 0.615 0.000 0.029 3.511 1.521 0.004
2 Designation 0.951 1.774 2.565* 0.708 1.478 0.889 0.890 1.233 0.593 0.246
3 Department 7.609* .419 0.556 8.757* 0.009 0.248 0.478 1.859 0.160 2.525
4 Experience 0.603 2.135 1.030 1.961 3.315* 0.503 4.616* 1.442 0.004 0.770
*significant at 5% level
Regarding the perception of execution difficulties, price hike and supply, replacement methods, design criteria, structural resistance that are significantly associating profile variables are gender, designation, department, experience. Since their respective “F” statistics are significant at 5% level.
XI. CONCLUSION
This study identified ten dimensions of quality management practices. These are the ten dimensions- execution difficulties, material specification‟s, price hike of materials, replacement methods, design requirements, safety aspects, structural resistance, onsite-efficiency, manpower & work time, satisfactory outcome. Based on factor analysis classification multiple regressions have been administered. The results of different dimensions of quality management practices in the construction of metro rail project indicates that R square = 0.562. This indicates that percent of the variance in different dimensions of quality management practices is explained by independent variables. F statistics is 16.576 which are significant at 5 percent level. This study proves that there is a significant impact on difficulties in execution and satisfactory outcome. The study also confirmed that there is no significant impact between material specification, price hike, replacement methods, design criterias, structural safety, structural resistance, on-site efficiency, manpower and worktime. Furthermore the study also found that the perception of execution difficulties, price hike and supply, replacement methods, design criteria, structural resistance that are significantly associating profile variables are gender, designation, department, experience. Since their respective “F” statistics are significant at 5% level.
REFERENCES
[1] C.F.Cheung, W.Y.Shek and W.B.Lee (2007) –“A systematic
approach for knowledge auditing in transportation sector”, Journal of knowledge management, Vol.11, No.4, pp.140-158.
[2] Christer Strandberg, Olof wahlberg, Peter ohman (2012) – “Challenges in serving the mass affluent segment: bank customer perceptions of service quality”, Managing service quality, Vol:22, N0. 4, pp,359-385.
[3] Daniel W. M. Chan, Patrick T. I. Lam and Albert .P.C. Chan (2010) – “The tale of a underground railway station modification project” , Facilities, Vol.28, No.5/6, pp.261-277.
[4] Dave Gelldders, jan Pieter, Verckens and Mirjam Galarza(2007) – “Performance communication of Belgian railway”, Journal of communication management,Vol.11, No.2, pp.170-181.
[5] David Pollit(2010) – “Theater techniques put translink on route to better customer service”, Human resource management international digest,Vol.18, No.2 , pp.21-23.
[6] Emilio Esposito and Renato Passaro (2009) – “Evolution of the supply chain in the Italian railway industry”, Supply chain management- an international journal, pp.303-313.
[7] G.Shainesh (2012) – “ Effects of trustworthiness and trust on loyalty intentions”, International journal of bank marketing, Vol:30, No.4, pp. 267-279
[8] James C. Squire, Gerald A. Sullivan, and George M. Brooke IV (2009), „Work in Progress – “Relationship of Demonstration Construction Quality on Pedagogic Effectiveness”, Journal of Institute of Electrical & Electronics Engineers, pp. W2B-1 – W2B-2. [9] James L. Burati (June, 1991), “Quality Management in construction industry”, Journal of American Society of Civil Engineers, Vol - 117, No. 2, pp. 341-359.
[10] Kenneth T. Sullivan (November 17, 2010), “Quality Management Programs in the Construction Industry”, Journal of American Society of Civil Engineers, pp. 1-45.
[11] K.W.Chaw and F.F.Ng – “ The effects of improvement in public transportation capacity on residential price gradient in Hong Kong”, Journal of property valuation & investment, Vol.16, No. 4.1998, pp.397-410.
International Journal of Emerging Technology and Advanced Engineering
Website: www.ijetae.com (ISSN 2250-2459, ISO 9001:2008 Certified Journal, Volume 5, Issue 3, March 2015)
590
[13] Low Sui Pheng and Jasmine Ann Teo (January 1, 2004), “Implementing total quality management in construction firms”, Journal of American Society of Civil Engineers, Vol - 20, No. 1, pp. 4-14.
[14] Megan Walters(1999) – “performance measurement systems”, Facilities,Vol.17, No.3/4 , pp.97-104.
[15] Miika makitalo and ollipekka himola(2010) – “Analyzing the future of railway freight competition: a Delphi study in Finland”, Vol.12, No.6, pp.20-37.
[16] Musa pinar, Tulay girard, Zeliha eser (2012) – “Consumer- based equity in banking industry”, International journal of bank marketing, Vol:30, No.5, pp. 359-375
[17] Paul.N.Kuriakose (2013) – “A new direction in public transport in India with national urban transport policy 2006”, Indian journal of transport management,pp.248-266
[18] Paul Cozens, Richard Neale, Feremy Whitaker & David hillier(2003) – “Investigating quality at rail stations using virtual technology”,Facilities,Vol.21, No.7/8 , pp.188-194
[19] Peter Hoonakker (2001), “Quality Management in construction industry”, Journal of the Center for Quality and Productivity Improvement, pp.1-12.
[20] Renshu Yang, (2010), “The Evaluation of Construction Quality Based on BP neural network”, Journal of Institute of Electrical & Electronics Engineers, pp. 1582 – 1585.
[21] Rizwan U. Farooqui et.al (2007), “Pakistan construction industry – total quality Management”, Journal of CBM, pp. 565-573.
[22] Robert.Y.Cavana and Lawrence.M.corbett (2007) – “Developing zones of tolerance for managing rail service quality”, International journal of quality & reliability management,Vol.24, No.1, pp.7-31. [23] Sofia Ohnell and john Woxenius (2003) – “ An industry analysis of
express freight from a European railway perspective”, International journal of physical distribution & logistics management, Vol.33, No.8, pp.735-751.
[24] Sumana Gupta & Rabindranath Datta (2010) – “A comparative study of two different techniques for evaluating quality”, The Asian journal on quality,Vol.11,No.3, pp.223-235.
[25] Syed M. Ahmed (1999), “Measurement of Construction Processes for Continuous Improvement”, Journal of AGC, pp. 1-63.
[26] Tarek Elghamrawy and Tomoya Shibayama (July 2008), “Total Quality Management Implementation in the Egyptian Construction Industry”, Journal of American Society of Civil Engineers, pp. 156-161.
[27] Thomas Ahren and Aditya Parida (2009) – “Overall railway infrastructure effectiveness (ORIE)”, journal of quality in maintenance engineering,Vol.15, No.1, pp.17-30.
[28] Ulla Espling and Ulf Olsson (2004) – “ Part- II partnering in a railway infrastructure maintenance contract: a case study”, Journal of quality in maintenance engineering,Vol.10, No.4, pp.248-253. [29] Vaid.K.N (January - April, 1999), “Quality Management system in
civil Works projects”, Journal of National Institute of Construction Management and Research, Vol – 15, No.3, pp. 187-199.