International Journal of Emerging Technology and Advanced Engineering
Website: www.ijetae.com (ISSN 2250-2459, ISO 9001:2008 Certified Journal, Volume 7, Issue 7, July 2017)
55
Vibration Amplitude Changes With Bridge Span Deterioration
BaoToan-Pham
1, QuangThanh-Nguyen
2*, DaThao-Nguyen
3, KieuNhi-Ngo
41,2,4
The Laboratory of Applied Mechanics, National University, Bach Khoa University 2Ho Chi Minh City Transportation Department
Abstract— This paper theorizes that expressions of
degradation are phenomena in which changing of distribution moving energy levels between harmonic vibrations. We propose using the power density spectrum of a random signal caused by loading transposition and vehicles. In addition, the authors present results of surveys conducted over several years on power spectra for several bridges in Ho Chi Minh City. Data processing methods approved the proposal of the authors; that clearly see the change of power spectrum. It based on the moment concept of power density spectrum and cumulative function of this moment. The results demonstrate that the assessment methods for the bearing capacity using moment and cumulative power density spectrum moment functions (CM-PSD) have potential applications in practice.
Keywords— Representative Power Density Spectrum;
Power Density Spectrum; zeroth-order spectral moment; first-order spectral moment; cumulative function.
I. INTRODUCTION
The identification and prediction of disability problems in beam and span bridges has attracted global attention from engineering and construction researchers. These researchers have two main areas of focus. The first examines the specific characteristics of each type of disability in order to build theoretical foundations and identify and predict disabilities. The biggest advantage of this research is its relative accuracy with respect to information regarding disabilities, and the ability to forecast the growth and growth rate of said disabilities with computer support. The use of algorithms has brought additional efficiency [1-6]. However, if specific disability types have not been surveyed, or if a mechanical system experiences a combination of multiple disability types, the problem becomes very difficult and complex, especially when these algorithms and theories are applied to real-life problems. Such complexities fail to represent the status of disabilities in a mechanic system. This occurs primarily because of differences in geometric dimensions, locations, depths, etc. between different disability types. Disabilities may or may not appear simultaneously, and can appear dependent on one another (i.e., the appearance of one disability can result in another; this is referred to as a phenomenon necklace). Because of these factors, this type of research can only solve specific problems.
International Journal of Emerging Technology and Advanced Engineering
Website: www.ijetae.com (ISSN 2250-2459, ISO 9001:2008 Certified Journal, Volume 7, Issue 7, July 2017)
56
For example, Bernal [48] converted an original vibration signal into transfer load or Ritz vectors [49 -50]. Additionally, elastic deformation potential energy [51] has been converted into wavelet signals [15].The basic concept of vibration-based damage detection methods is that modal properties (natural frequencies, mode shapes, and damping) are a function of the physical properties of the structure (mass, stiffness, and boundary conditions). Therefore, changes in the physical properties of the structure will cause changes in the modal properties. Doebling [52] and Sohn [53] have provided detailed literature reviews of vibration-based damage detection methods. Early vibration-based damage detection studies examined changes in dynamic properties during forced and ambient vibration. It was generally found that mode shapes were a more sensitive indicator of low damage levels than natural frequencies or damping [54–58]. Additional bridge damage detection methods have examined the changes in other vibration-based parameters, such as the frequency response function [59], mechanical impedance function [60], modal assurance criterion, coordinate modal assurance criterion [61–63], and finite element model updating [64–65]. The methods examined in this study are based on detecting changes in measured model shapes or their derivatives and for some methods, the natural frequencies of the structures. These methods use: changes in mode shape values, changes in mode shape curvature, changes in measured modal flexibility, changes in uniform load surface curvature, changes in unit load surface curvature, and the damage index (changes in strain energy). These methods were chosen because they use modal properties that are readily available using site measurement and modal testing, and do not require additional steps, such as the formulation and updating of a finite element model. The similar with mode shape parameter, with determining damping methods of structural can assess and determine the degree of damaged disability. Some researchers have used damping or damping coefficients to evaluate the working status of a mechanic system. This research shows that when evaluating changes in stiffnesses, damping coefficients are more sensitive than frequencies. The appearance of a disability in the material increases the likelihood of damping, because it increases energy depletion in the proceeding vibration. In [28], the authors suggested using dampers as an engaging and potential parameter to determine the disability.
Statistics from many of Zhang’s and Hartwig’s [29] test samples showed that the damping coefficient is apparently more sensitive than frequencies in identifying and predicting issues in structural health monitoring because damping varies more than natural frequencies. Similarly, Saravanos and Hopkins [30] also conducted many experiments on composite beams. The authors showed that the delamination of the material affected the ability damping of natural frequencies. Colakoglu and other authors [30] have observed that the damping coefficient is proportional to the cycle fatigue number in a structure. This is the main cause of deterioration and decreasing stiffness. However, the damping coefficient also has significant error during data processing, with especially this signal to obtain from reality under random signal. In general, the damping parameter is not only an insensitive parameter used to assess the declining stiffness in a real mechanic system structure, but also it has significant errors when a real, random vibration is created by loading transposition and vehicle and environmental impact forces. Some previous research shows that a classical parameter, such as frequency is not only the best representative parameter of the overall stiffness of the mechanic systems. However, these are not the sensitivity parameters. Although it was combined with algorithms, the frequency parameter value did not produce the desired results. The ability to assess disability and the growth disability using frequency has not produced the best results. In particular, it cannot be used in real life to assess any construction.
International Journal of Emerging Technology and Advanced Engineering
Website: www.ijetae.com (ISSN 2250-2459, ISO 9001:2008 Certified Journal, Volume 7, Issue 7, July 2017)
57
Salawan made before-and-after status measurements of a concrete bridge. Boundary conditions changed in areas where the bearings had been replaced. A research review by Andrew d. Dimarogonas [69] showed that over 500 papers on the subject have been published in the past ten years. A wealth of analytical, numerical, and experimental investigations now exists. However, a consistent cracked bar vibration theory has yet to be developed. There are still many unanswered questions, especially in the area of closing cracks in a beam or beam system. Therefore, the natural frequency parameters do not allow for an assessment of the state of decline from disability, and a forecast of the development of disability in a mechanical system structure.In practice, classical parameters including mode shape, frequency, and damping were not sensitive to changes in the stiffness due to disability. It can be observed that bridge vibration is a multi-component mixture of different vibrations, and that the vibration environment involves random processing. The above parameters typically use only one kind of vibration to assess the disability of a mechanical system. As a result, this parameter is not a true reflection of the bearing status of the system and assesses the decline in stiffness due to disability. Currently, new research has shown changes in the shape of the power spectral density (PSD) for a mechanical system with a disability. Bayissa [70] demonstrated a new vibration-based technique proposed for identifying and localizing structural damage in plate-like structures based on a non-model-based damage identification approach. The original contribution in that study is that the spectral strain energy of the vibration response signal is systematically developed based on 1) the mean-square value of the moment and 2) the spectral density curvature response. The efficacy of the proposed method is demonstrated by conducting a detailed damage identification study on plate and beam elements using simulated damage conditions. The sensitivity level and performance of the proposed method with respect to changes in structural properties caused by damage is illustrated by comparing the results of the proposed method with those obtained from two existing methods: the natural frequency method and the modal strain energy method. The results from both deterministic and statistically based damage indices clearly indicate that the proposed method performs remarkably well relative to existing methods. This is because the proposed method uses broadband frequency information, unlike its alternative counterparts, which use only resonance frequency information.
In research by Rathish P. Kumar [71], the experimental results obtained from the concrete beam specimen demonstrated the usefulness of the changes in the PSD magnitude as a diagnostic parameter for detecting damage, locating its position, and monitoring its development. In addition, all damage results identified by the proposed algorithm were determined without the need for measured input to the structure, because the PSD is measured from the structural acceleration response. Therefore, the algorithm may be a useful tool for the continuous health monitoring of structures, using ambient vibration as an excitation force. In addition, the PSD method detected the existence of damage, and could localize and monitor increases in that damage based only on measured data, without the need for any modal identification. KieuNhi-Ngo [72–74] has performed many studies on changes in PSD that can assess changes in the stiffness of a beam or bridge that has a disability. In particular, this author has proposed a representative PSD (RPSD), which is applied to the system with many different measurements of the same object. The research has applied RPSD to a bridge model with a frequency of appearance parameters. It can assess changes in the stiffness of beams and bridges for many different cases when the mechanical system has a disability.
II. THEORETICAL BACKGROUND
2.1. Random Processing 2.1.1. Fourier Transform
Most functions can be expressed as a series of sines and cosines, known as a Fourier series. The coefficients of the Fourier series specify the amplitudes of the sine and cosines, each having a specific frequency. Unfortunately, in most practical measurement applications, the input signal may not be known in a functional form. Therefore, although the theory of Fourier analysis demonstrates that any function can be expressed as a Fourier series, the analysis presented so far has not provided a specific technique for analysing a measured signal. Such a technique for decomposing a measured dynamic signal into amplitude and frequency is now described. Recall that the dynamic portion of a signal of arbitrary period can be described by equation (1).
2 2
2 2
2 2
cos . ; sin .
T T
n n
T T
A y t n t dt B y t n t dt
T T
International Journal of Emerging Technology and Advanced Engineering
Website: www.ijetae.com (ISSN 2250-2459, ISO 9001:2008 Certified Journal, Volume 7, Issue 7, July 2017)
58
Where the amplitudes An and Bn correspond to the nth frequency of a Fourier series.If we consider the period of the function to approach infinity, we can eliminate the constraint on the Fourier analysis, where the signal is a periodic waveform. In the limit, as T approaches infinity, the Fourier series becomes an integral. The spacing between the frequency components becomes infinitesimal. This means that coefficients An and Bn become continuous functions of frequency and can be expressed as A(ω) and B(ω), where:
cos . ;
sin .A y t t dt B y t t dt
(2)The Fourier coefficients of A(ω) and B(ω) are known as the components of the Fourier transform of y(t). To develop the Fourier transform, consider the complex number defined as:
Y A iB
(3) where i 1. Then, from equation (3), it follows directly that
cos sin
.Y
y t
t i
t dt
(4)
Introducing the identity
cos sin
i
e i leads to
i t.Y
y t e dt
(5)
We can rewrite equation (5) as
2. i ft
Y
y t e dt
(6)
Equations (5) and (6) provide the two-sided Fourier transform of y(t). The significance of the Fourier transform, Y(f), is that it describes the signal as a continuous function of frequency. If y(t) is known or measured, then its Fourier transform will provide the amplitude frequency properties of the signal that are otherwise not readily apparent in its time base form. It Y(t) is known or measured, we can recover the signal y(t) from
1
2. 2
i ft
Y
Y f e df
(7)Equation (7) describes the inverse Fourier transform of Y(t). It suggests that given the amplitude frequency properties of a signal, we can reconstruct the original signal y(t). The Fourier transform is a complex number having a magnitude and a phase.
i f
Y f Y f e A f iB f
(8) The magnitude of Y(f) is given by
2
2Re Im
Y f Y f Y f
(9) And the phase by
1Im
tan Re
Y f f
Y f
(10)
As noted earlier, the Fourier coefficients are related to the cosine and sine terms. Then the amplitude of y(t) can be expressed by its amplitude spectrum
2
2C f A f B f
(11) and its phase shifts by
f tan 1B f
A f
(12)
An easy way to comply with the conference paper formatting requirements is to use this document as a template and simply type your text into it.
2.1.2. Frequency Spectrum
The load of transportation vehicles and vibration of the bridge are the random processing components. Figure 1 shows a vibration acceleration graph.
Figure 1: The vibration acceleration graph at second span on Gongongto Bridge
In which:
A – Acceleration amplitude t – Time
International Journal of Emerging Technology and Advanced Engineering
Website: www.ijetae.com (ISSN 2250-2459, ISO 9001:2008 Certified Journal, Volume 7, Issue 7, July 2017)
59
2.
x
R E x t x t
(13) The Fourier transform of RA(τ) gives the power spectrum density of A(t), the notation of which is SA(f). For simplification, the following notation is introduced.
x x
S f f R
(14) It can clearly be seen that the power spectrum density (PSD) shows the level of energy vibration concentration from harmonics.
2.1.3.POWER SPECTRAL DENSITY
We now turn to the frequency composition of a naturally occurring random process. Because the time history x(t) of the sample function is not periodic, it cannot be represented by a discrete Fourier series. Also, for a stationary process, x(t) is infinite and the condition,
( )
x t dt
(15)is not satisfied, so that the classical theory of Fourier analysis cannot be applied to the sample function. This difficulty can be overcome by analysing not the sample functions of the process itself, but rather their autocorrelation functions
in which Rx
0 (16)and Rx( ) d
(17)The Fourier transforms ofRx( )
and its inverse aregiven by:
1( ). . 2
i
x x
S R e d
(18)Moreover, ( )
. i .x x
R S e d
(19)
x
S is referred to as the spectral density of the x process, and is a function of angular frequency. The most important property of Sx
becomes apparent when we consider
0. In this case
( 0) .
x x
R S d
(20)2.1.4.RESPONSE PSD
Now consider the problem of a vertical ground acceleration input modelled by a stationary white noise process with zero mean. Such an idealized random motion is defined by a uniform PSD S0 with an associated
autocorrelation functionRx( ) 2 S0
, where
is the Dirac delta function of the time lag τ. For such a random input, the stationary response power spectral densities Sp(y, ω), SF(y, ω) and SM(y, ω) (for pressure, shear, and moment, respectively), can be readily determined by the following well-known relationship:
*
0
, , . , .
S y H y H y S (21) Thus,
2 2
2
02
, . . , .sin
p
H y w H
S y S G
g c
(22)
2
2 3 2
0
2 2
, . . , 1 cos
F
H y w c H
S y S G
g c
(23)
2
2 3 2
0
2 2
, . . , sin
M
H y H y
w c H
S y S G
g c c
(24)
where
2 2
2 2 2 2
1 ( , )
1 cos 1 sin
c G c c H H H (25)
2.1.5.PROBABILITY DENSITY OF PEAKS
International Journal of Emerging Technology and Advanced Engineering
Website: www.ijetae.com (ISSN 2250-2459, ISO 9001:2008 Certified Journal, Volume 7, Issue 7, July 2017)
60
pz pE n p z dz
E n
(26)
Again, under the assumption of a narrow-band process, npz in that equation is approximately equal to the difference between the number of up-crossings of level z per unit time ncz and that for level z + dz per unit time nc,z+dz.
Thus
,
pz cz c z dz
E n E n n (27)
Similarly, E[np] is approximately equal to the average time rate of zero up-crossings v0
+
. Therefore,
0 0
z z dz z
v v dv
p z dz
v v
(28)
Recall that for x(t) and
x
t , which have uncorrelated Gaussian distribution and zero means, the average time rates of zero up-crossings for levels v0+ and z are, respectively, 0 2 x x v
; 2
2 exp 2 2 x z x x z v ;
22exp 2
2 x x z z p z
(29)
which is the well-known Rayleigh distribution for ocean wave height, as illustrated. Note that pz(z) = 0 for z <0 2.2.VIBRATION THEORY
Spans have a length greater than their cross sections, and final deformations under the effects of traffic loads. Therefore, they are considered the bar and behaviour in the linear elastics area. With the hypothesis that the spans will comply with the principle of superposition, it can be understood that the values of the indicative behaviour parameters of the mechanic system (such as deflection, deformation, and stress) are considered the total of the value caused by the status of individual forces. The transposition vehicle loads affect every span, and can simultaneously cause different loading types, such a bending, pure torsion, and torsion bending. The frequency of each type shows that:
The torsion of bar is given by
,
0
2 1 .
. 2 z T n n GJ l J (30)
with n = 0,1,2,3,… nth natural frequencies l is the length of the span
In the event that the x, y, z coordinate axes are the centre principal axes of inertia, then the z axis is the axial length of the span, and the coordinate origin is located in the centre of mass of the section.
Jz denotes the polar moment of inertia of the cross section, in the case of a circular section.
J0 is the mass polar moment of inertia of the shaft per unit length
G is the shear modulus of the material GJz is the torsional stiffness
The bending of a bar is given by
, . 4
. .
z
B n n
EJ l
A l
(31)
with n = 0,1,2,3,… nth natural frequencies
βn is determined from boundary conditions. If two simple supports of span are freedom, βn will be determined by the expression sin βn l = 0
E is Young’s modulus for the material A is the cross-sectional area
ρ is the specific weight
The torsion bending of a bar is given as described below. The theory of frequency bending torsion is described by:
2
2 2 2 2 2 2
2 4
2 1
Ti Bi Ti Bi Ti Bi
B T i
(32)
wherein 4 4 2 4 z Bi EI i l F ;
2 2 2 4 4
2
4 2
z z
Ti
GJ i l EJ i l I Fc
; 2 2 Fc I Fc
where EIz is the section bending stiffness and GJz is the section torsion stiffness
WhencB T and= 0, the frequency of bending torsion
is:
2 2
2 2
22
Ti Bi Ti Bi
B T i
(33)Therefore,
B T 1i
B i ;
B T 2i
T i `The vibration of each frequency is called the mode shape. The equation shows vibration in principal coordinates.
2 2 0 , . . l jj j j j q z t wj z dz
International Journal of Emerging Technology and Advanced Engineering
Website: www.ijetae.com (ISSN 2250-2459, ISO 9001:2008 Certified Journal, Volume 7, Issue 7, July 2017)
61
In which:q(z,t) is the density function of loading for a unit the length of the beam; 𝝃j is the generalized damping coefficient of the jth mode shape; ωj represents the natural coordinates of the jth mode shape.
In expression (34), the right side is a generalized force function in principal coordinates. For simplification, the following notation is introduced.
0
( ) , . ( ).
l
j
Q t
q z t w z dz [image:7.612.51.280.461.499.2](35) In the general, the transposition load of a vehicle is considered total of the functions with differential frequencies. If the harmonic of Q(t) approximates that of a similar frequency ωj, the coordinates of ϕj will increase. This is a resonance phenomenon. The load of transposition and vehicle is not a predetermined function, and always changes over time. Therefore, it can be shown that the Fourier transform of a circulation function can contain most harmonics for a mode shape. The resonance phenomenon will happen for all frequencies of three types of load bearing-components in mechanic systems— bending, pure torsion, or torsion bending. Figure 2 shows that the S(A) graph of power spectral amplitude, in which A is the acceleration amplitude of some file of dataset measuring the vibration of a span by real loading transposition and vehicle function in the same measurement in the Gongongto Bridge.
Figure 2: The PSD of the vibration signal by the load of transposition and vehicle.
[image:7.612.357.531.575.608.2]The middle graph in Figure 2 shows that with different loading transpositions and vehicles, the shape of the PSD is the difference. However, all resonance areas will appear at a constant-frequency location. The frequency value received from the real signal was always changed and was not proportional to the frequency integer times in the expression (34). In this case, it can be seen that the frequency value is dependent not only on the type of vibration component, but also on the different vibration components of loading transpositions and vehicles on the bridge. The total value of of S(A) in all file dates for one measurement period is referred to as the RPSD, and is shown in Figure 3.
Figure 3: The RPSD of the second measurement for the second span of the Gongongto Bridge
In the event that S(A) can show relative levels of kinetic energy between all harmonics, the kinetic energy expression of the type of vibration component is introduced:
The kinetic energy of bending is given by:
2
0
1
. . 2
l
T w A dz
(36) The parameter w represents deflection, which can be shown by mode shape and is given by:
1
.cos
n n n
n
w w z
(37)
wherein wn(z) is nth mode shape and ωj is the nth frequency.
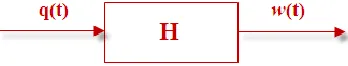
Just as there is a kinetic energy expression, there is a pure torsion expression and a torsion-bending expression. The specific value of these will depend on the frequency of the active load. At survey time, the harmonics have the value frequency of ωn; in the event that the harmonic value of active load the same value frequency is usually called resonant area. The relative values of the amplitudes between the harmonics are dependent not only on the proximity level of the excitation and natural frequencies, but also on the values of characteristic parameter 𝝃n shown in expression 9. Here, 𝝃n is dependent on the mechanical properties of the materials for each span. The relationship between excitation force q(z,t) and span vibration is shown by Figure 4.
Figure 4: The relationship between vibration and excitation force
In which: H is typically called the transfer function
We can see that w(t) = H (q(t)). (38)
International Journal of Emerging Technology and Advanced Engineering
Website: www.ijetae.com (ISSN 2250-2459, ISO 9001:2008 Certified Journal, Volume 7, Issue 7, July 2017)
62
The expression for H contains the specific values of the mechanical characteristics of the system, including geometric and mechanical properties. These are usually represented by ωn and 𝝃n. In this case, the active force is therandom processing that the received vibration is too. Expression (38) will become expression (39):
S(q(t))=H.S(A) (39) With S(q) being the power spectral of the active force, we can assume that the load of the transposition vehicle is the sense stationary random processing, in which the change in expression S(A) will depend on the change in expression H. So, we will detect the changes in the value of H if we are monitoring changes in S(A). It can be seen that changes in the expression S(A) will reflect the aging process of the mechanical system. With these changes, we can forecast changes in the geometry of cracks, as well as mechanical properties including the modulus of the material and its energy dissipation coefficients. To quantify the difference between the graphs for expression S(A), we propose using the concept of spectral moment in the PSD graphs.
2.2.1. ZEROTH-ORDER SPECTRAL MOMENT
The zeroth-order spectral moment is defined as the overall energy content of the oscillatory signal, or the mean power of the response PSD for the selected frequency bands. For a band-limited spectral density function, zeroth-order spectral moment can be obtained from the frequency domain, as follows:
2
1
0 .
f
f A
f
S f df
(40)
Where f1 and f2 are the limits of the maximum frequency bandwidth under consideration
2.2.2. FIRST-ORDER SPECTRAL MOMENT
The first order spectral moment, also known as the spectral centroid, is defined as the mean frequency of the PSD for a given frequency bandwidth (for instance, f1 to f2). This statistical parameter is known to provide useful information regarding the time at which half of the energy of the signal has arrived and half of the energy is yet to arrive.
2
1 1
0
1
. .
f
f A
f f
f S f df
(41)
Physical representations of mean frequency and mean amplitude are equivalent to those for resonance frequency and peak amplitude, respectively, except that the former parameters take into account broadband frequency information. This implies that mean frequency can be an alternative candidate to resonance frequency in frequency-based structural damage identification. However, there is no clear information on whether the use of mean frequency increases the probability of detecting small changes in structural properties (because broadband information is employed) or reduces that probability because of the potential leakage of information into the neighbouring frequencies, which results from the averaging involved. The numerical study described in the following sections aims to clarify this aforementioned ambiguity.
III. RESULTS AND DISCUSSION
[image:8.612.328.562.511.600.2]It can be seen that bridge damage accumulates over time. We have checked the vibration signal using various measurements. The objective of this study is to find changes in bridge damage over time using the characteristics of the vibration signal. In this paper, survey results from the Saigon Bridge in Ho Chi Minh City will be presented. The Saigon Bridge connects the urban and suburban areas of Ho Chi Minh City. It has 32 spans, including three middle spans (the 17th, 18th, and 19th span) made of structural steel bearing beams. The remaining spans are made of reinforced concrete, 24.7 m in length and 24 m in width. This is the most important bridge between Ho Chi Minh City and the southern provinces. It bears consecutive heavy loads all day and night, with a density of high loads from transposition vehicles.
Figure 5: View of Saigon Bridge in Ho Chi Minh city, Vietnam
In 2011, Saigon Bridge was repaired, and our survey began in late 2011.
3.1. VIBRATION MEASUREMENT ORGANIZATION
Measurement sensor
International Journal of Emerging Technology and Advanced Engineering
Website: www.ijetae.com (ISSN 2250-2459, ISO 9001:2008 Certified Journal, Volume 7, Issue 7, July 2017)
63
- Serial#: 1999- Manufacturer: Reference LLC/sensor - Process#: 224
- General accuracy: ± (50 mg ± 5% of reading) - Measurement locations: midpoint of each span - Sampling speed: 100 Hz
- Number of samples: 2000 samples per files and 30 files at each position
- External stimulation: traffic loads from 2011 to 2015 with six measurement campaigns (table 1)
Figure 6a: The accelerometer sensor in this project
Table 1:
Time of measurement campaigns
[image:9.612.326.549.206.339.2]In Table 1, it can see that for the first four measurements, the time between adjacent campaigns was approximately three months. The time between the 4th and 5th campaigns was 11 months, while it was 27 months between the 5th and 6th campaigns.
Figure 6b: Measuring at the ½ point of the 19th span of Saigon Bridge
in Ho Chi Minh City
Analysing The Characteristics Of Measured Data
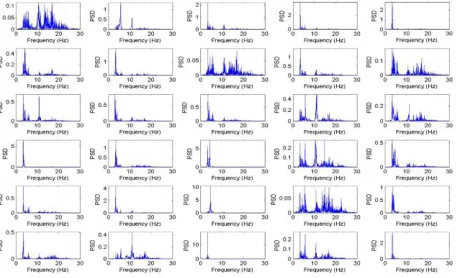
In this research, we will focus on PSD. Figure 7 is a graph of the vibration signals measured by an accelerometer sensor from 30 continuous data files at a fixed position.
Figure 7: Accelerating vibration signal graph of 12th span in 3rd
campaign (5/2012)
[image:9.612.328.556.423.562.2]Because of random traffic conditions, the shapes of the RPSD graphs are different in all files. The power spectrum density graph corresponds to the graph acceleration in the respective positions shown in Figure 8.
Figure 8: The power spectrum density of an acceleration signal at the 12th span in the 3rd campaign.
The changing of transposition vehicle during measurement time received signal that it made bridge behaviour more diverse than the testing method.
[image:9.612.56.282.511.635.2]International Journal of Emerging Technology and Advanced Engineering
Website: www.ijetae.com (ISSN 2250-2459, ISO 9001:2008 Certified Journal, Volume 7, Issue 7, July 2017)
64
-
There are three spectra (accounting for 10% of the total data) containing two outstanding large amplitude values at the same frequency.-
There are eight spectra (accounting for 26.7% of the total data). They have a significant amount of amplitude value and focus on two areas (3 to 7 Hz and 10 to 20 Hz).-
There are nine spectra (accounting for 30% of the total data). They have the superior frequency values that are present in the range from 3 to 7 Hz. [image:10.612.322.566.116.440.2]These characteristics show that a greater number of appearances of frequencies with superior values are concentrated in regions containing the frequencies of spans. In Figure 9, we can see that it is the PSD with a vibration amplitude that is the average value of the 30 files. This spectral will be called RPSD.
Figure 9: The RPSD For The 12th Span In The 3rd Campaign (5/2012)
The representation of the spectrum clearly shows the vibration of the span, including some harmonic frequencies in certain resonance areas. The concrete spans of the Saigon bridge with frequency areas contained harmonic vibrations from 3 to 7 Hz, 10 to 12 Hz, and 13 to 20 Hz. These were respectively known as the first, second, and third areas
[image:10.612.52.287.315.376.2]3.2. STUDYING RPSD
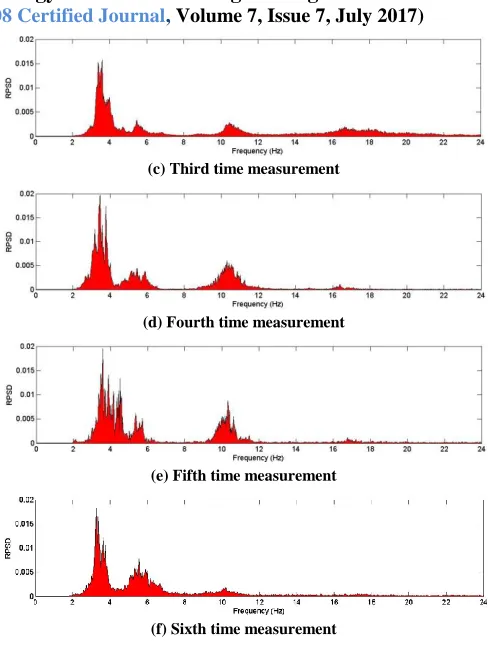
Figure 10 shows an RPSD for Saigon Bridge at the 32nd span. We can see that it was built from total data for the six time measurements presented in Table 1.
(a) First time measurement
(b) Second time measurement
(c) Third time measurement
(d) Fourth time measurement
(e) Fifth time measurement
(f) Sixth time measurement
Figure 10: The RPSD of 32th span of Saigon Bridge in 6 time
measurements
The following was observed with respect to Figure 10:
-
The amplitude is largest for the first area and smallest for the third area.-
Over time, the amplitude of third area, continuing with the second area will to smaller or even disappearing (third area). If we compare the first and sixth time measurements, we see that the RPSD of the first time measurement contains the most significant amplitude of all areas. In contrast, the graph of the sixth time measurement is rounded, leaving only one area (the area with the lowest frequency value).-
The shapes of the RPSD graphs for all areas change. To indicate a change in the shape of the RPSD, we propose using the zeroth-order spectral moment (M(0)) andfirst-order spectral moment (M(1))
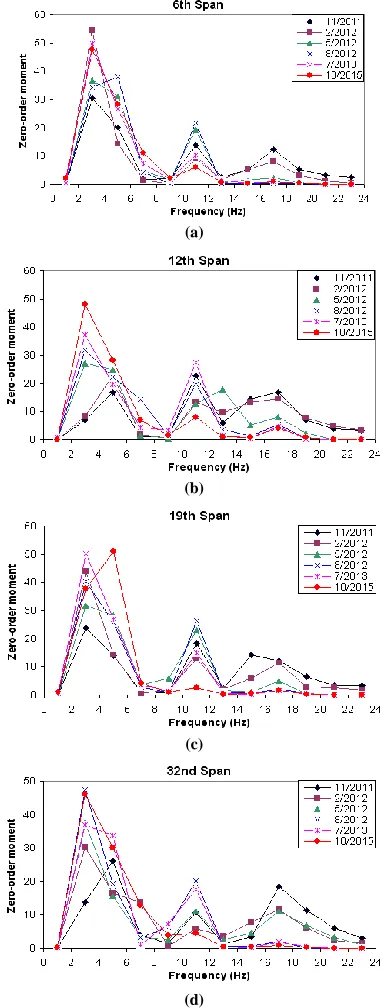
3.2.1. THE ZEROTH-ORDER SPECTRAL MOMENT M(0)
Figure 11 shows graphs of the zeroth-order spectral moment for some spans of Saigon Bridge. The graphs were built using M(0) values and normalized for a total RPSD
[image:10.612.50.293.535.685.2]International Journal of Emerging Technology and Advanced Engineering
Website: www.ijetae.com (ISSN 2250-2459, ISO 9001:2008 Certified Journal, Volume 7, Issue 7, July 2017)
65
(a)
(b)
(c)
[image:11.612.71.264.135.639.2](d)
Figure 11: Zeroth-order moment of RPSD of Saigon Bridge for some spans, a) 6th span, b) 12th span, c) 19th span, and d) 32nd span
We observed the following with respect to Figure 11:
-
In the zeroth-order moment of RPSD, it can be observed that the M(0) values slowly decreased from thefirst area to the third area.
-
The high-frequency areas show clear frequency values from 13 to 24 Hz. The value of M(0) tends todecrease over time.
-
M(0) in the first and second area did not linearlychange over time; however, in the last measurement, the M(0) values of the second area were the smallest out of all
graphs. We can note that at the time of the last measurement was third area on RPSD of the spams that has very few or disappear value.
-
Although the zeroth-order moment of RPSDs changed for the third area, the value of which covariates and decreases over time, the value of M(0) in third area wascovariant and had a quite small value. Therefore, the M(0)
values do not use for monitoring the degradation of spans. 3.2.2. THE FIRST-ORDER SPECTRAL MOMENT M(1)
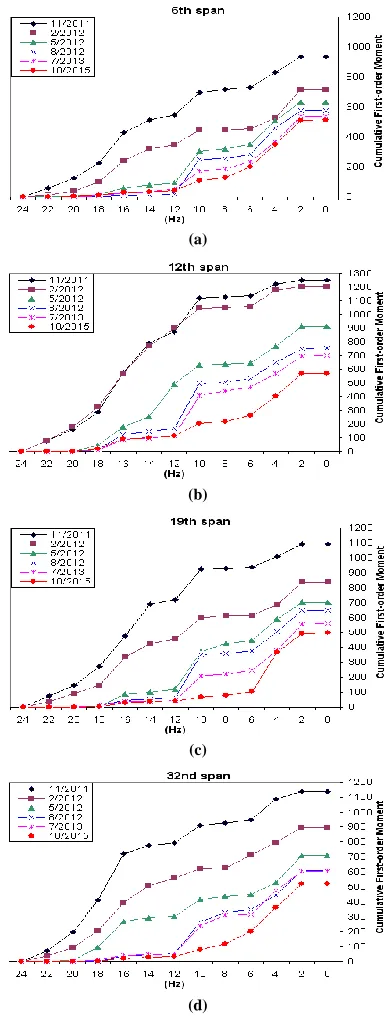
The first-order spectral moment M(1) for RPSD was
calculated for the vertical axis at the position at the frequency value zero of the chart RPSD. Figure 12 shows a diagram of M(1) for some spans. The M(1) value is
calculated from the amplitude value of RPSD, which was directly orthonormal.
(a)
International Journal of Emerging Technology and Advanced Engineering
Website: www.ijetae.com (ISSN 2250-2459, ISO 9001:2008 Certified Journal, Volume 7, Issue 7, July 2017)
66
(c)
[image:12.612.345.541.132.640.2](d)
Figure 12: First-order moment of the RPSD of Saigon Bridge for some spans, a) 6th span, b) 12th span, c) 19th span, and d) 32nd span
[image:12.612.73.270.133.376.2]The following comments are observed with respect to Figure 12:
-
We show that the M(1) graphs likely affected theshapes of the M(0) graphs.
-
The M(1) value for the third area declined over time inour measurements.
-
The M(1) values of the first and second areas did notcovariates changing over time; however, during the last measurement, the M(1) value of the second area was the
smallest of all graphs. We can see that at the time of the last measurement in the third area of the spans, RPSD had a very low value or disappeared.However, the M(1) values in
the third area was quietly the large covariates over time. Therefore, we should use M(1) to monitor the degradation of
spans. This would be more advantageous than using classical parameters such as natural frequency, damping, mode shape, and the zero-other moment spectrum.
Figure 13 shows cumulative function (CF) graphs of the M(1) value of RPSD. The CF was calculated, and was
cumulative from the high to low frequency values of the RPSD.
(a)
(b)
(c)
(d)
International Journal of Emerging Technology and Advanced Engineering
Website: www.ijetae.com (ISSN 2250-2459, ISO 9001:2008 Certified Journal, Volume 7, Issue 7, July 2017)
67
-
For the same structured spans (6th span, 12th span, 19th span, 32nd span), Figure 13 shows differences more clearly than Figure 12. This represent was made the cumulative function quantity M(1) more sensitive than the zeroth-orderand first-order moment spectra.
-
The cumulative graphs M(1) of the before timemeasurements will under the previous time measurements.
-
The time between the first four measurements (1th, 2th, 3th, and 4th time measurements) was, on average, three months. The charts have much different than the 4th time measurement and 5th time measurement graphs. The time measurement for the 4th and 5th measurements was nearly one year, from August 2012 to July 2013. The time for the 5th and 6th measurements graphs was 27 months, from July 2013 to October 2015.-
The slope of the cumulative function shows the magnitude of the first-order moment spectrum. The areas have the cumulative function greater slope than these areas have the large M(1) value. For example, we reviewed Figure13c, in which the graph of time measurement in November 2011 has three areas, with values including 2–6 Hz; 10–12 Hz and 14–24 Hz. It was easily shown that the maximum value for this time measurement fell in a range from 14-24 Hz, and this value was the most sensitive value, changing constantly over the measurement period. Similar to the time measurements in November 2011, the graph of time measurements in October 2015 was the only area that had a significant slope from 2 to 6 Hz. Therefore, the accumulation of M(1) in the RPSD contained only one area
with an exceptional value. Over time, the development-processing slope of the CF for the highest frequency value decreased; conversely, the slope for the low-frequency value increased. We can see that the cumulative functions will a parameter to use monitoring the degradation of spans.
-
An observation of Figures 13a, 13b, 13c, 13d shows that the cumulative function graphs were different for each span. These means that the CF of M(1) allowed for thedegradation of spans to be compared.
-
The CF graphs for different spans have different values after three months, as shown in Figure 13. When we compared these with the parameters that are commonly used to monitor the degradation of a bridge,IV. CONCLUSIONS
The survey spectral RPSD of all spans have various structures and materials. We drew the following conclusions:
-
For a conventional bridge, the measured frequency areas are limited to a range from 3 to 20 Hz. The results were recorded for over 200 bridges. We have found the majority of natural frequency areas and resonance areas of pre-stressed concrete bridges that were usually fourth values. With the conventional concrete bridges, the natural frequency values were usually two and two resonance areas.-
Fundamental mode shapes may appear during the vibration of a span under the effects of actual traffic loads. The RPSD of the vibration signal on a bridge has all resonance areas. These areas can correspond to different mode shapes. In time, along with the development of damage, the vibration amplitude of resonance areas will decrease. That is, the high-frequency areas will decline and disappear. Finally, these areas have only one resonance area that respectively with only the lowest frequency value in this area.-
The characteristics of the RPSD changes are the RPSD shapes, which will change to a lower vibration amplitude. The harmonics will move from high frequency areas to lower frequency areas. Therefore, when the RPSD allows us to survey multi-frequency vibration, the RPSD will have more accurate results than would be obtained from a single frequency.-
The cumulative frequency graph clearly shows the relocation of energy from high frequency areas to lower frequency areas. Therefore, we can monitor the aging process of a bridge in a timely manner. It can see that the cumulative graph will be very useful for forecasting. The use of the RPSD for a random vibration signal has the potential to bring greater economic benefits than the classical monitoring methods. This will pave the way for the monitoring of various bridges, which is a significant problem, and is urgent in countries with a large number of bridges, like Vietnam.V. FUTURE TRENDS
-
Continue using the extracted parameters, not only the M0 parameters, cumulative RPSD zeroth-order momentfunction, and cumulative RPSD first-order moment function, but also new research parameters that can quantify changes in RPSD.
-
Develop the ability to identify the position and level of damage.VI. THANKS
International Journal of Emerging Technology and Advanced Engineering
Website: www.ijetae.com (ISSN 2250-2459, ISO 9001:2008 Certified Journal, Volume 7, Issue 7, July 2017)
68
REFERENCES[1] Stochastic fatigue crack growth simulation of interfacial crack in bi-layered FGMs using XIGA. G. Bhardwaj, I.V. Singh, B.K. Mishra. Department of Mechanical and Industrial Engineering, Indian Institute of Technology Roorkee, Roorkee, UK, India : computer methods in applied mechanics and engineering, 2015, Vol. 284. 186-299.
[2] The dynamic analysis of a cracked Timoshenko beam by the spectral element method. M. Krawczuk, M. Palacz, W. Ostachowicz. s.l. : Journal of Sound and Vibration, 2003, Vol. 264. 1139–1153. [3] Extended finite element method and fast marching method for
three-dimensional fatigue crack propagation. N. Sukumar, D.L. Chopp, B. Moran. s.l. : Engineering Fracture Mechanics , 2003, Vol. 70. 29-48. [4] Boundary element simulation of fatigue crack growth in multi-site
damage. R.J. Price, J. Trevelyan. s.l. : Engineering Analysis with Boundary Elements , 2014, Vol. 43. 67-75.
[5] Numerical implementation of a multiaxial cyclic plasticity model for the Local Strain method in low cycle fatigue. C. Madrigal, A. Navarro, V. Chaves. s.l. : Theoretical and Applied Fracture Mechanics, 2015. 1-9.
[6] Experimental and Numerical Analysis of Transversal Open Cracked Shafts considering Beam Slenderness and Crack Depth. Rafael García-Illescas, Julio C. Gomez-Mancilla, Luigi Bregant. s.l. : Proceedings of the 9th IFToMM International Conference on Rotor Dynamics, Mechanisms and Machine Science, 2014. 347-359. [7] Simplified Models for the Location of Crack in Beam Structures
Using Measure Vibration Data. J. K. SINHA, M.I.FRISWELL AND S. EDWARDS. 1, s.l. : Journal of Sound and <ibration, 2002, Vol. 251. 13-38.
[8] [8] Damage detection by a moving mass on beam structure. Young-Jun Ahn, Seung-Guk Lee, Dong-Ho Cho. 1, s.l. : Architecture and Civil Engineering, 2015, Vol. 98. 1-4.
[9] Evaluation Of The Non-Linear Dynamic Response To Harmonic Excitation Of A Beam With Several Breathing Cracks. SURACE, NICOLA PUGNO AND CECILIA. 5, s.l. : Journal of Sound and <ibration, 2000, Vol. 235. 749} 762.
[10] Experimental Study On Vibration Disturbance Analysis Of Structure Of Cracked Beams : Implementation. Rahul Mishra, Rahul Mishra, Rahul Satbhaiya. 7, s.l. : Global Journal of Engineering, Science & Social Science Studies, Vol. 1. 52-58.
[11] Structural Damage Detection by Measurements of Vibration Characteristics . Khiem, Nguyen Tien and Khang, Do Dinh. s.l. : International operational model ananysis conference, 2009. 789-801. [12] The full n onlinear crack detection p roblem in uniform vibrating rods. Lourdes Rubio, JoseFernandez-Saez, Antonino Morassi. s.l. : Journal Of Sound And Vibration, 2015, Vol. 339. 99-111.
[13] The Dynamic Stiffness Matrix Method In Forced Vibration Analysis Of Multiple-Cracked Beam. N. T. KHIEM, T. V. LIEN. 3, s.l. : Journal of Sound and Vibration, 2002, Vol. 254. 541- 555.
[14] Investigations on a particle filter algorithm for crack identification in beams from vibration measurements. R Rangaraj, Bharat Pokale, Anuradha Baerjee, Sayan Supta. 8, s.l. : Structural Control And Health Monitoring, 2015, Vol. 22. 1049–1067.
[15] Wavelet-based crack identification of bridge beam from operational deflection time history. X.Q. Zhu, S.S. Law. s.l. : International Journal of Solids and Structures, 2006, Vol. 43. 2299–2317. [16] Crack Detection In Beam-Type Structures Using Frequency Data.
Stubbs, Jeong-Tae Kim and Norris. s.l. : Journal Of Sound And Vibration , 2003. 1-37.
[17] Natural frequencies for bending vibrations of Timoshenko cracked beams. J.A. Loya, L. Rubio, J. Fernandez-Saez. 3-5, s.l. : Journal of Sound and Vibration, Vol. 290. 640–653.
[18] A Simplified Method For Natural Frequency Analysis Of A Multiple Cracked Beam. N. T. KHIEM, T. V. LIEN. 4, s.l. : Journal of Sound and Vibration, 2001, Vol. 245. 737 - 751.
[19] Multi-crack detection for beam bythe natural frequencies. N.T. Khiem, T.V. Lien. s.l. : Journal of Sound and Vibration, 2003, Vol. 273. 175–184.
[20] A novel method for crack detection in beam-like structures by measurements of natural frequencies. s.l. : Journal Of Sound And Vibration, 2014, Vol. 333. 4084 – 410 3.
[21] Crack detection in pile by measurements of frequency response function. N.T. Khiem, P.T. Hang & L.K. Toan. 2, s.l. : Nondestructive Testing and Evaluation, 2016, Vol. 31. 1-20. [22] Time–frequency analysis of the free vibration response of a beam
with a breathing crack. E. Douka, L.J. Hadjileontiadis. 1, s.l. : Ndt&E International, 2005, Vol. 38. 3-10.
[23] D Etermination Of Mode Shapes Of A Multiple Cracked Bea Melement And Its Appli Ation For Free Vibration Analysis Of Amulti-Spa N Continuous Beam. Tran Van Lien, Trinh Anh Hao. 4, s.l. : Vietnam Journal of Mechanics, 2013, Vol. 35. 313 – 323. [24] Natural Modes Of Bernoulli-Euler Beams With Symmetric Cracks .
PIERRE, M.-H. H. SHEN AND C. 1, s.l. : Journal ofSound and Vibration , 1990, Vol. 138. 115-134 .
[25] Damage Identification in Beam-Type Structures: Frequency-Based Method Versus Mode-Shape-Based Method. Jeong-Tae Kim, Yeon-Sun Ryu, Hyun-Man Cho, Norris Stubbs. s.l. : Engineering Structures, 2003.
[26] Modal analysis of a cracked beam. M.Chati, R.Rand, S.Mukherjee. 2, s.l. : Journal of Sound and vibration, 1997, Vol. 207. 249-270. [27] A procedure for multiple crack identification in beam-like structures
from natural vibration mode. Tran, Nguyen Tien Khiem and Hai Thanh. 0, s.l. : Journal Of Vibration And Control, 2013, Vol. 0. 1-11. [28] A method for the localization of damage in a CFRP plate using damping. D. Montalvao, A .M. Ribeiro, J. Duarte-Silv. 6, s.l. : Mechanical Systems and Signal Processing, 2009, Vol. 23. 1846– 1854.
[29] Relation of damping and fatigue damage of unidirectional fibre composites. Z. Zhang, G. Hartwig. 7, s.l. : International Journal of Fatigue, 2002, Vol. 24. 713–718.
[30] Effects of delaminations on the damped dynamic characteristics of composites. D.A . Saravanos, D.A . Hopkins. 2, s.l. : Journal of Sound and Vibration, 1995, Vol. 19. 977–993.
[31] Description of fatigue damage using a damping monitoring technique . Colakoglu, M. s.l. : Turkish Journal of Engineering and Environmental Sciences, Vol. 27. 125-130.
[32] Finite Element Model Updating Using Power Spectral Density Of Structural Response. Masoud Pedram, Akbar Esfandiari, Fariba Shadan. La Cité, Nantes, France : 7th European Workshop on Structural Health Monitoring, 2014. 1373-1379.
[33] Dama ge identification in a lightly reinforced concrete beam based on changes in the power spectral density. Rathish P. Kumar, T. Oshima, S. Mikami , Y. Miyamori, T. Yamazaki. 8, s.l. : Structure and Infrastructure Engineering, 2014, Vol. 8. 715–727.
International Journal of Emerging Technology and Advanced Engineering
Website: www.ijetae.com (ISSN 2250-2459, ISO 9001:2008 Certified Journal, Volume 7, Issue 7, July 2017)
69
[35] Damage Identification in Plate-like Structures using Bending Moment Response Power Spectral Density. W. L. Bayissa, and N. Haritos. 1, s.l. : Structural Health Monitoring, 2007, Vol. 6. 15-24. [36] Genetic Algorithm-based Approach for Bayesian Damage
Identification Using Spectral Density Analysis in Beam-like Structures . M. Varmazyar, N. Haritos, and E. Gad. Barossa Valley, South Australia : AEES 2011 Conference, 2011.
[37] Statistical damage identification for bridges using ambient vibration data. Zhang, Q. W. s.l. : Computer and Structures, 2007, Vol. 85. 476-485.
[38] Statistical Analysis of Online Strain Response and Its Application in Fatigue Assessment of A Long-Span Steel Bridge. Z. X. Li, T. H. T. Chan, R. Zheng. s.l. : Engineering Structures, 2003, Vol. 25. 1731-1741.
[39] Bridge Management System and Maintenance Optimization for Existing Bridges . Ayaho M., Kei K., Hideaki N. 3, s.l. : Computer-Aided Civil and Infrastructure Engineering, 2000, Vol. 15. 45–55. [40] A Fuzzy Expert System for Damage Assessment Using Genetic
Algorithms and Neural Networks. Furuta, H., He, J. & Watanabe, E. 1, s.l. : Microcomputers in Civil Engineering, 1996, Vol. 11. 37–45. [41] Application of Genetic Algorithms to Identify Damage in Elastic
Structures. Mares, C. & Surace, C. 5, s.l. : Journal of Sound and Vibration, 1996 , Vol. 195. 195–215.
[42] Structural Identification Using Neural Networks. C-Bang Yun, Eun Young Bahng. s.l. : Computers Structures, 2000, Vol. 77. 41-52. [43] Structural Damage Detection Using An Iterative Neural Network.
Chang, C. C., Chang, T. Y. P. & Xu, Y. G. s.l. : Journal of Intelligent Material Systems and Structures , 2000, Vol. 11. 32–42. [44] A neural network approach for structural identification and
diagnoses of a building from seismic response data. C. S. Huang, S. L. Hung, C. M. Wen and T. T. Tu. s.l. : Earthquake Engineering and Structural Dynamics , 2003, Vol. 32. 187-206.
[45] Crack identification in beams using wavelet analysis. E. Douka, S. Loutridis, A. Trochidis. s.l. : International Journal of Solids and Structures, 2003, Vol. 40. 3557–3569.
[46] Damage Assessment of Composite Structures: A Fuzzy Logic Integrated Neural Network Approach. Anantha Ramu, S. & Johnson, V. T. 3, s.l. : Computers and Structures, 1995, Vol. 57. 491–502. [47] A Fuzzy Expert System for Damage Assessment Using Genetic
Algorithms and Neural Networks. Furuta, H., He, J. & Watanabe, E. 1, s.l. : Microcomputers in Civil Engineering , 1996, Vol. 11. 37–45. [48] Load vectors for damage localization. Bernal, D. 1, s.l. : Journal of
Engineering Mechanics, 2002, Vol. 128. 7–14.
[49] Application of Ritz Vectors to Damage Detection for A Grid-Type Bridge Model. Hoon Sohn, Kincho H. Law. Kissimmee, FL : Proceedings of the 17th International Modal Analysis Conference, 1999. 8-11.
[50] Damage Diagnosis Using Experimental Ritz Vectors. Hoon Sohn, Kincho H. Law. 11, s.l. : Journal of Engineering Mechanics, 2001, Vol. 127. 1184-1193.
[51] Stability Theory for an Extensible Beam. BALL, J. M. s.l. : Jounal of Diffirential Equations , 1973, Vol. 14. 399-418.
[52] Doebling, S.W., Farrar, C.R., Prime, M.B. and Shevitz, D.W. Damage identification and health monitoring of structural and mechanical systems from changes n their ibration characteristics: a literature review. New Mexico, U.S.A : report LA-13976-MS, 1996.
[53] Sohn, H., Farrar, C.R., Hemez, F.M., Shunk, D.D., Stinemates, S.W., Nadler, B.R. and Czarnecki, J.J. A review of structural health monitoring literature: 1996-2001. New Mexico USA : Los Alamos National Laboratory report LA-13976-MS, 2003.
[54] Salane, H.J., Baldwin, J.W. and Duffield, R.C. Dynamics approach for monitoring bridge deterioration. s.l. : Transportation Research Record, 1981. 21-28.
[55] Evaluating structural deterioration using dynamic response characterization. Spyrakos, C., Chen, H.L., Stephens, J. and Govidaraj V. London, UK : Proceedings of the International Workshop on Intelligent Structures, Elsevier Applied Science, 1990. 137-154.
[56] Experimental study of bridge monitoring technique. Mazurek, D.F. & DeWolf, J.T. 9, s.l. : Journal of Structural Engineering, 1990, Vol. 116. 2532-2549.
[57] Farrar, C.R., Baker, W.E., Bell, T.M., Cone,K.M., Darling, T.W. and Duffey, T.A. Dynamic characterization and damage detection in the I-40 Bridge over the Rio Grande. New Mexico, U.S.A : Los Alamos National Laboratory report LA-12767-MS, 1994.
[58] Signal versus noise in damage detection by experimental modal analysis. Alampalli, S., Fu, G. and Dillon, W. 2, s.l. : Journal of Structural Engineering, 1997, Vol. 123. 237-245..
[59] Vibration testing for non-destructive evaluation of bridges. Samman, M.M. and Biswas, M. 1, s.l. : Journal of Structural Engineering, 1994, Vol. 120. 269-289.
[60] Salane, H.J., Baldwin, J.W. and Duffield, R.C. Dynamics approach for monitoring bridge deterioration. s.l. : Transportation Research Record, 1981. 21-28.
[61] The location of defects in structures: a comparison of the use of natural frequency and mode shape data. Fox, C.H.J. San Diego, Calif : Proceedings of the 10th International Modal Analysis Conference (IMAC), 1992. 522–528.
[62] Farrar, C.R., Baker, W.E., Bell, T.M., Cone, K.M., Darling, T.W. and Duffey, T.A. Dynamic characterization and damage detection in the I-40 Bridge over the Rio Grande. New Mexico, U.S.A : Los Alamos National Laboratory report LA-12767-MS, 1994.
[63] Damage location using vibration mode shapes . Salawu, O.S. and Williams, C. Honolulu, HI : Proceedings of the 12th International Modal Analysis Conference (IMAC), 1994. 933-939 .
[64] Probabilistic system identification and health monitoring of structures. Beck, J.L. and Katafygiotics, L.S. Balkema, Rotterdam : Proceedings of the 10th World Conference on Earthquake Engineering, 1992. 3721-3726.
[65] Evaluation of the minimum rank update in damage detection: an experimental study. Kaouk, M. and Zimmerman, D.C. Kissimmee, FL : Proceedings of the 11th International Modal Analysis Conference (IMAC), 1993. 1061-1068.
[66] A novel method for crack detection in beam-like structures by measurements of natural frequencies. N.T. Khiem, L.K. Toan. s.l. : Journal of Soun d and Vibration, 2014, Vol. 333. 4084 – 410 3. [67] Assessment of bridges: use of dynamic testing. Salawu, O S. 2, s.l. :
Revue canadienne de génie civil,, 1997, Vol. 24. 218-228.
International Journal of Emerging Technology and Advanced Engineering
Website: www.ijetae.com (ISSN 2250-2459, ISO 9001:2008 Certified Journal, Volume 7, Issue 7, July 2017)
70
[69] Vibration Of Cracked Structures: A State Of The Art Review. DIMAROGONAS, ANDREW D. 5, s.l. : Engineering Fracture Mechanics, 1996, Vol. 55. 831-857.
[70] Structural damage identifica tion in plates using spectral strain energy analysis. W.L. Bayissa, N. Haritos. s.l. : Journal of Sound and Vibration, 2007, Vol. 307. 226 – 249.
[71] Dama ge identification in a lightly reinforced concrete beam based on changes in the power spectral density. Rathish P. Kumar, T. Oshima, S. Mikami, Y. Miyamori, T. Yamazaki. 8, s.l. : Structure and Infrastructure Engineering, 2012, Vol. 8. 715–727.
[72] Proposing A New Feature for Vibration Based on The Appearance of Harmonic Frequency. QuangThanh-Nguyen, KieuNhi-Ngo, BaoToan-Pham. 1, s.l. : International Journal of Emerging Technology and Advanced Engineering, 2016, Vol. 6. 272-282. [73] Construction methods and results of power spectral analysis of
vibration caused by the life traffic , Ngô Kiều Nhi, Lê Bảo Quỳnh, Nguyễn Ngọc Hải, Phạm Bảo Toàn, Nguyễn Quang Thành, National Conference 6th Electronic Engineering - VCM-2012, pp. 256-264 [74] Ability to Use Data Actual vibration in Engineering Systems