International Journal of Emerging Technology and Advanced Engineering
Website: www.ijetae.com (ISSN 2250-2459, ISO 9001:2008 Certified Journal, Volume 7, Issue 10, October 2017)
125
Spectroscopic and Laser Induced Second Harmonic Generation
Studies in TiO
2
Doped Li
2
O-Al
2
O
3
-B
2
O
3
Glass System
A.
Prabhakar Reddy
1, M. Chandra Shekhar Reddy
2, B. Appa Rao
1*, and N. Veeraiah
3 1Department of Physics, Osmania University, Hyderabad -500007, Telangana, India
2Department of Physics, CMR College of Engineering & Technology, Hyderabad, India
3Department of Physics, Acharya Nagrjuna University, Nagarjunanagar-522 510, A.P., India.
Abstract -The glass system of the composition 30Li2
O-(5-x)Al2O3-65B2O3:xTiO2 (with x ranging from 0 to 1.0 mol%)
were prepared. The samples were characterized by XRD, FTIR, DSC techniques. Later OA, PL, EPR and SHG measurements using Er3+ glass laser of wavelength 1540 nm
have been performed as a function of titanium concentration. The results of these studies have been spelled out the different oxidation states of titanium ions. Significant analysis of the results of this study pointed out that, when the content of TiO2 is up to about 0.8 mol%, the titanium ions exist mostly in
the tetravalent state and occupy substitutional positions in the glass network.. When the concentration of TiO2 is increased
beyond 0.8 mol%, it is observed that a part of titanium ions reduced Ti4+ to Ti3+ state; the results of nonlinear optical studies together with other spectroscopic studies were discussed in different samples and indicated that PIB of the sample with 0.8 mol% of TiO2 is the most suitable for the
applications in non-linear optical devices.
Keywords-Titanium doped alumino borate glasses ; Spectroscopic properties; PISHG
I INTRODUCTION
Optically poled oxide glasses are the materials of choice for applications in optoelectronics because of their excellent optical properties. For applications like modulators, routers or switches the amplitude of the induced electric field in the material should be strong and stable at the place of optical waveguides. The stability of electric field generated in the glass is an important factor for determining the higher harmonic generations in the glass materials.
Generally, TiO2 isused as crystallizing agent in glass
materials like borate glasses; however, by adding small quantity of titanium oxide, the enhancement of chemical durability and the glass forming ability of the glasses is predicted [1]. In the glass matrices, the Ti ions normally exist in Ti4+ state and participate with TiO4, TiO6 and also
TiO5 (comprising of trigonal bipyramids) structural units
[2,3].
Table1
Physical parameters of Li2O-Al2O3-B2O3 glasses doped with titanium ions.
Name of the sample AT0 AT2 AT4 AT6 AT8 AT10
Average MW,M(g/mol) = Total MW/100 59.3 59.26 59.21 59.17 59.13 59.08
Density ρ (g/cc) (+ 0.001) 1.858 1.821 1.792 1.765 1.729 1.692
Molar Volume Vm (MW/ρ) (+0.01) 31.92 32.54 33.04 33.52 34.2 34.92
Oxygen mole % 2.4 2.398 2.396 2.394 2.392 2.39
Oxygen Packing Density,O (gm atom/L) (+0.01) 75.19 73.69 72.52 71.42 69.94 68.44
Ti+4 ion concentration,N
i (×1021/cc) (+0.01) 0 0.15 0.29 0.43 0.56 0.69
Inter ionic distance,Ri (AO) (+0.01) 0 18.82 15.11 13.25 12.13 11.32
Cutoff Wavelength λ cut off (nm) (+1) 309.7 334.95 339.11 346.32 349.08 349.92
Optical Bandgap Energy Eopt (ev)(+0.005) 3.89 3.84 3.72 3.49 3.24 3.44
Urbach Energy ΔE (eV)(+ 0.001) 0.185 0.202 0.287 0.405 0.439 0.58
Refractive index(n) (+0.01) 2.19 2.2 2.23 2.28 2.34 2.29
Molar Refraction (RM)(+0.01) 17.83 18.27 18.82 19.55 20.48 20.46
Polarizability (αe)(×10-24) (cm3)(+0.01) 7.07 7.25 7.46 7.75 8.12 8.11
Polaran radious (Rp) (A0) 0 0.76 0.61 0.53 0.49 0.46
Field strength Fi (10
16
International Journal of Emerging Technology and Advanced Engineering
Website: www.ijetae.com (ISSN 2250-2459, ISO 9001:2008 Certified Journal, Volume 7, Issue 10, October 2017)
[image:2.612.80.539.145.287.2]126
Fig.1. The principal set-up used for second harmonic generation measurement
There are reports revealing that in some glass network, these ions may also exist in Ti3+ state [4,5]. The Ti4+ ions in alkali oxy borate glasses are expected to improve the non-linear optical properties to the larger extent, since the unfilled or empty d-shells of these ions strongly contribute to the linear poarizabilities . The contribution of non-linear polarizability of the d -orbital is usually found to be more for the compounds of bond lengths less than 2Å [6] ;the Ti–O bond length is estimated to be 1.96 Å [7]. The glasses containing are predicted to exhibit negative non-linear refractive index that generates self-focusing radiation beam in the material; hence NLO devices with such chemical compounds can operated at a smaller input power, in accordance with a literature survey[8,9].
The introduction of IIIA group elemental oxides like In2O3, Ga2O3 and Al2O3 is presumed to improve the
physical properties of alkali borate glass matrix to a substantial extent and is further supposed to increase the range of practical utility of these glasses. Out of the above mentioned sesquioxides, Al2O3 into glass network with
AlO4 structural units and cross-links the neighboring borate
chains. As a result substantial enhancement of the chemical durability of these glasses is anticipated. Further, aluminium oxide when introduced in to the glass matrices, it increases the glass transition temperature (Tg), reduce the
thermal expansion coefficient and also makes the glasses more resistant to attack by alkali metal ions like Li+, Na+ etc.,[10]. Li2O is a traditional modifier oxide, which
penetrates in to the glass network by disrupting cross linkages. Normally the oxygen ions break the local symmetry while the Li ions occupy the interstitial positions [11].
In the present investigation, we have synthesized Li2OAl2O3B2O3 glasses, with different concentrations of
TiO2 and characterized them by a variety of techniques
(viz., XRD, DSC, FTIR, EPR) and later studied photoluminescence and photo-induced changes and the obtained results were correlated with the variations in the glass structure
Fig. 2. Variation of oxygen packing density of Li2O-Al2O3
-B2O3 :TiO2 glasses.
II EXPERIMENTAL
The detailed compositions of the glasses used in the present study are::
AT0: 30Li2O-5Al2O3-65B2O3
AT2: 30Li2O-4.8Al2O3-65B2O3:0.2 TiO2
AT4: 30Li2O- 4.6Al2O3-65B2O3:0.4 TiO2
AT6: 30Li2O- 4.4Al2O3-65B2O3:0.6 TiO2
AT8: 30Li2O- 4.2Al2O3-65B2O3:0.8 TiO2
[image:2.612.328.571.391.553.2]International Journal of Emerging Technology and Advanced Engineering
Website: www.ijetae.com (ISSN 2250-2459, ISO 9001:2008 Certified Journal, Volume 7, Issue 10, October 2017)
[image:3.612.53.348.161.462.2]127
Table 3
Summary of data on the positions of various IR bands for the Li2
O-Al2O3-B2O3 :TiO2 glasses.
Glass BO3 units
(cm-1) BO4 (cm-1 ) units B-O-B/B-O-Ti/ AlO4 (cm-1) AlO6 (cm -1)
AT0 1508 1050 691 487
AT2 1496 1056 697 470
AT4 1494 1060 705 461
AT6 1486 1071 708 456
AT8 1481 1076 712 430
AT10 1494 1060 706 470
Table 2
Summary of the data on differential scanning calorimetric studies of Li2O-Al2O3-B2O3 :TiO2 glasses.
Sample Tg(K) Tc(K) Tm(K) Tc-Tg(K) Tm-Tc(K) Tc-Tg/Tm-Tc ∆H(J/g) ∆Cp(J/g K)
AT0 634.4 921 1100 286.6 179 1.601 191.3 0.229
AT2 739.6 892 1100 152.4 208 0.732 208.4 0.986
AT4 739.8 912 1120 172.2 208 0.827 219.6 1.509
AT6 738 888 1100 152 212 0.707 295 1.512
AT8 634.3 888 1100 253.7 212 1.196 295.7 1.529
AT10 734.4 893 1100 154.6 207 0.746 276.8 1.198
Fig. 3. X- ray diffraction patterns of Li2O-Al2O3-B2O3
glasses doped with titanium ions
The resultant bubble free melt was then poured in a brass mould and subsequently annealed at 3000C for 2 hrs. The samples prepared were mechanically ground and polished. The final dimensions of the samples used for the measurements are about 1 cm × 1 cm × 0.2 cm. For XRD, FTIR, DSC and EPR studies the obtained glasses were rendered into fine powders using pestle and mortar. The density d of the glasses was determined by the standard Archimedes’ principle of using o-xylene (99.99% pure) as the buoyant liquid. To evaluate the density, mass of the all samples were measured with the help of Ohaus digital balance model AR2140. Refractive index (n
d) of the
samples was measured (at λ=589.3 nm) using an Abbe refractometer with mono bromo naphthalene as the contact layer between the glass and the refractometer prism.
The X-ray diffractograms of all the samples were recorded on mini flex Rigaku diffractometer with Cu-Kα
radiation. The FTIR transmission spectra of these glasses were recorded using a Perkin Elmer Spectrometer in the spectral range 400–1600 cm−1. Using JASCO Model V-670 UV-VIS-NIR spectrophotometer, we have recorded the optical absorption spectra of the samples in the wavelength range between 300-700 nm. The emission, excitation and decay measurements of Ti+4 doped glasses were recorded on a Jobin-Yvon Fluorolog-3 spectrofluorimeter using xenon arc lamp (450 W) as an excited source.
Electron paramagnetic resonance (EPR) spectra of powder samples of all compositions were recorded at room temperature using JEOL JESTE 100 spectrometer in the
frequency range of 8.8–9.6 GHz. Differential thermal analysis was carried out by Netzsch, simultaneous DSC/TG thermal analyzer STA409C with 32-bit controller to determine the glass transition temperature and crystalline peaks. High temperature furnace along with a sample carrier suitable for CP measurements and Al2O3 crucibles were
[image:3.612.315.582.475.565.2]International Journal of Emerging Technology and Advanced Engineering
Website: www.ijetae.com (ISSN 2250-2459, ISO 9001:2008 Certified Journal, Volume 7, Issue 10, October 2017)
128
Fig.4.(a) DSC traces of Li2O-Al2O3-B2O3 :TiO2 glasses.
Fig.4.(b) DSC patterns of all samples recorded at higher temperatures glasses.
The method of measuring of second order optical susceptibility [12] consists of recording the power of the output spectrally separated second-harmonic wave generated (SHG) intensity for the dc-poled sample as a
International Journal of Emerging Technology and Advanced Engineering
Website: www.ijetae.com (ISSN 2250-2459, ISO 9001:2008 Certified Journal, Volume 7, Issue 10, October 2017)
129
recorded after the achievement of sample’s maximal polarization which corresponds to the applied electrostatic strength 4 kV/cm.The incident beam of the 10 ns Er3+: glass laser (of wavelength 1540 nm with power densities ranging successively up to 1.5 GW/cm2 per pulse and frequency repetition about 10 Hz) was used as fundamental laser beam. After 3–4 min of such treatment the dc-induced signal of the SHG started acquiring intensity and got saturated within several minutes and finally the output SHG value was recorded. As a reference samples crystals of BiB3O6 with the known values of second order
susceptibilities were used. The details of the apparatus used for measuring the SHG are given in Fig. 1.
Table 4
Summary of data on the positions of various IR bands for the Li2O-Al2O3-B2O3 :TiO2 glasses.
Sample
Cut-off wavelength
(nm)
2B2g→2B1g (nm)
2B2g→2A1g (nm)
Optical band gap
(eV)
ATO 309.68 - - 3.89
AT2 334.95 496 660 3.84
AT4 339.11 501 662 3.72
AT6 346.32 505 663 3.49
AT8 349.08 504 660 3.24
AT10 349.92 508 664 3.44
III RESULTS
From the measured values of the density and average molecular weight M of the samples, various other physical parameters such as molar volume V
m, oxygen packing
density O, titanium ion concentration Ni, mean titanium ion
separation Ri, polaron radius Rp, Field strength Fp in Li2
O-Al2O3-B2O3:TiO2 glass samples are evaluated using
standard equations[13] and using the refractive index, various other optical parameters viz., molar refractiion (R
m), electronic polarizability (αe) have also been computed
and presented in Table 1. The density of the samples is observed to decrease slightly with the concentration of TiO2. This may be due to the alteration of geometrical
configurations of the glass network, change in coordination and the variation of dimensions of the interstitial holes. It was observed that, with the increase in the concentration of Ti4+ ions(Fig.2),the oxygen packing density decreases. Such a decrease indicates a corresponding decrease in the structural compactness of the samples. The specific refraction contributes the average molar refraction of the samples and calculated using Lorentz-Lorentz equation which represents polarizability [14-17].
Rm= Vm n n . 2 1 2 2 …… (1) where V
m is molar volume and n is the refractive index.
When the material is exposed to intense light beams, the electronic polarization causes the optical non linearity.
Rm= Vm
n n . 2 1 2 2
= NAe 3 4
……….(2)
where α
e is the molar electronic polarizability in Å 3
and R
m
is molar refraction in cm3 and NA is the Avogadro number.
By rearranging the terms, we can write electronic polarizability A M e N R 4 3 ………….. (3)
Polaron radius Rp (Å) =
3 / 1 6 2 1 i N ...(4)
Using oxidation number (Z) and the polaron radius (Rp),
we have evaluated the field strength (Fi) of dopant ion
Fi = 2
p
R Z
……..(5)
By applying Eqs,(1) to (5), various physical parameters of Li2O-Al2O3-B2O3 :TiO2 glasses calculated and are
presented in Table 1.
Fig 3. Represents the X-ray diffraction patterns of all the samples. The non attendance sharp peaks in the diffraction pattern conformed the amorphous nature of the samples.
In Figs.4(a) and Fig.4(b), differential scanning calorimetric (DSC) scans are presented for Li2O-Al2O3
-B2O3 glasses doped with different TiO2 contents recorded
in the temperature region 300–1100 K. All DSC traces exhibited typical glass transitions Tg (glass transition
temperature) with the inflection point between 634 K and 734 K followed by an exothermic peak Tc (crystallization
peak temperature) in the temperature range 880930 K due to the crystal growth followed by an endothermic effect about 1100 K due to the melting effect Tm (melting
International Journal of Emerging Technology and Advanced Engineering
Website: www.ijetae.com (ISSN 2250-2459, ISO 9001:2008 Certified Journal, Volume 7, Issue 10, October 2017)
130
to weak endothermic of all the samples appear to be almost similar but it is interesting that glass transition temperatures exhibited an oscillating behavior with increase in the content of the TiO2. The summary of the data related toDSC studies is presented in Table 2. Normally, the change in the enlarged cross-link density of numerous structural groups and proximity of packing are accountable for such variation of Tg parameter. The lower value of the Tg
[image:6.612.48.283.293.681.2]observed for the AT8 sample clearly suggests that the structural degree of disorder is greater in this sample.
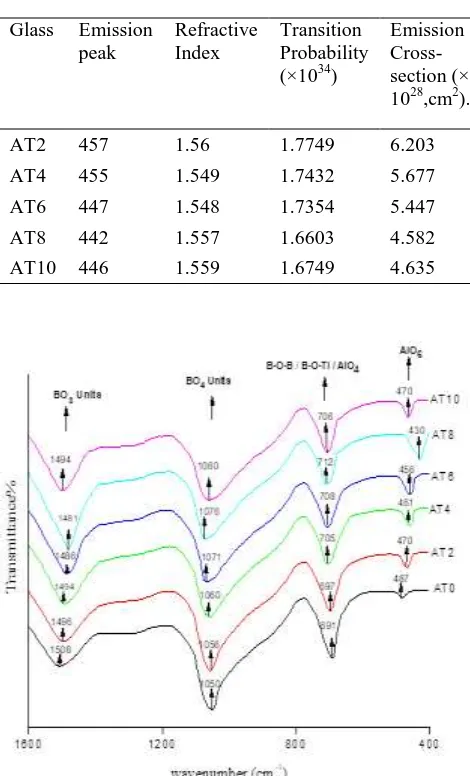
Table 5
Transition probability and emission cross-section of Li2
O-Al2O3-B2O3 glasses
Glass Emission peak
Refractive Index
Transition Probability (×1034)
Emission Cross-section (× 1028,cm2).
AT2 457 1.56 1.7749 6.203
AT4 455 1.549 1.7432 5.677
AT6 447 1.548 1.7354 5.447
AT8 442 1.557 1.6603 4.582
AT10 446 1.559 1.6749 4.635
Fig .6.Optical absorption spectra of Li2O-Al2O3-B2O3
:TiO2 glasses.
Fig. 5 displays the infrared transmission spectra of the Li2O–Al2O3–B2O3: TiO2 glasses containing different
concentrations of TiO2 recorded at room temperature. The
spectra exhibited conspicuous bands related the vibrations of various borate structural units in regions 1200–1600 cm−1, 900–1050 cm−1 and another band at about 698 cm−1. It is widely known that by adding alkali oxides into B2O3
glasses, the transformation of sp2 planar BO3 units into
more stable sp3 tetrahedral BO4 units, and creation of
non-bridging oxygens may also be happened. Establishment of long tetrahedron chains formed due to each BO4 unit is
linked to two such other units, and one oxygen from each unit with a metal ion. The first array of bands is analysed as being due to the B-O bond stretching relaxation of the trigonal BO3 units, while the second array of bands
referred to BO4 units and the band at 698 cm−1 is identified
as being due to the vibrations of bending modes of B–O-B linkages in the borate network [18,19]. There is a chance for the producing of single B-O-Ti framework. The vibrational band appeared at about 698 cm−1 in the glass network in fact may also represent the vibrations of TiO4
groups [20] by recalling earlier studies on the IR spectra of various other galsses containg TiO2. Hence, the bond at
698 cm−1 may be referred to common vibrations of B-O-Ti linkages, in the same region [21], tangentially AlO4
structural units also exhibit a band with the vibrational frequency of Al-O stretchings . Therefore, it is quite likely that tetrahedral Al ion to cross-link with the neighbouring borate units also. Subsequently, it is assumed that Li2
O-Al2O3-B2O3 glass network mixed with Al2O3 consisting to
be of B-O-Al linkages. The existence of such linkages in the chain of the glass may increase rigidity of the glass network. The summary of the data on various bands observed in the IR spectra of Li2OAl2O3-B2O3:TiO2
glasses is presented in Table 3.
Optical absorption spectra of titanium doped alumina borate glasses recorded in the in the spectral wavelength region 300–700 nm are shown in the Fig. 6. The absorption edge observed at 321 nm for sample AT0 is spectrally shifted gradually towards higher wavelength with increasing concentration of TiO2. Additionally, the spectra
of sample AT2 exhibited two clearly resolved absorption bands at approximately 500 and 660 nm. With a gradual increase in the concentration of TiO2, the half width and
International Journal of Emerging Technology and Advanced Engineering
Website: www.ijetae.com (ISSN 2250-2459, ISO 9001:2008 Certified Journal, Volume 7, Issue 10, October 2017)
[image:7.612.49.289.111.317.2]131
Fig .7. Urbech plot of Li2O-Al2O3-B2O3 :TiO2 glasses.350 400 450 500 550 600
AT10
Intensity (a.u)
Wavelength (nm)
AT8
AT6 AT4
[image:7.612.54.281.364.588.2]AT2
Fig. 8. Luminescence emission spectra of Li2O-Al2O3
-B2O3: TiO2 glasses
From the observed edges in the optical absorption spectra, we have estimated the optical band gaps (Eo) of
these samples by drawing Urbach plots (Fig. 7) between (αћω)1/2 and ћω as per the equation:
( ) (
)
( )
From an extrapolation of the linear portion of the curves of Fig. 7, the values of optical band gap (Eo) are presented
in Table 4. The value of the optical band gap is observed to be the minimum for the glass AT8.
The emission spectra of the all prepared glasses were excited at room temperature under the excitation of 360nm laser diode and are cited in Fig.8. The spectrum of the AT2 sample shown an emission band at 457 nm. As the concentration of TiO2 is increased up to 1.0 mol%, the
intensity and the half width of this band were observed to decrease.
Applying the standard formulae [22] for transition probability:
A
(
)
…… (7) and for emission cross-section,
………(8)
The pertinent data related to emission spectra are presented in Table 5. In Eq.(8), nd is the refractive index of the
sample; Δλ is the half width of the emission peak. The value of is found to be the largest for the AT2 sample, signifying higher luminescence efficiency for this sample.
Fig.9.EPR spectra of Li2O-Al2O3-B2O3:TiO2 glasses.
The EPR spectra of Li2O-Al2O3-B2O3 :TiO2 glasses
doped with different concentrations of TiO2 registered at
room temperature are shown in Fig.9. The spectrum of glass AT2 sample consists of an intense asymmetric spectral line centered at about g =1.914 and for all the sample g values are tabulated in Table 6. We can see that with the concentration of TiO2, there is a slow increase in
[image:7.612.323.560.413.613.2]International Journal of Emerging Technology and Advanced Engineering
Website: www.ijetae.com (ISSN 2250-2459, ISO 9001:2008 Certified Journal, Volume 7, Issue 10, October 2017)
132
[image:8.612.70.549.154.402.2]Fig.10. Comparison plots of the PISHG with the photo-inducing power. Inset shows the variation of PISHG with the concentration of TiO2 measured at the pump power density 0.40 GW/cm2 (λ=1540nm.
Fig. 10 represents the comparison plot of the change of photo-induced birefringence with the photo-inducing power; it is observed that a substantial increase of the PIB output with the increase of the pumping power for all the samples. The figure indicates a slow increase of PIB intensity up to 0.8 mol% concentration of TiO2, and for
further increases of TiO2 content a rapid decrease is
observed.
IV DISCUSSION
There is a complete linear decrease in the density of current glasses with the incremental mol% of TiO2. The
molar volume of the glass pattern seems to be increased, whereas the oxygen packing density is reduced with the proportional raise of titanium ion concentration. The observed increase in electronic polarizability with increase of TiO2 concentration indicates that the electron cloud is
more readily distorting with concentration of
. TiO2.
Thermal analysis of the samples suggests that the AT8 sample has low glass transition temperature Tg indicating
higher structural disorder in this sample. The variation of ∆Cp in the first endothermic peak and the enthalpy
associated with the exothermic peak is found to be increasing with the concentration of TiO2 . The rise in the
value of enthalpy with increase of Ti up to 0.8 mol% suggests that at first the crystallization begins inside the material and spreads to the surface gradually [23].
In the titled glass network, titanium ions expected to continue mainly in Ti4+ valence state but the reduction of Ti4+ to Ti3+ is inevitable during melting at high temperatures and annealing processes of the glasses. Ti4+ ions occupy both tetrahedral and substitutional octahedral sites as corner-sharing [TiO6]2- units. TiO4 and TiO6 entities
of Ti4+ ions enter the glass network and interconnected with BO4 structural units by forming linkages of the type B–O–
Ti, whereas, Ti3+ ions mainly act as modifiers and occupy only modifying positions in the glass network. Addition of large concentration of TiO6 octahedral units to the Li2
O-Al2O3-B2O3:TiO2 glasses may twist or alter the inter
connected chains of BO4 groups and increase the
randomness of the glass chain. In the FTIR spectra, with the presence of TiO2 up to 0.8 mol.% titled glass network,
the intensity of vibrational band due to BO4 groups is
observed to decrease with the shifting of meta-center (from 1050 cm−1) towards higher wave number (1076 cm−1), whereas the intensity of band due to the vibrations of BO3
groups is observed to increase with the shifting of meta-center (from 1508 cm−1) towards lower wave number
0 0.2 0.4 0.6 0.8
0.15 0.25 0.35 0.45 0.55
0.05 0.25 0.45 0.65
0 0.5 1 1.5 Conc. TiO2 (mol%)
PISHG
(pm/
V)
Input power (GW/cm2)
PISHG
(pm/
V)
AT8
AT10
International Journal of Emerging Technology and Advanced Engineering
Website: www.ijetae.com (ISSN 2250-2459, ISO 9001:2008 Certified Journal, Volume 7, Issue 10, October 2017)
133
(from 1481 cm−1) (Table 3). However, when TiO2concentration is greater than 0.8 mol.%, the intensity variation of these two bands with the concentration of TiO2
exhibited a reverse trend. In addition, the glasses exhibited bands at 691 cm−1 (identified as being due to vibrations of TiO4 groups in the case it may be assumed due to the
vibrations of B-O-B/ B-O-Ti linkages). When TiO2
concentration in the glass system is increased up to 0.8 mol% the position of the common meta center of B-O-Ti is observed to shift towards higher frequency with decreasing intensity. These observations suggest that the network of glass AT2 possesses higher concentration of linkages of type B–O–Ti and is more rigid while the disorder in the glass network goes on increasing, with the concentration of TiO2 upto 0.8 mol% . Now, it may confirm that titanium
ion exists in both Ti4+ (situated in both tetrahedral and octahedral positions) and in Ti3+ (positioned octahedral sites) states in the present glasses. Further, the spectra of all the glasses exhibited a band around 487 cm-1 which may be due to AlO6 units[24]. The intensity of vibrational band due
to these this units increased with the increase in the concentration of TiO2 up to 0.8% and the meta-center
shifted towards lower wavelength side and for further increase of TiO2 concentration it is decreased.
The two clearly resolved absorption bands observed in the optical absorption spectra of AT2 to AT10 at 500 and 660 nm are identified as being due to 2B2g→ 2B1g and 2B2
→ 2A
1g transitions of 3d1 electron of the Ti3+ ions in
tetragonal distorted octahedral sites [25 – 27]. The highest intensity of these bands was recognized in the spectrum of glasses AT8; this observation indicates the highest concentration of such Ti3+ ions in this glass matrix. The near absence of these bands in the spectrum of the glass AT2 apparently indicates the non-existence of Ti3+ ions in this glass.
Blasse [28] comprehensive study on closed –shell transition metal complexes containing titanium suggests that titanium ions exhibit luminescence in both octahedral and tetrahedral complexes. Howsoever, the octahedral complexes of substitutionally positioned Ti4+ ions establishes much greater luminescence efficiency than that of tetrahedral complexes. The luminescence band is referred to radiative reincorporation of self-trapped excitons (STEs) confined on a substitutionally positioned octahedral Ti4+ions. The credible mechanism for this noticed emission band can be explained in a more elaborated way as follows. The valence band of this type of material is normally formed by 2p orbitals of O2- ions. The glass sample must contain octahedrally positioned substitutional titanium (Ti4+) ions with (TiO6)8-structural
units [29]. Charge transfer from O2- enters into the unfilled 3d orbital of Ti4+ ion reducing it into the Ti3+ state. The trapped d electrons when excited interact with the lattice vibrations by electron–phonon interaction. The energy relaxation after photo excitation promotes the spatial separation of electron–hole pairs shown Fig.11. In the samples containing a low concentration of substitutional titanium (Ti4+) ions in the glass network either an electron or a hole is weakly localized indicates the TiO2
concentration dependence of the luminescence.
The EPR spectra for Li2O-Al2O3-B2O3 :TiO2 glasses
under investigation are shown in Fig. 9; the spectra of glass AT2 exhibit a weak asymmetric signal with g = 1.914 due to 3d1 unpaired electron of Ti3+ ions in a tetragonally distorted octahedral field [30]. The considerable intensity of the signal is observed in the spectra of all the glasses ,with further increase in the content of TiO2 up to 0.8
[image:9.612.327.562.431.580.2]mol.% a gradual increase in the half-width of the signal is observed after which it is seen to decrease. It indicates a growth of concentration of Ti3+ ions in the glass network. The presence of such Ti3+ ions may weaken the glass network. The weak intensity of the signal is observed for glass AT2 clearly indicates the presence of very low concentration of these ions in this glass.
Fig 11. Proposed mechanism for PL emission.
International Journal of Emerging Technology and Advanced Engineering
Website: www.ijetae.com (ISSN 2250-2459, ISO 9001:2008 Certified Journal, Volume 7, Issue 10, October 2017)
134
variety of other experimental results denotes that among various glass samples, the Li2O-Al2O3-B2O3 :TiO2 glasssample with 0.8 mol.% of TiO2 is a good candidate for the
applications in non-linear optical devices. 5. Conclusions
The absence of peaks in XRD reveals all samples prepared are amorphous in nature. The results of DSC suggests that the sample AT8 exhibits low Tg value which
is suggestive of more disordered structure .The IR spectral studies indicated that boron, aluminum, and titanium ions participate in the glass network BO3, BO4, B-O-B, B-O-Ti,
AlO4, AlO6 structural units. Further, these results also
pointed out that the concentration of more orderly structural units viz.,BO4, AlO4 (which make the glass
network more rigid), is low in the network for the sample AT8. The optical absorption and EPR studies of the titled glass system indicated the presence of the trivalent Ti ions in addition to tetravalent state. However, in the sample containing TiO2 beyond 0.8 mol% of the titanium exist
predominantly in Ti4+ state Photoluminescence spectra of thee samples excited at wavelengths corresponding to their absorption edges exhibited a broad emission band in the visible region. The excitation of substitutionally positioned octahedral Ti4+ ions are identified to be responsible for the observed luminescence emission. The experiments on PIB indicated an increasing intensity of SHG signal with increase in the concentration of TIO2 and this result is
correlated with simultaneous red shift in the optical band gap observed. This observation allows us to conclude that the surrounding ligands of octahedrally positioned titanium ions play the principal role in the observed PISHG.
ACKNOWLEDGMENTS
I would like to gratefully and sincerely thank both Prof. I.V Kytyk, Institute of Optoelectronics and Measuring Systems, Electrical Engineering Department, Czestochowa University of Technology, Aleja Armii Krajowej17/19, Czestochowa, Poland and M.Piasecki ,Institute of Physics, Jan Dlugosz University, ul. ArmiiKrajowej 13/15, 42-201 Czestochowa, Poland for providing experimental facilities for Second Harmonic Genartion measurements. Certainly, this results helped me a lot to analyze nonlinear optical studies and how it is related to my present work .With their useful discussions and continuous cooperation, I successfully brought this paper in a compete form.
REFERENCES
[1] G. Murali Krishna ,N. Veeraiah, N. Venkatramaiah, R. Venkatesan, Journal of Alloys and Compounds 450 (2008) 477–485.
[2] N. Shimoji, T. Hashimoto, H. Nasu, K. Kamiya, J. Non-Cryst. Solids 324 (2003) 50.
[3] M. Nagarjuna, T. Satyanarayana, Y. Gandhi, N. Veeraiah, Journal of Alloys and Compounds 479 (2009) 549–556.
[4] A. Paul, J. Mater. Sci. 10 (1975) 692.
[5] R.K. Brow, D.R. Tallant, W.L. Warren, A. McIntyre,D.E. Day, Phys. Chem. Glasses 38 (1997) 300.
[6] E. Lines, Phys. Rev. B 43 (1991) 11978.
[7] B.V. Raghavaiah, C. Laxmikanth, N. Veeraiah, Optics Communications 235 (2004) 341–349
[8] M. Sheik-Bahae, D.C. Hutchings, D.J. Hagan, E.W. VanStryland, IEEE J. Quantum Electron. 27 (1991) 1296.
[9] Y. Watanabe, M. Ohnishi, T. Tsuchiya, Appl. Phys. Lett.66 (1995) 3431.
[10] M. Srinivasa Reddy, G. Naga Raju, G. Nagarjuna, N. Veeraiah, Journal of Alloys and Compounds 438 (2007) 41–51.
[11] Ch. Srinvasa Rao , T. Srikumar , Y. Gandhi , V. Ravikumar & N. Veeraiah, Philosophical Magazine,Vol. 91, No. 6, 21 February 2011, 958–980.
[12] N.Narsimha Rao, I.V Kityk, V.Ravi kumar.Ch.Srinivasa Rao, M.Piasecki, P.Bragiel, N.Veeraiah, ceramics international 38(2012) 2551-2562.
[13] M.J. Weber, R. Cropp, J. Non-Cryst. Solids 4 (1981) 137. [14] H.A. Lorentz, Ann.Phys 9 (180) 641.
[15] L. Lorentz, Wiedm. Ann 11 (1881) 70.
[16] V.Dimitrov, T. Komatsu, Journal of the University of Chemical Technology and Metallurgy 45 (2010) 219.
[17] M.Chandra Shekar Reddy, E.Ramesh Kumar, B.Appa Rao, International Journal of Scientific & Engineering Research,5(2014)232.
[18] F.A. Khalife, H.A. El Batal, A.A. Zooz, Ind. J. Pure Appl. Phys. 36 (1998) 314.
[19] M.R. Reddy, S.B. Raju, N. Veeraiah, J. Phys. Chem. Solids 61 (2000) 1567.
[20] Hui-Fen Wu,Chung-Cheng Lin,Pouyan Shen, J. Non-Cryst. Solids 209 (1997) 76
[21] H.L. Rutz, D.E. Day, C.F. Spencer, J. Am. Ceram. Soc. 73 (1990) 1788.
[22] M. Kumar, A. Uniyal, A.P. S. Chauhan and S.P. Singh, Bull. Mater. Sci. 26 (2003) p.335.
[23] F. Branda, A. Buri, A. Marotta, S. Saiello, Kinetics of crystal growth in Na2O_2SiO2 glass. A DTA study, Thermochim. Acta 77 (1984) 13–18.
[24] Y. Gandhi, M. V. Ramachandra Rao, Ch. Srinvasa Rao, T. Srikumar, I. V. Kityk, and
N. Veeraiah,Journal of Applied Physics 108, 023102 (2010)
[25]N. Shimoji, T. Hashimoto, H. Nasu, K. Kamiya. J Non-Cryst Solids 2003;324:50.
[26] X Zhu, Q Li, N Ming, Z Meng. Appl Phys Lett 1997;71:867. [27] A Aboukais, LD Bogomolova, AA Deshkovskaya, VA Jachkin, NA
Krasil Nikova, SV Stefanovsky, EA Zhilinskaya. Opt Mater 2002;19:295.
[28] G. Blasse, Struct. Bond. 42 (1980) p.1.
[29] M. Watanabe and T. Hayashi, J. Lumin. 112 (2005) p.88.