reviews
reports
deposited research
interactions
information
refereed research
Jennifer Harrow*
1
, France Denoeud
1†
, Adam Frankish*
1
,
Alexandre Reymond
1‡§
, Chao-Kung Chen*, Jacqueline Chrast
§
,
Julien Lagarde
‡
, James GR Gilbert*, Roy Storey*, David Swarbreck*,
Colette Rossier
‡
, Catherine Ucla
‡
, Tim Hubbard
†
, Stylianos E Antonarakis
‡
and Roderic Guigo
†¶
Addresses: *Wellcome Trust Sanger Institute, Wellcome Trust Campus, Hinxton, Cambridge CB10 1SA, UK. †Grup de Recerca en Informatica
Biomedica, Institut Municipal d’Informatica Medica-Universitat Pompeu Fabra, Pg. Maritim de la Barceloneta, 08003 Barcelona, Catalonia, Spain. ‡Department of Genetic Medicine and Development, University of Geneva Medical School and University Hospitals of Geneva,
Geneva, Switzerland. §Center for Integrative Genomics, University of Lausanne, Lausanne, Switzerland. ¶Centre de Regulacio Genomica, Pg.
Maritim de la Barceloneta, 08003 Barcelona, Catalonia, Spain. 1These authors contributed equally to this work.
Correspondence: Jennifer Harrow. Email: [email protected]
Published: 7 August 2006
GenomeBiology2006, 7(Suppl 1):S4
The electronic version of this article is the complete one and can be found online at http://genomebiology.com/2006/7/S1/S4
© 2006 Harrow et al.; licensee BioMed Central Ltd.
This is an open access article distributed under the terms of the Creative Commons Attribution License (http://creativecommons.org/licenses/by/2.0), which permits unrestricted use, distribution, and reproduction in any medium, provided the original work is properly cited.
Abstract
Background: The GENCODE consortium was formed to identify and map all protein-coding genes within the ENCODE regions. This was achieved by a combination of initial manual annotation by the HAVANA team, experimental validation by the GENCODE consortium and a refinement of the annotation based on these experimental results.
Results: The GENCODE gene features are divided into eight different categories of which only the first two (known and novel coding sequence) are confidently predicted to be protein-coding genes. 5’ rapid amplification of cDNA ends (RACE) and RT-PCR were used to experimentally verify the initial annotation. Of the 420 coding loci tested, 229 RACE products have been sequenced. They supported 5’ extensions of 30 loci and new splice variants in 50 loci. In addition, 46 loci without evidence for a coding sequence were validated, consisting of 31 novel and 15 putative transcripts. We assessed the comprehensiveness of the GENCODE annotation by attempting to validate all the predicted exon boundaries outside the GENCODE annotation. Out of 1,215 tested in a subset of the ENCODE regions, 14 novel exon pairs were validated, only two of them in intergenic regions.
Background
The complete sequence of the euchromatic region of the human genome provides a new opportunity to establish the complete catalogue of the human genes. Although auto-mated gene prediction has improved greatly over the years and the human gene count is thought to be between 20,000 and 25,000 protein-coding genes [1], defining a gene is not a trivial issue. According to classic genetics, genes are inherit-able units responsible for an associated phenotype. Although in some cases this relationship derives from mutation of non-coding DNA or regulatory elements, in most cases it is synonymous with protein-coding genes. However, in the past four years there has been an explosion in the discovery of transcripts with no apparent coding potential (termed non-coding RNAs) and there are indications these could play as important a role in cellular function as proteins [2,3].
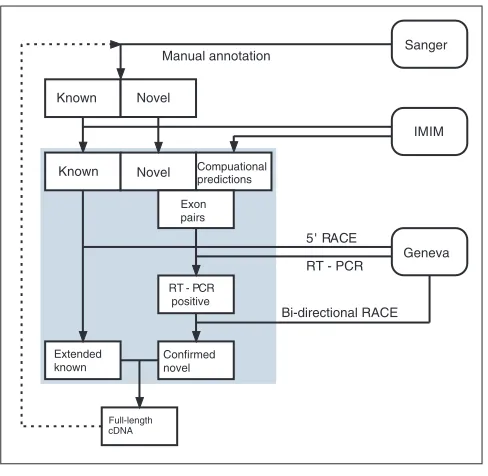
In an effort to investigate and understand all the functional elements in the human genome, the ENCODE project (Encyclopedia of DNA Elements) [4] was established. In this pilot stage, the aim of the ENCODE project is to investigate in great depth, computationally and experimentally, 44 regions totaling 30 Mb of sequence representing approxi-mately 1% of the human genome. As part of this project, the GENCODE consortium [5] was formed to identify and map all protein-coding genes within the ENCODE regions. This is achieved by a combination of initial manual annotation by the HAVANA team [6], experimental validation by the GENCODE consortium, and a refinement of the annotation based on these experimental results (Figure 1).
This annotation is used as a reference set by all the ENCODE consortium members. It also represents the standard to which the automated prediction programs were assessed during the ENCODE Genome Annotation Assessment Project (E-GASP) 05 workshop (see [7] in this issue). This report describes how the manual annotation and experimental verification were performed. It also highlights some interest-ing features in the GENCODE annotation and indicates the weaknesses of the automated predictions compared to the manual annotation.
Results and discussion
Initial classification of lociThe HAVANA group divides gene features into different categories of which only the first two (known and novel coding sequence (CDS)) are confidently predicted to be protein-coding genes. The common factor between all annotated gene structures is that they must be supported by transcriptional evidence, through homology to cDNA, expressed sequence tags (ESTs) and/or protein sequences. The following are the gene types first applied to the human chromosome 20 annotation [8] and later expanded to fully classify the annotation produced for the ENCODE project.
Known genes
Known genes are identical to human cDNA or protein sequences and identified by a GeneID in Entrez Gene [9].
Novel coding sequence
Novel coding sequences have an open reading frame (ORF) and are identical, or have homology, to cDNAs or proteins but do not fall into the above category; these mRNA sequences are submitted to public databases, but they are not yet represented in Entrez Gene or have not yet received an official gene name from the nomenclature committee [10]. They can also be novel in the sense that they are not yet represented by an mRNA sequence in the species concerned.
Novel transcripts
Novel transcripts are as above but no ORF can be unambiguously assigned; these can be genuine non-coding genes or they may be partial protein-coding genes supported by limited evidence. They should be supported by at least three ESTs from independent sources (not originating from the same clone identifier).
Putative genes
[image:2.609.313.557.85.323.2]Putative genes are identical, or have homology, to spliced ESTs but lack a significant ORF and polyA features; these are generally short two or three exon genes or gene fragments.
Figure 1
The GENCODE pipeline. This schematic diagram shows the flow of data between the three groups involved in the GENCODE consortium (HAVANA, IMIM and Geneva) to produce an experimentally verified annotation of the ENCODE region.
Known
Sanger
Novel
RT - PCR Manual annotation
Full-length
Extended known
Confirmed novel
RT - PCR positive
Geneva
Exon pairs
IMIM
Compuational predictions
Novel Known
Bi-directional RACE 5' RACE
Pseudogenes
Pseudogenes (assumes no expressed evidence) have homology to proteins but generally suffer from a disrupted CDS and an active homologous gene can be found at another locus. This category can be further subdivided into proces-sed or unprocesproces-sed pseudogenes. Sometimes these entries have an intact CDS or an open but truncated ORF, in which case there is other evidence used (for example genomic polyA stretches at the 3’ end) to classify them as a pseudogene.
Transcribed pseudogenes
Transcribed pseudogenes are not currently given a separate tag within GENCODE and are handled by creating a pseudogene object and an overlapping transcript object with the same locus name.
TEC (To be experimentally confirmed)
To be experimentally confirmed (TEC) is used for non-spliced EST clusters that have polyA features. This category has been specifically created for the ENCODE project to highlight regions that could indicate the presence of novel protein coding genes that require experimental validation, either by 5’ rapid amplification of cDNA ends (RACE) or RT-PCR to extend the transcripts or by confirming expres-sion of the putatively encoded peptide with specific antibodies.
Artefact gene
Artefact gene is used to tag mistakes in the public databases (Ensembl/SwissProt/Trembl). Usually, these arise from high-throughput cDNA sequencing projects, which submit automatic annotation sometimes resulting in erroneous CDSs that are, for example, 3’ untranslated regions (UTRs).
GENCODE annotation of the ENCODE regions
The first release of the annotation of the 44 ENCODE regions was frozen on 29 April 2005 and was used in the E-GASP workshop. It contained 416 known loci, 26 novel CDS loci, 82 novel transcript loci, 78 putative loci, 104 processed pseudogenes and 66 unprocessed pseudogenes. The current version (release 02) was frozen on 14 October 2005. It contains 411 known loci, 30 novel CDS loci, 81 novel transcript loci, 83 putative loci, 104 processed pseudogenes and 66 unprocessed pseudogenes. The gene content has changed as a result of the experimental validation (see next section). In total, 2.9% of the nucleotides in the ENCODE regions (both strands considered separately) are covered by annotated exons (1.2% by coding and 1.7% by UTRs and non-coding), and 31% are transcribed (covered by annotated exons or introns).
Multiple transcripts are annotated at any locus where supporting evidence is available. Thus, the 487 compiled GENCODE reference loci set (compiled from coding and experimentally verified loci) corresponds to 2,608 trans-cripts, of which 1,097 are coding. Of the coding loci (known and novel CDS), 78% have alternative splice forms (86% of
the multi-exon gene loci), with an average of 5.7 variants per locus. Of the coding variants, approximately 70% have a complete CDS (the remainder are partial); 54% of the coding loci have alternative CDS, indicating that diversity is lower at the protein level than at the transcript level as a substantial proportion of the alternative splice forms affect only the
UTRs. The RNPC2 (RNA-binding region (RNP1, RRM)
containing 2) gene has 37 variants, which is the highest number in the ENCODE regions, of which only 6 are annotated as coding.
Experimental verification of GENCODE annotation
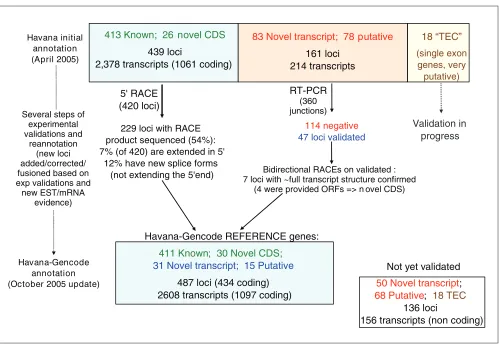
The initial HAVANA annotation was submitted for experi-mental verification (Figure 1). First, 5’ RACE in 12 different tissues was employed to confirm that annotated coding genes (within both known and novel CDS locus categories) had been extended as far as possible towards the trans-criptional start site, to exclude the possibility of additional exons in their 5’ UTR and identify a representative full-length transcript for each locus. Of the 420 coding loci tested, 229 RACE products could be sequenced. They sup-ported 5’ extensions of 30 loci (extension of the first exon in two-thirds of the cases, new 5’ exons in one-third of the cases) and new splice variants (not extending the 5’ end) in 50 loci.
Second, RT-PCR in 24 tissues was used for verifying trans-cript (novel and putative) structures by checking the splice junctions. All 360 splice junctions in the 161 novel and putative transcript loci were tested. Of those tested, 47 loci were validated, consisting of 31 novel and 15 putative trans-cripts. As expected, the success rate of RT-PCR was higher for the ‘novel transcripts’ (37%) than for the putative transcripts (19%). Bidirectional RACE was carried out for transcript loci with successfully validated splice junctions. This supported seven loci over their full length but did not extend them.
Third, all annotated non-canonical sites (that is, all introns not conforming to the AG-GT or AG-GC rule) were tested by RT-PCR on 24 tissues. Of the annotated splice sites, 98% are canonical GT-AG and an additional 0.9% are GC-AG. There are 0.2% of AT-AC splice sites, most of them corresponding to canonical U12 introns [11]. Other non-canonical splice sites occur in the remaining 0.9% of the introns. Among 90 non-canonical splice sites tested by RT-PCR in 24 tissues, 78 reactions were negative, 11 provided other canonical junctions (most of them already annotated in other splice forms), and only 1 was confirmed (CT-TG). The very low level of success of the RT-PCRs on non-canonical splice sites in 24 tissues suggests that these events may be artifactual. As a control, we performed RT-PCR on 24 tissues (see Materials and methods) on 96 randomly selected exon pairs from within the GENCODE annotation. After sequencing of the amplimer, the annotated exon pair was confirmed in 84 cases (87%) in at least one tissue. This is essentially the
comment
reviews
reports
deposited research
interactions
information
expected result, given the fact that many alternative splice forms in GENCODE are likely to have a restricted expression pattern, and may not be represented in the 24 tissues tested.
Figure 2 summarizes the process of annotation, experi-mental validation and reannotation that has occurred since the original release of the GENCODE annotation in April and its current update in October 2005.
Assessing completeness of the GENCODE annotation
To examine whether the manual annotation had missed any coding loci, RT-PCR reactions in 24 tissues were also carried out for splice junctions from all those gene objects predicted by a panel of automated gene prediction algorithms before the E-GASP workshop (Geneid [12], Genescan [13], Twinscan [14], SGP [15], Fgenesh [16], Exonify [17], Acembly [18] Ecgene [19], Ensembl EST [20]) that lie outside a HAVANA annotated gene in 13 of the 44 ENCODE regions (corres-ponding to the training regions for which the annotations were released before the E-GASP predictions submission deadline). Of the 1,215 exon pairs tested, only 14 (1.2%)
produced a positive result, 9 of which perfectly predicted exon boundaries and 5 with displaced exon boundaries (8 other positive RT-PCRs were falling in 2 pseudogene loci). Among the 14 positive validated junctions, 8 were new splice forms internal to annotated loci, 4 were new splice forms extending annotated loci, and only 2 were completely inter-genic to any annotation. These results suggest that the GENCODE gene set was relatively complete. It was then updated to include the new splice forms/loci suggested by these experiments.
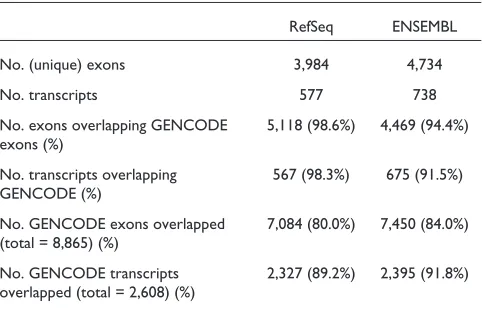
[image:4.609.56.557.82.433.2]To further assess the completeness of the GENCODE annotation, we have compared it with other publicly available and widely used human gene sets: RefSeq [21] and ENSEMBL [22]. These gene sets were downloaded from the UCSC genome browser in November 2005. Table 1 shows the overlap between these sets and GENCODE by at least one bp: 99% of RefSeq, and 94% of ENSEMBL exons overlap GENCODE exons. In contrast, only 80% and 84% of the GENCODE exons overlap RefSeq and ENSEMBL exons, respectively.
Figure 2
Experimental validation of HAVANA annotation. ‘Known’ and ‘Novel_CDS’ were submitted to 5’ RACE, and ‘Novel transcript’ and ‘Putative’ loci were submitted to RT-PCR on all their exon junctions, followed by bi-directional RACE. Several steps of reannotation were performed during the process of experimental verification: the figure shows the update of the annotation between the first release in April 2005 and the release from October 2005.
Havana initial annotation (April 2005)
413 Known ; 26 novel CDS
439 loci
2,378 transcripts (1061 coding)
83 Novel transcript ; 78 putative
161 loci 214 transcripts
18 “TEC”
(single exon genes, very
putative)
5' RACE (420 loci)
RT-PCR (360 junctions)
Validation in progress Several steps of
experimental validations and
reannotation (new loci added/corrected/ fusioned based on exp validations and
new EST/mRNA evidence)
Bidirectional RACEs on validated : 7 loci with ~full transcript structure confirmed
(4 were provided ORFs => n ovel CDS) 114 negative
47 loci validated
229 loci with RACE product sequenced (54%): 7% (of 420) are extended in 5'
12% have new splice forms (not extending the 5'end)
Havana-Gencode annotation (October 2005 update)
411 Known ; 30 Novel CDS ;
31 Novel transcript ; 15 Putative
487 loci (434 coding) 2608 transcripts (1097 coding) Havana-Gencode REFERENCE genes:
50 Novel transcript ; 68 Putative ; 18 TEC
136 loci
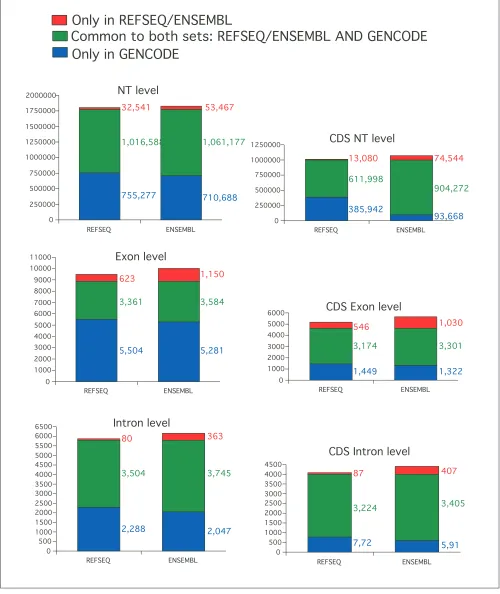
Figure 3 illustrates the comparisons at exact exon/intron level. Although the exact agreement between GENCODE on the one hand, and RefSeq and ENSEMBL on the other, is lower than when considering one base overlap, the same trend is observed: 84% (3,361/3,984) of RefSeq and 76% (3,584/4,734) of ENSEMBL exons are included in the GENCODE set, but only about 40% of the GENCODE exons are included in RefSeq or ENSEMBL.
As illustrated by Figure 3, the exact agreement is larger for exons than for introns, which suggests that the disagree-ments are mostly found at the terminal exons, which is also reflected in the fact that the agreement is also larger for the subset of coding than for the set of all exons. In summary, the comparison shows that GENCODE contains most of the features from RefSeq and ENSEMBL but has more unique exons than the two sets, which is reflected by its high number of alternative splice forms.
Investigation of ENCODE regions that are problematic for automatic annotation
The gene prediction algorithms that performed most successfully in the E-GASP evaluation workshop when compared to the manual annotation were the ones that used alignments of expressed sequences to produce their gene predictions (see [7] in this issue). However, even the most successful methods of automated gene prediction achieved a maximum sensitivity of 70% at the gene level (where at least one coding transcript exon/intron structure was correctly predicted) and 45% at the transcript level (where all alter-natively spliced variants were correctly predicted). There are several reasons for this. Some incidences of missed genes could be explained by the lack of high identity transcript evidence; for example, many of the olfactory receptor genes in ENm009 (Figure 4f) lack good transcript and protein support [23]. Another example is the ANKRD43 locus in ENr221, where partial coverage of the gene with human mRNA produces truncated automated predictions. However,
cross-species evidence supports an extended protein-coding gene (Figure 4c). In other cases, predictors fail to make a correct prediction even though a full length transcript with perfect sequence identity is present in the databases (for example, Pairagon at the TRIM22 locus in ENm009; Figure 4b). There are also examples where the predictions differ from the manual annotation gene structure, even though they use the same supporting evidence, because of problems with automated alignment (for example, Ensembl and Pairagon at the MAP3K1 locus in ENr221; Figure 4a). A problem that appears to be associated with tandem duplicated gene clusters is the linking together of adjacent loci. The predicted transcript uses consecutive exons from more than one locus, for example for a six exon gene taking exons 1 and 2 from locus A, 3, 4 and 5 from locus B and 6 from locus C. Because the equivalent exons of the different copies of the gene are very similar (often identical), the resulting predicted transcript is an elongated structure usually covering multiple loci (for example, AceView at the HBG1/HBG2 loci in ENm009).
Another observation is that there are predictions that have an identical intron/exon structure to the manual annotation but have a different CDS. In such cases, the CDS has either a 5’ extension, that is, completely matches the GENCODE CDS but uses an upstream translation initiation codon (most often non-ATG; for example, AceView at the SEPT8 locus in ENr221 and approximately 41% of AceView have a non-ATG start), or has an entirely different CDS in a different frame. The latter often results in unusual structures, with multi-exon 5’ and/or 3’ UTRs that are at odds with rules governing re-initiation [24] and nonsense mediated decay (NMD) [25] (for example, Pairagon at the AC008937.5 locus in ENr221 and AceView at the IFNAR2 locus in ENm005; Figure 4e). Many of the predictors suffer from reduced specificity as a result of over-prediction of CDSs at loci where manual annotation does not identify any CDS that can be confidently assigned. These fall into two types; the first includes CDS predicted at pseudogene loci, often where the pseudogene suffers from small but significant disablements (for example, Ensembl at the AC08730.14 locus in ENm009; Figure 4d); and the second includes the ‘rule-breaking’ types of CDSs described above (AceView at the AC008937.2 in ENr221). Almost all the predictors (with AceView the notable exception) under-predict coding (and non-coding) splice variants, most predicting one transcript per gene.
GENCODE annotation uses only primary evidence; no predictions or RefSeq entries are used to support gene structures. This has the effect of reducing the risk of propagating any errors that may be present in the databases. The gene set annotated by GENCODE is supported using evidence from all available sources, human and non-human mRNAs, ESTs and proteins. The use of non-human evidence is supported by our analysis of four exons not present in our first pass annotation identified by the UNCOVER algorithm
comment
reviews
reports
deposited research
interactions
information
refereed research
Table 1
Analysis of RefSeq and ENSEMBL ENCODE annotation compared with GENCODE
RefSeq ENSEMBL
No. (unique) exons 3,984 4,734
No. transcripts 577 738
No. exons overlapping GENCODE 5,118 (98.6%) 4,469 (94.4%) exons (%)
No. transcripts overlapping 567 (98.3%) 675 (91.5%) GENCODE (%)
No. GENCODE exons overlapped 7,084 (80.0%) 7,450 (84.0%) (total = 8,865) (%)
[image:5.609.56.297.125.281.2]Figure 3
comment
reviews
reports
deposited research
interactions
information
[image:7.609.57.561.87.575.2]refereed research
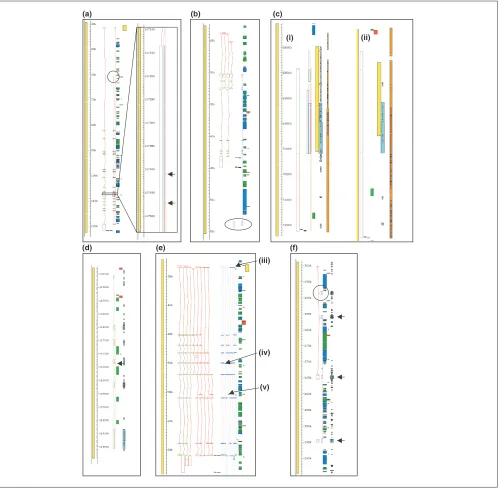
Figure 4
Comparison of GENCODE annotation with automated gene prediction methods. Viewed in Fmap of Acedb. Panel A shows the MAPK1gene in ENr221. The GENCODE annotated gene structure is represented in green and red, the circled region highlights the different first exon identified by Pairagon (dark pink/blue) and the expanded region shows tiny introns (indicated by arrows) predicted by Ensembl (orange/red). Panel B shows the TRIM22 locus in ENm009. The structure predicted by Pairagon differs from the GENCODE structure and incorporates an unprocessed pseudogene as the final exon (circled). Panel C shows the human ANKRD43 locus in ENr221 for which AceView (light pink/blue), Pairagon and Ensembl all predict a shorter CDS than GENCODE. C ii shows the mouse ANKRD43 locus in which the upstream ATG is conserved. Panel D shows the GENCODE unprocessed pseudogene locus AC087380.14 at which Ensembl predicts a coding gene. The arrow indicates a tiny intron introduced into the prediction to splice around an in-frame premature stop codon. Panel E shows the IFNAR2 locus in ENm005 with GENCODE coding (red/green) and non-coding (all red) variants and AceView predictions. The AceView CDSs differ from GENCODE in several respects; arrow ‘a’ indicates several transcripts that have their CDS extended to the start of the prediction upstream of the GENCODE CDS start; arrow ‘b’ indicates a CDS starting in exon 5 despite the presence of an upstream ATG, which would seem to preclude (re-)initiation from this site; and arrow ‘c’ indicates a predicted stop codon in the fourth from last exon, which would be likely to make this transcript a target from Nonsense-mediated decay (NMD). GENCODE annotation incorporates all these variants but keeps them as transcripts as CDSs cannot be assigned with certainty. Panel F shows part of the olfactory receptor (OR) cluster in ENm009. Here Pairagon predicts a coding gene at the pseudogene locus OR52Z1P and a multi-exon gene that links separate OR loci (pseudogene locus OR51A1P, coding loci OR52A1 and OR52A5), indicated by arrows.
(b) (c)
(i) (ii)
(d) (e) (f)
(iii)
(iv)
[26], two of which are only supported by non-human EST evidence. The identification of a rare splice variant in the C16orf35 gene at the alpha globin locus is also facilitated using mouse EST evidence (J Hughes, personal communi-cation). Importantly, manual annotation allows context to be taken into account when making a decision about difficult gene regions, which includes consulting literature and various web resources.
Conclusions
The E-GASP workshop as part of the ENCODE project has highlighted the need for a high quality reference gene set that can be used to improve and validate prediction algo-rithms, as well as a scaffold for further experimentation. RT-PCR and 5’ RACE of predicted exons outside the GENCODE annotation has currently not revealed additional multi-exon protein-coding genes. However, the experimental validation continually adds evidence for more splice variants. In addition, other technologies such as mapping RNA to tiling arrays [27], cap analysis gene expression (CAGE) tags [28], and gene identification signature (GIS) ditags [29] indicate there is transcriptional activity outside the regions currently annotated by the GENCODE consortium. Therefore, the annotation will be continually evolving to represent the complete transcriptional landscape of the ENCODE regions.
Materials and methods
Annotation pipeline and softwareBefore the process of manual annotation begins, an automated analysis pipeline for similarity searches and ab initiopredictions is run. The searches are run on a computer farm and stored in an Ensembl MySQL database using a modified Ensembl analysis pipeline system [30]. All searches and prediction algorithms, except CpG island prediction (see cpgreport in the EMBOSS application suite [31]) are run on repeat masked sequence. RepeatMasker [32] is used to mask interspersed repeats, followed by Tandem repeats finder [33] to mask tandem repeats. Nucleotide sequence data-bases are searched with wuBLASTN [34], and significant hits are re-aligned to the unmasked genomic sequence using est2genome [35]. The Uniprot protein database [36] is searched with wuBLASTX, and the accession numbers of significant hits are looked up in the Pfam database [37]. The hidden Markov models for Pfam protein domains are aligned against the genomic sequence using Genewise [38] to provide annotation of protein domains. We also run a number of ab initioprediction algorithms: Genescan [13] and Fgenesh [16] for genes, tRNAscan [39] to find tRNAgenes and Eponine TSS [40], to predict transcription start sites. Annotation assessed at the E-GASP workshop used data from searches of the 24th August 2004 of dbEST, vertebrate mRNA sequences from release 80 of the EMBL nucleotide database and protein sequences from version 2.4 of Swiss-Prot/TrEMBL.
Once the automated analysis is complete, the annotator uses a Perl/Tk based graphical interface, called ‘otterlace’, developed in-house to edit annotation data held in a separate MySQL database system [41]. The interface displays a rich, interactive graphical view of the genomic region, showing features like database matches, gene predictions, and transcripts created by the annotators. Gapped alignments of nucleotide and protein blast hits to the genomic sequence are viewed and explored using the ‘Blixem’ alignment viewer [42]. Additionally, the ‘Dotter’ dot plot tool [42] is used for showing the pair-wise alignments of unmasked sequence, thus revealing the location of exons that are occasionally missed by the automated blast searches because of their small size and/or match to repeat-masked sequence. The interface provides a number of tools that the annotator uses to build genes and edit annotations: adding transcripts, exon coordinates, translation regions, gene names and descrip-tions, remarks and polyadenlyation signals and sites.
Rapid amplification of cDNA ends
Both 5’ and 3’ RACE were performed on 12 human poly(A)+ RNAs (brain, heart, kidney, spleen, liver, colon, small intestine, muscle, lung, stomach, testis, placenta) using the
BD SMARTTMRACE cDNA amplification kit (BD
BioScience-Clontech Catalogue No.634914, Mountain View, CA 95043, USA). Double-stranded cDNA synthesis and adaptor ligations to the synthesized cDNA were done according to the manu-facturer’s instructions. RACE fragments were separated on agarose gels and one or two strong single bands per gene purified and sequenced directly. Thus, successful RACE reactions appearing as a smear on the agarose gel would be discarded, therefore producing an approximate 54% success rate.
RT-PCR
Acknowledgments
This work was supported by grants from the Childcare and Désirée and Niels Yde Foundations, the European Union, the Swiss National Science Foundation and the NCCR Frontiers in Genetics, from the NHGRI ENCODE Project, and from the Spanish Ministry of Education and Science.
This article has been published as part of Genome Biology Volume 7, Supplement 1, 2006: EGASP ’05. The full contents of the supplement are available online at http://genomebiology.com/supplements/7/S1.
References
1. International Human Genome Sequencing Consortium: Finishing the euchromatic sequence of the human genome. Nature 2004, 431:931-945.
2. Mattick JS: Non-coding RNAs: the architects of eukaryotic complexity.EMBO Rep 2001, 2:986-991.
3. Bartel DP: MicroRNAs: genomics, biogenesis, mechanism, and function.Cell 2004, 116:281-297.
4. ENCODE project consortium: The ENCODE (ENCyclopedia Of DNA Elements) Project.Science 2004, 306:636-640. 5. GENCODE Consortium[http://genome.imim.es/gencode] 6. HAVANA Team[http://www.sanger.ac.uk/HGP/havana/] 7. Guigo R, Flicek P, Abril J, Reymond A, Lagarde J, Denoeud F,
Antonarakis S, Ashburner M, Bajic VB, Birney E, et al: EGASP. The human ENCODE genome assessment project.Genome Biology 2006, 7(Suppl 1):S2
8. Deloukas P, Matthews LH, Ashurst J, Burton J, Gilbert JG, Jones M, Stavrides G, Almeida JP, Babbage AK, Bagguley CL,et al.: The DNA sequence and comparative analysis of human chromosome 20.Nature 2001, 414:865-871.
9. Entrez Gene[http://www.ncbi.nlm.nih.gov/entrez/query.fcgi?db=gene] 10. HUGO Gene Nomenclature Committee[http://www.gene.ucl.
ac.uk/nomenclature/]
11. Will CL, Luhrmann R: Splicing of a rare class of introns by the U12-dependent spliceosome.Biol Chem 2005, 386:713-724. 12. Parra G, Blanco E, Guigo R: GeneID in Drosophila.Genome Res
2000, 10:511-515.
13. Burge C, Karlin S: Prediction of complete gene structures in human genomic DNA.J Mol Biol 1997, 268:78-94.
14. Wang M, Buhler J, Brent MR: The effects of evolutionary dis-tance on TWINSCAN, an algorithm for pair-wise compara-tive gene prediction.Cold Spring Harb Symp Quant Biol 2003, 68: 125-130.
15. Wiehe T, Gebauer-Jung S, Mitchell-Olds T, Guigo R: SGP-1: pre-diction and validation of homologous genes based on sequence alignments.Genome Res 2001, 11:1574-1583.
16. Salamov AA, Solovyev VV: Ab initiogene finding in Drosophila genomic DNA.Genome Res 2000, 10:516-522.
17. Siepel A, Haussler D: Computational identification of evolu-tionarily conserved exons.Proc. 8thAnnual Int’l Conf. on Research in Computational Biology. pp 177-186, 2005 RECOMB’04, March 27-31, 2004, San Diego, California, USA.
18. Acembly[http://www.ncbi.nih.gov/IEB/Research/Acembly/index.html] 19. Kim P, Kim N, Lee Y, Kim B, Shin Y, Lee S: ECgene: genome annotation for alternative splicing.Nucleic Acids Res 2005, 33 (Database issue):D75-79.
20. Eyras E, Caccamo M, Curwen V, Clamp M: ESTGenes: alternative splicing from ESTs in Ensembl.Genome Res 2004, 14:976-987. 21. Pruitt KD, Tatusova T, Maglott DR: NCBI Reference Sequence
(RefSeq): a curated non-redundant sequence database of genomes, transcripts and proteins.Nucleic Acids Res 2005, 33 (Database issue):D501-504.
22. Birney E, Andrews TD, Bevan P, Caccamo M, Chen Y, Clarke L, Coates G, Cuff J, Curwen V, Cutts T, et al.: An overview of Ensembl.Genome Res 2004, 14:925-928.
23. UCSC genome browser [http://genome.cse.ucsc.edu/ENCODE] 24. Kozak M: Emerging links between initiation of translation
and human diseases.Mamm Genome 2002, 13:401-410.
25. Lewis BP, Green RE, Brenner SE: Evidence for the widespread coupling of alternative splicing and nonsense-mediated mRNA decay in humans.Proc Natl Acad Sci USA 2003, 100(1): 189-192. 26. Ohler U, Shomron N, Burge CB: Recognition of unknown
con-served alternatively spliced exons. PLoS Comput Biol 2005, 1: 113-122.
27. Kapranov P, Drenkow J, Cheng J, Long J, Helt G, Dike S, Gingeras TR: Examples of the complex architecture of the human transcriptome revealed by RACE and high-density tiling arrays.Genome Res 2005, 15:987-997.
28. Shiraki T, Kondo S, Katayama S, Waki K, Kasukawa T, Kawaji H, Kodzius R, Watahiki A, Nakamura M, Arakawa T,et al.: Cap analy-sis gene expression for high-throughput analyanaly-sis of tran-scriptional starting point and identification of promoter usage.Proc Natl Acad Sci USA 2003, 100:15776-15781.
29. Ng P, Wei CL, Sung WK, Chiu KP, Lipovich L, Ang CC, Gupta S, Shahab A, Ridwan A, Wong CH,et al.: Gene identification signa-ture (GIS) analysis for transcriptome characterization and genome annotation.Nat Methods 2005, 2:105-111.
30. Potter SC, Clarke L, Curwen V, Keenan S, Mongin E, Searle SM, Stabenau A, Storey R, Clamp M: The Ensembl analysis pipeline. Genome Res 2004, 14:934-941.
31. Rice P, Longden I, Bleasby A: EMBOSS: the European Molecular Biology Open Software Suite.Trends Genet 2000, 16:276-277. 32. RepeatMasker[http://www.repeatmasker.org/]
33. Benson G: Tandem repeats finder: a program to analyze DNA sequences.Nucleic Acids Res 1999, 27:573-580.
34. wuBLASTN[http://blast.wustl.edu]
35. Mott R: EST_GENOME: a program to align spliced DNA sequences to unspliced genomic DNA.Comput Appl Biosci 1997, 13:477-478.
36. Uniprot Protein Database[http://www.uniprot.org]
37. Bateman A, Coin L, Durbin R, Finn RD, Hollich V, Griffiths-Jones S, Khanna A, Marshall M, Moxon S, Sonnhammer EL,et al.: The Pfam protein families database.Nucleic Acids Res 2004, 32(Database issue):D138-141.
38. Birney E, Clamp M, Durbin R: GeneWise and Genomewise. Genome Res 2004, 14:988-995.
39. Lowe TM, Eddy SR: tRNAscan-SE: a program for improved detection of transfer RNA genes in genomic sequence. Nucleic Acids Res 1997, 25:955-964.
40. Down TA, Hubbard TJ: Computational detection and location of transcription start sites in mammalian genomic DNA. Genome Res 2002, 12:458-461.
41. Searle SM, Gilbert J, Iyer V, Clamp M: The otter annotation system.Genome Res 2004, 14:963-970.
42. Sonnhammer EL, Wootton JC: Integrated graphical analysis of protein sequence features predicted from sequence compo-sition.Proteins 2001, 45:262-273.
43. Reymond A, Friedli M, Henrichsen CN, Chapot F, Deutsch S, Ucla C, Rossier C, Lyle R, Guipponi M, Antonarakis SE: From PREDs and open reading frames to cDNA isolation: Revisiting the human chromosome 21 transcription map. Genomics 2001, 78:46-54.
44. Reymond A, Camargo AA, Deutsch S, Stevenson BJ, Parmigiani RB, Ucla C, Bettoni F, Rossier C, Lyle R, Guipponi M,et al.: Nineteen additional unpredicted transcripts from human chromo-some 21.Genomics 2002, 79:824-832.
45. Guigo R, Dermitzakis ET, Agarwal P, Ponting CP, Parra G, Reymond A, Abril JF, Keibler E, Lyle R, Ucla C,et al.: Comparison of mouse and human genomes followed by experimental verification yields an estimated 1,019 additional genes.Proc Natl Acad Sci USA 2003, 100:1140-1145.