International Journal of Emerging Technology and Advanced Engineering
Website: www.ijetae.com (ISSN 2250-2459, ISO 9001:2008 Certified Journal, Volume 4, Issue 11, November 2014)
288
Image classification using Hybrid MLP method
Ashish Mohan Yadav
1, B P S Sengar
21P.G. Scholar,2Asst. Professor, ASCT Bhopal, M.P., India
Abstract— Content based image retrieval system is a research area which is growing very fast, here the query image’s visual contents are used to search similar or exact images from a very large scale database of images. An effective system is proposed in our method in which both the semantically and visually relevant features are used for retrieval of the related images. For an efficient retrieval of image, it is necessary for a classification algorithm to be much efficient that it can find and locate the image at a different like in a compressed level. Our system proposes a novel training algorithm for Multi-Layer Perceptron Network to classify compressed images more efficiently. Here a hybrid MLP method is proposed for retrieval several features and shortens the semantic gap between low-level visual feature and high- level perception.
Keywords: CBIR, MLP, SVM, Semantic gap, image classification, compressed image.
I. INTRODUCTION
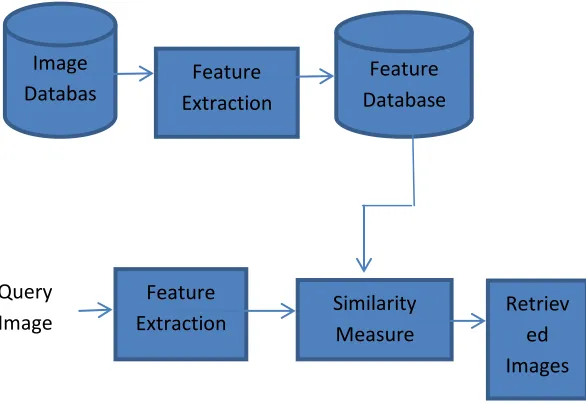
Over a past few years, the growth in quantity of images used in the digital form is increased tremendously and with this also have raised many such demanding issues in data management and retrieval system of these digital data. But recently by some researchers Content Based Image Retrieval (CBIR) system is seen as an efficient solution to limit some of these issues efficiently. As we know that CBIR is a system for retrieving relevant images from a large digital image database by measuring similarities between the queried image and database images like when the picture of a ship is given, the system should retrieve similar images from the image database given. A feature extraction process which is automatic is very important and crucial also for image retrieval systems [1]. Feature extraction is achieved through extraction of features from images, the feature like color, texture, and shape. Now these extracted features of the images are then compared with the image which is a query image and database images. A similarity algorithm is used to calculate the similarity degree between the queried image and database images.
Now those database images which have matched features as the queried image (with the highest similarity measure) are then ranked and showed to the user. In this CBIR system we have two steps one for Feature Extraction and another for Image Matching (also called feature matching). In the Feature Extraction phase we extracts image features to a discerning extent like color, texture and shape features for every image available in the image database and are called feature vectors. In image matching phase we use the features of queried and database both images and make match between them to check features similar to those in database images. Image segmentation represents a digital image in simple multiple region forms to facilitate analysis. Objects, boundaries in an image are sited and also object and background is segmented using image segmentation [2] [3] [4] [5] [6] [7].
In the process of image segmentation we first segments color which is followed by edge detection process. A good quality of image segmentation required for good feature extraction as over segmentation leads to many details of the object and under segmentation groups many object into single region so level of segmentation is a deciding factor for success or failure of analysis. Image segmentation algorithm takes advantage of discontinuity and similarity of the grey levels of image. Some of the most commonly used segmentation techniques are histogram thresholding, clustering, vector based and fuzzy technique. In this study, a novel image classification algorithm hybrid MLP is proposed.
International Journal of Emerging Technology and Advanced Engineering
Website: www.ijetae.com (ISSN 2250-2459, ISO 9001:2008 Certified Journal, Volume 4, Issue 11, November 2014)
[image:2.612.24.317.186.388.2]289
Fig. 1 Block diagram for CBIR System
II. RELATED WORKS
A content based color image retrieval system based on Fast Compression Distance (FCD) concept was proposed by Cerra and Datcu [8]. A hybrid model of Artificial Neural Networks (ANN) using multiple linear regression models to get precise classification accuracy was proposed by Khashei, et al., .[9]. The new method did not include total decompression. Histogram features were extracted from wavelet coefficients used for retrieval. Results prove improved retrieving accuracy than that of current algorithms. Khashman and Dimililer [10] trained a neural network to relate radiograph image contents to optimum image compression ratio. When trained, the NN chose ideal Haar wavelet compression ratio of x-ray images on being presented to the network. The model can be used for a 2 class and multi class problems. Computationally less complex, it is capable of use on large data sets. An image indexing/retrieval system suiting JPEG2000 compressed images was presented by Tang, et al., [11].
Packet header information was decoded for image retrieval and performed better than the pixel based Gabor filter and other wavelet based retrieval procedures.
Zargari, et al., [12] suggested a new compressed domain texture based visual information retrieval process. Experiments suggest that the proposed system efficiently compresses radiographs with high image quality. The trained NN correctly recognized optimum compression ratios for 25 training images as expected, yielding 100% training set recognition. Testing the trained NN using 23 images from Test Set 1 not presented to the network earlier, yielded a 95.65% recognition rate, where 22 out of 23 images with known optimum compression ratios were assigned correct ratio. A minimum accuracy level of 89% was accepted in this work. Using this accuracy, the NN yielded 95.65% correct recognition rate among optimum compression ratios. The proposed method‟s successful implementation using NN was revealed by high recognition rates and minimal time costs when operating a trained NN. An image retrieval technique for JPEG images in the compressed domain was proposed by Zargari, et al., [13]. The new method is for spatially predicted I-frames in H.264 video coding standard. I-Frame coding uses various prediction modes to spatially predict pixels of a block from upper or left adjacent pixels. A block‟s selected prediction mode indicates how the block‟s pixels are related to neighbouring parts. A suggestion was that histogram of prediction modes be used as a compressed I-frames texture descriptor. As the method is based on independent I-Frame coded pictures, it can be used for H.264 coded videos analysis or I-frame based coded images image retrieval like advanced image coding. Simulation indicates the superior performance and lower computational load compared to a Gabor filter based efficient realization of pixel domain texture retrieval method. Also, it is robust to variations in image/coding parameters. Le Hoang Thai, Tran Son Hai, Nguyen Thanh Thuy et al. proposed a method in which convey mutually two areas in which are Artificial Neural Network (ANN) and Support Vector Machine (SVM) applying for image classification. Firstly, separate the image into many sub-images based on the features of images. Each sub-image is classified into the responsive class by an ANN. Lastly, SVM has been accumulated all the categorize result of ANN [14].
A CBIR system based on a multi-scale geometric analysis (MGA) tool, called ripplet transform type-I (RT) have been presented by Chowdhury et al.[15]. Laplacian transform of the sharpened grey-scale image is statistically quantized into colour histogram bins in Malik and Baharudin [16].
Feature
Database
Image
Databas
e
Feature
Extraction
Feature
Extraction
Similarity
Measure
Retriev
ed
Images
Query
International Journal of Emerging Technology and Advanced Engineering
Website: www.ijetae.com (ISSN 2250-2459, ISO 9001:2008 Certified Journal, Volume 4, Issue 11, November 2014)
290
III. FEATURE EXTRACTION
Feature extraction phase is a very important step for image classification used in CBIR. With this step what system is do that all the relevant or irrelevant features of all the images available in database are extracted and after that by these features classification of image is performed. Actually, by feature extraction we map an image from image space to feature space. And with feature space we measure the similarity of an input space extracted from input image with the help of kernel function.
In digital image, basically there are many features like colour, shape, text, size and dimension etc. which can be used for feature extraction but for extraction of these features which are more relevant is not an easy task in fact a difficult task. The output given by this step is in the form of vector [17] [18] [19].
Basically image features can be divided into 2 parts. 1. Visual Features
2. Semantic Features
Feature which are extracted by human vision are called visual feature.
They are further divided into- 1. General Features
2. Domain specific
General features are those which can be used for searching like colour, shape, texture and feature which are used for particular domain and have knowledge about them [20].
For example, we are searching for face of a girl which belongs to human category, so here domain is human. Another one is we are searching for elephant which belongs to animal category. These features are domain specific [21].
Some features are semantic these are the features those have some meaningful information about the image and those are very difficult to extract. The categories came into this feature are mean value, RGB value, Histogram value, Standard deviation and entropy but again these features are not so easy to find [22].
So to find this the set of features with the help of input data is called feature extraction [23].
Below diagram shows the process of image classification and feature extraction [24].
Figure1 Image Classification & Feature Extraction Process
IV. PROPOSED METHODOLOGY
A. Classifiers
1) Naïve Bayes Classifier
The Naïve Bayes classifier works on a simple, intuitive concept. It is also seen that Naïve Bayes outperforms many comparatively complex algorithms, making use of variables in data samples, by observing them individually and independently [25, 26].
Naïve Bayes is a model which works on supervised learning classifier. Bayes rule for supervised learning is represented for an unknown target function f: XY, or equivalently P(Y|X). where Y is actually a boolean-valued random variable, and X is a vector containing „n‟ boolean attributes.
Original Image
Pre-processing
Noise Filter and Image Segmentation
Histogram Equalization
Crop/Normalize
Feature Extraction
Classifying
International Journal of Emerging Technology and Advanced Engineering
Website: www.ijetae.com (ISSN 2250-2459, ISO 9001:2008 Certified Journal, Volume 4, Issue 11, November 2014)
291
That is X =(X1, X2, . . ., Xn) , where Xi is the Boolean random variable denoting the ith attribute of X. Applying Bayes rule, P(Y = yi|X) can be represented as
where ym denotes the mth possible value for Y, xk denotes the kth possible vector value for X, and where denominator summation is over all legal values of the random variable Y. A method to learn P(YjX) is using training data to estimate P(X|Y) and P(Y) which are then used together with Bayes rule to determine P(Y|X = xk) for any new instance xk.
2) Support vector machine (SVM)
Support vector machine (SVM) is a linear machine constructing a hyperplane as a decision surface [27]. With it is based on structural risk minimization method; the error rate here is calculated by sum of error rate of training and a term which is dependent upon Vapnik-Chervonenkis (VC) dimensions. SVM provide is used for a generalization of categories of pattern classification. The performance of SVM algorithm is dependent on inner-product kernel between a “support vector” xi and input vector drawn which is vector x.
SVM uses mapping for lightening computational load of the larger space to compute cross products with variables in original space. In the bigger space, the kernel function K(x,y) which is used to find the cross products is selected to suit the domain of problem. Cross products with a vector in space if constant is used define hyper planes [28]. Hyperplane defining vectors are linear combinations with parameters αi of feature vectors which occur in a data base. After hyperplane selection, feature plane points x are defined by:
If K(x,y) becomes small when y grows further from x, closeness degree is given by the sum measures of closeness of test point x to corresponding data base point xi.
The above method is used to measure the closeness between each of test points of data points those are originating from data sets still awaiting for discrimination. As points set mapped can be quite convoluted, complex discrimination comes between the values sets which are not convex in original space.
SVMs have shown performance well as an algorithm used for learning, in the past, and generally it shows well on a various classification problems. They are also allowed for rapid classification from trained models and are able to handle very high-dimensional input vectors.
The following equation will calculate implementation error function:
Which can be minimized to
where C is capacity constant, w vector of coefficients, b a constant and parameters for handling non separable data (inputs). The index i labels N training cases.
3) Multilayer perceptron (MLP)
Multilayer perceptron (MLP) is technique which is very popular for supervised learning network consisting of layer used for input, one or more hidden layers and a layer used for output. Connections between different layers are made to connect every node from a layer to next layer‟s neurons. During training, weights are adjusted for each connection. The nodes of output layer are used to produce outputs. Feature vector x is given as a input at input layer with a output at output layer representing a discriminator between its class and other classes. Training examples, in training, are fed and the predicted outputs computed. The output and target output are compared and measured error is propagated back through network and weights adjusted [29, 30].
The training set of size m is represented as
where are the
International Journal of Emerging Technology and Advanced Engineering
Website: www.ijetae.com (ISSN 2250-2459, ISO 9001:2008 Certified Journal, Volume 4, Issue 11, November 2014)
292
V. PROPOSED APPROACH
Though Levenberg-Marquardt method is considered efficient, computing large Jacobians needs a large memory. The large matrixes needed to be inverted for computation, results in bigger computation time. Hence, to reduce computation cost, the following changes are introduced in Levenberg-Marquardt method. Performance index to be optimized in Levenberg-Marquardt algorithm is given as where w refers to all network weights. dic is desired/required value of ith output and cth pattern. oic is actual value. The following performance index is introduced in Levenberg-Marquardt method This leads to major reduction in matrix size, thereby reducing computation cost.
The proposed system is formalised by following steps:
Algorithm Steps:
1. Input : Image dataset, Query image 2. Verify image dataset.
3. IF available = false Then
Error Msg “ Insufficient image in database” ELSE
Features extract of all images stored in database
{Color feature: color histogram, color moments………} now stored it in M- dimensional feature vector DBFi
ENDIF
4. Query Image : Extract color feature of query image 5. Stored it in separate variable QF
{Used RGB color model to construct a feature vector} 6. Color co-occurrence matrixes of RGB generate. PRGB =[PRGBij]
7. Retrieved pixel information from previous step 8. Sum average value of row by column
{i, j are row and columns respectively} 9. Apply distance formula
{p-dimension, wi=weight of ith feature}
fDBFi = ith feature of DB image
fQFi = ith feature of query image \\ Apply proposed MLP
10. The classification accuracy for retrieval of uncompressed images and various compressed images is evaluated using the proposed MLP-NN. 11. Initialize weights and parameter μ (μ=.01 is appropriate).
12. Compute sum of squared errors over inputs F(w).
13. Obtain increment of weights Δw by
where J is Jacobian matrix, µis learning rate 14. Recompute sum of squared errors F(w)
Using w + Δw as the trial w, and judge IF trial F(w) < F(w) in step 2 THEN w = w + Δw
μ = μ ⋅ β (β =0 .1) Go back to step 2 ELSE
go back to step 4 END IF
15. Sort similarity distances in ascending order and retrieve first N images
VI. EXPERIMENTAL RESULT
This section presents the simulation results implemented by the proposed method SVMID3 and the simulation is done using the best known simulator MATLAB 2009a and some reputed image dataset.
A. Image Data Set
The coral image data set is very famous image data set for research purpose of image classification and retrieval, in this experimental data set they used 180 images which contain total 18 classes and each class have fixed 10 images from out of coral dataset of thousands images.
B. Performance Evaluation of CBIR
The level of the kind of accuracy achieved by a system is self-sufficient to establish its performance. And if the outcome shown by the system is satisfactory and promising, it can be used as a standard in future research works. In CBIR, precision-recall is the most widely used measurement method to evaluate the retrieval accuracy[31].
International Journal of Emerging Technology and Advanced Engineering
Website: www.ijetae.com (ISSN 2250-2459, ISO 9001:2008 Certified Journal, Volume 4, Issue 11, November 2014)
293
Recall is defined as the ratio of the number of relevant images retrieved to the total number of relevant images in the whole database [33].
Error Rate is defined as the ratio of the number of non-relevant retrieved images to the total number of images in the whole database. [34]
C. Result analysis of classified images
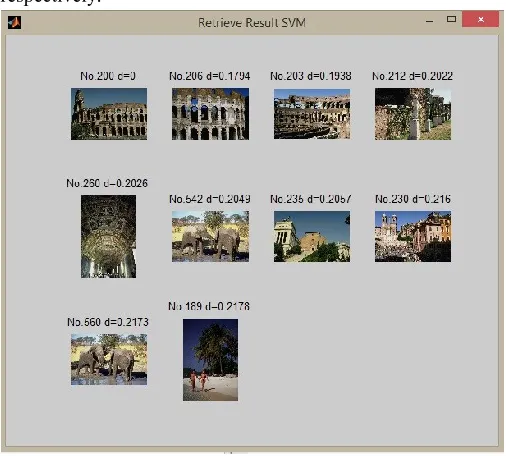
Here in the figure 5.2.1 and figure 5.2.2 compare result with class 12 dinosaur images, class 12 is defined for dinosaur images in our database, where the accuracy measurement of SVM and proposed method are 70% and 100%
[image:6.612.323.575.130.358.2]respectively.
Figure 3 SVM method for image class11
Figure 4 Proposed method for image class11
Similarly I have tested both method in eighteen different classes, and next section summarized the all classes result. The result analysis of classified images based on compared two methods with retrieved images. The table 5.2.1 and table 5.2.2 shows that the detailed analysis of the both methods with the confusion matrix. The two confusion matrix is shown in table 5.2.1 and 5.2.2 respectively at the last pages, which shows the analysis of the SVM and SVMID3 methods respectively.
Table-I Individual Class wise Accuracy
Class wise Accuracy
Image Class SVM Proposed
method
3 80 100
4 100 100
5 100 100
6 100 100
[image:6.612.48.301.410.638.2]International Journal of Emerging Technology and Advanced Engineering
Website: www.ijetae.com (ISSN 2250-2459, ISO 9001:2008 Certified Journal, Volume 4, Issue 11, November 2014)
294
8 100 100
9 90 100
10 50 60
11 70 90
12 80 90
13 50 70
14 80 90
Here table 5.2.3 shows that the individual comparative class wise accuracy of both method, where class taken randomly for retrieving the image classes. After that the figure 5.2.3 shows graph analysis of the individual classes accuracy of the both method, where proposed method shows the better result up to maximum instant when it compared with SVM method.
D. Accuracy chart for all these classes
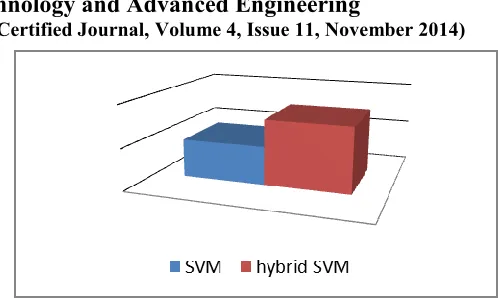
[image:7.612.317.566.110.261.2]Here table 5.2.4 shows the overall accuracy of the both methods where the result is examined in the bases of 18 classes of the images. And finally produced the output where SVM method has overall 71.12 percentage and SVMID3 has overall 90.56 percentage accuracies. After that in the figure 5.2.4 its shows that the comparatitive graph analysis of the both method with the help of 3D bar graph.
Table-II Overall Accuracy
Overall Accuracy
SVM Proposed method
78.34 91.12
Figure 5 Accuracy comparison for both methods
VII. CONCLUSION
Here our focus with this proposed work is to give a comparative study of neural network and support vector machine. For the classification of the images we use support vector machines as a classifier and after applying this classification process for the features extracted from the images in the step of feature extraction. Its main function is to find a hyper plane with maximum margin in a high dimensional feature space. Here all the conditions such as nonlinear support vector machines, optimal separating hyper planes, and linearly non-separable case are discussed upon which support vector machines work and a kernel based learning method which is used for the mapping purpose is also discussed. So with our proposed method we get much better performance than the other traditional methods and get optimal results.
References
[1] Rui, Y., T.S. Huang and S.F. Chang, 1999. Image retrieval: Current techniques, promising directions and open issues. J. Vis. Commun. Image Represent.,10: 39-62.
[2] Gonzalex, R.C. and R.E. Woods, 2009. Digital Image Processing. 3rd Edn., Pearson Education India, India, ISBN-10: 8131726959, pp: 954.
[3] Banerjee, M. and M.K. Kundu, 2003. Content based image retrieval with fuzzy geometrical features. Proceedings of the 12th IEEE International Conference on Fuzzy Systems, May 25-28, IEEE Xplore Press, pp: 932-937. DOI: 10.1109/FUZZ.2003.1206556
[4] Amartur, S.C., D. Piraino and Y. Takefuji, 1992. Optimization neural networks for the segmentation of magnetic resonance images. IEEE Trans. Med. Imag., 11: 215-220. PMID: 18218375
International Journal of Emerging Technology and Advanced Engineering
Website: www.ijetae.com (ISSN 2250-2459, ISO 9001:2008 Certified Journal, Volume 4, Issue 11, November 2014)
295
[6] Hussain, S.J., T.S. Savithri and P.V.S. Devi, 2012. Segmentation oftissues in brain MRI images using dynamic neuro-fuzzy technique. Int. J. Soft Comput. Eng., 1: 416-423.
[7] Barskar, R. and G.F. Ahmed, 2011. CBIR using fuzzy edge detection mask. Proceeding of the 2011 International Conference on
Communication, Computing and Security, (ICCCS‟ 11), ACM New York, USA., pp: 277-280. DOI: 10.1145/1947940.1947999
[8] Cerra, D., & Datcu, M. (2012). A fast compression-based similarity measure with applications to content-based image retrieval. Journal of Visual Communication and Image Representation, 23(2), 293-302
[9] Khashei, M., Zeinal Hamadani, A., & Bijari, M. (2012). A novel hybrid classification model of artificial neural networks and multiple linear regression models. Expert Systems with Applications, 39(3), 2606-2620.
[10]Khashman, A., & Dimililer, K. (2008). Image compression using neural networks and haar wavelet. WSEAS Transactions on Signal Processing, 4(5), 330-339.
[11]Tang, J., Zhang, W., & Li, C. (2005). An approach to compressed image retrieval based on JPEG2000 framework. In Advanced Data Mining and Applications (pp. 391-399). Springer Berlin Heidelberg.
[12]Zargari, F.; Mehrabi, M.; Ghanbari, M., "Compressed domain texture based visual information retrieval method for I-frame coded pictures," Consumer Electronics, IEEE Transactions on , vol.56, no.2, pp.728,736, May 2010
[13]Zargari, F., Mosleh, A., & Ghanbari, M. (2008). A fast and efficient compressed domain JPEG2000 image retrieval method. Consumer Electronics, IEEE Transactions on, 54(4), 1886-1893.
[14]Tran Son Hai, Nguyen Thanh Thuy, “Image Classification using Support Vector Machine and Artificial Neural Network”, I.J. Information Technology and Computer.
[15]Chowdhury, M., Das, S. and Kundu, M. K., Novel CBIR system based on ripplet transform using interactive neuro-fuzzy technique. Electron. Lett. Computer Vision Image Anal., 2012, 11, 1–13.
[16]Malik, F. and Baharudin, B. B., Feature analysis of quantized histogram color features for content-based image retrieval based on Laplacian filter. In International Conference on System Engineering and Modeling. IACSIT Press, Singapore, 2012, vol. 34.
[17]Sandeep Kumar, Zeeshan Khan, Anuragjain, “A Review of Content Based Image Classification using Machine Learning Approach”, International Journal of Advanced Computer Research (ISSN (print): 2249-7277 ISSN (online): 2277-7970) Volume-2 Number-3 Issue-5 September-2012
[18]Le Hoang Thai, Tran Son Hai and Nguyen ThanhThuy, “Image Classification using Support VectorMachine and Artificial Neural Network”, I.J. Information Technology and Computer Science, 5, 32-38, 2012.
[19]Xiang-Yang Wang , Bei-BeiZhang,Hong-YingYang, “Active SVM-based relevance feedback using multiple classifiers ensemble and features reweighting”, Engineering Applications of Artificial Intelligence 26, 368–381, Elsevier Ltd, 2013.
[20]Xiang-Yang Wang , Bei-BeiZhang,Hong-YingYang, “Active SVM-based relevance feedback using multiple classifiers ensemble and features reweighting”, Engineering Applications of Artificial Intelligence 26, 368–381, Elsevier Ltd, 2013.
[21]Sandeep Kumar, Zeeshan Khan, Anuragjain, “A Review of Content Based Image Classification using Machine Learning Approach”, International Journal of Advanced Computer Research (ISSN (print): 2249-7277 ISSN (online): 2277-7970) Volume-2 Number-3 Issue-5 September-2012.
[22]Sandeep Kumar, Zeeshan Khan, Anuragjain, “A Review of Content Based Image Classification using Machine Learning Approach”, International Journal of Advanced Computer Research (ISSN (print): 2249-7277 ISSN (online): 2277-7970) Volume-2 Number-3 Issue-5 September-2012.
[23]J Umamaheswari and Dr.G.Radhamani, “Quadratic Program Optimization using Support Vector Machine for CT Brain Image Classification”, IJCSI International Journal of Computer Science Issues, Vol. 9, Issue 4, No 1, July 2012.
[24]Le Hoang Thai, Tran Son Hai and Nguyen ThanhThuy, “Image Classification using Support VectorMachine and Artificial Neural Network”, I.J. Information Technology and Computer Science, 5, 32-38, 2012.
[25]Moore, A. W. (2004). Naïve Bayes Classifiers. Statistical Data Mining Tutorials.
[26]Ridgeway, G., Madigan, D., Richardson, T., & O‟Kane, J. (1998, August). Interpretable boosted naive Bayes classification. In Proceedings of the fourth international conference on knowledge discovery and data mining (pp. 101-104). AAAI Press.
[27]Vandewalle, J. (1999). Least squares support vector machine classifiers. Neural processing letters, 9(3), 293-300.
[28]Cortes, C., & Vapnik, V. (1995). Support-vector networks. Machine learning, 20(3), 273-297.
[29]Leisch, F., Jain, L. C., & Hornik, K. (1998). Cross-validation with active pattern selection for neural-network classifiers. Neural Networks, IEEE Transactions on, 9(1), 35-41.
[30]Widrow, B., & Lehr, M. A. (1990). 30 years of adaptive neural networks: Perceptron, madaline, and backpropagation. Proceedings of the IEEE, 78(9), 1415-1442.
[31]Koselka, M., Laaksonen, J., Laakso, S. and Oja, E. 2000. Evaluating the Performance of Content-Based Image Retrieval Systems. In proceedings of 4th International Conference on Advances in Visual Information Systems.
[32]Kumar, A., and Esther, J. 2011. Comparative Study on CBIR based by Color Histogram, Gabor and Wavelet Transform. International Journal of Computer Applications 17(3):37-44.
[33]Suhasini, P., Krishna, K. and Krishna V. 2009. CBIR using color histogram processing. Journal of Theoretical and Applied Information Technology. 6(1):116-122.