R E S E A R C H
Open Access
Regulation of transcriptome, translation, and
proteome in response to environmental stress in
fission yeast
Daniel H Lackner
1,3, Michael W Schmidt
2, Shuangding Wu
2, Dieter A Wolf
2and Jürg Bähler
1*Abstract
Background:Gene expression is controlled globally and at multiple levels in response to environmental stress, but the relationships among these dynamic regulatory changes are not clear. Here we analyzed global regulation during different stress conditions in fission yeast,Schizosaccharomyces pombe, combining dynamic genome-wide data on mRNA, translation, and protein profiles.
Results:We observed a strong overall concordance between changes in mRNAs and co-directional changes in translation, for both induced and repressed genes, in response to three conditions: oxidative stress, heat shock, and DNA damage. However, approximately 200 genes each under oxidative and heat stress conditions showed
discordant regulation with respect to mRNA and translation profiles, with genes and patterns of regulation being stress-specific. For oxidative stress, we also measured dynamic profiles for 2,147 proteins, comprising 43% of the proteome. The mRNAs induced during oxidative stress strongly correlated with increased protein expression, while repressed mRNAs did not relate to the corresponding protein profiles. Overall changes in relative protein
expression correlated better with changes in mRNA expression than with changes in translational efficiency. Conclusions:These data highlight a global coordination and fine-tuning of gene regulation during stress that mostly acts in the same direction at the levels of transcription and translation. In the oxidative stress condition analyzed, transcription dominates translation to control protein abundance. The concordant regulation of
transcription and translation leads to the expected adjustment in protein expression only for up-regulated mRNAs. These patterns of control might reflect the need to balance protein production for stress survival given a limited translational capacity.
Background
Cells adapt to stress or to changing environmental con-ditions by launching specialized gene expression pro-grams that promote stress protection, homeostasis, and survival. Single-celled organisms like yeasts are particu-larly exposed to fluctuations in the environment that trigger a large common transcriptional response, called environmental stress response in budding yeast or core environmental stress response (CESR) in fission yeast [1,2]. The expression of hundreds of genes is either induced or repressed in response to different stress
conditions in fission yeast [3-8]. Key regulators of this stress response programme are the mitogen-activated protein kinase (MAPK) Sty1/Spc1 and the b-ZIP tran-scription factor Atf1 [9,10].
Besides transcriptional regulation, it is clear that gene expression is also modulated at post-transcriptional levels in response to stress, including translational con-trol [11-15]. Studies using translational profiling in bud-ding yeast exposed to stress, such as changes in nutrients [16,17], treatment with rapamycin or heat shock [18], oxidative stress [19-21], or osmotic shock [22,23], have revealed global changes in translation and identified specific genes that are mainly regulated at the translational level. No comparable global analyses on translational control during stress have been reported in fission yeast.
* Correspondence: j.bahler@ucl.ac.uk
1Department of Genetics, Evolution and Environment and UCL Cancer
Institute, University College London, Darwin Building, Gower Street, London WC1E 6BT, UK
Full list of author information is available at the end of the article
Ultimately, proteins mediate the adaptation to stress, and it is expected that the levels of numerous proteins require rapid adjustment to different environmental conditions. It is not clear, however, how the changes in transcriptional and translational control are reflected in changes at the protein level. Poor correlations between mRNA and protein expression have often been reported [24-32], although some recent studies found much stronger relationships between the regulation of mRNAs and corresponding proteins [33,34].
Here we applied genome-wide translational profiling, combined with mRNA profiling, in fission yeast cells exposed to oxidative stress, heat shock, or DNA damage. Most stress-response genes were regulated in a concor-dant manner with respect to transcript levels and trans-lational efficiency, which was evident for both stress-induced and -repressed genes. Several genes, however, bucked this trend and showed antagonistic regulation at the mRNA and translation levels. We also measured the dynamic response in the levels of more than 2,000 pro-teins during oxidative stress. A strong overall correlation was observed between transcriptional/translational induction of genes and induction of the corresponding proteins, but not between transcriptional/translational gene repression and protein profiles. Our data indicate that during oxidative stress in fission yeast, the changes in mRNA levels are the main determinant for changes in protein levels, while translational control plays a rela-tively minor role.
Results and discussion
Global translational control during environmental stress
To study translational changes in stress conditions, we prepared polysome profiles from unstressed cultures of fission yeast cells (control) and from the same cultures exposed for different times to oxidative stress, heat shock, and the DNA-damaging agent methylmethane sulfonate (MMS). The relatively mild doses of stress were chosen based on previous experiments to prevent substantial cell death [3,7]. Severe stress conditions lead to general translational repression [11-13,21,22,35]. We detected no substantial differences, however, between the overall polysome profiles from cells exposed to any of the stresses and unstressed control cells (data not shown), indicating that translation was not extensively altered on a global scale under the selected, relatively mild conditions [3,7].
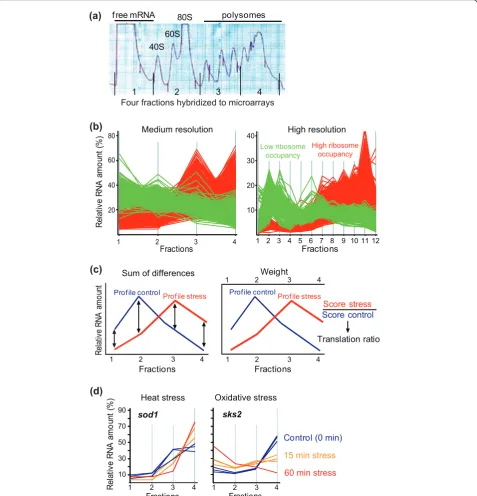
To analyze translational control, we extracted mRNA from four equal fractions throughout the polysome pro-files, followed by labeling and hybridization onto DNA microarrays against labeled genomic DNA as reference (Figure 1a). To test whether translational profiles obtained from this medium-resolution approach reflected the data from high-resolution translation
profiling using 12 fractions [36], profiles from the mRNAs with the highest and lowest ribosome occu-pancy were compared. There was good overall agree-ment between profiles from medium- and high-resolution translational profiling (Figure 1b): the mRNAs with the highest ribosome occupancy, corre-sponding to efficiently translated mRNAs, peaked in the higher fractions (red profiles in Figure 1b: fractions 3 to 4 in medium-resolution profiling; fractions 7 to 12 in high-resolution profiling), while the mRNAs with the lowest ribosome occupancy peaked at the lower frac-tions (green profiles in Figure 1b). Although somewhat less sensitive than high-resolution profiling, this com-parison indicates that four fractions are sufficient to capture the essence of the translational activity, provid-ing more information than simply comparprovid-ing mono-some with polymono-some fractions.
To identify mRNAs with altered translational profiles among the nuclear-encoded protein-coding genes, we initially applied a combination of two complementary automated approaches: 1) using a measure of the overall difference in mRNA profiles between stress and control samples; and 2) using a ratio of weighted translation scores between stress and control samples (Figure 1c; Additional file 1). These two methods gave largely (approximately 90%) overlapping yet complementary results, with the first one informing about overall differ-ences and shifts in translational profiles and the second one informing about the levels and directions of transla-tional changes. The profiles from these candidate mRNAs uncovered by either approach were then visually inspected to create a high-confidence set of translationally regulated mRNAs. Two typical examples of mRNAs showing translational control in response to
stress are shown in Figure 1d: thesod1mRNA
(encod-ing a superoxide dismutase) is gradually shifted towards higher polysomal fractions in response to heat stress,
reflecting translational up-regulation, while the sks2
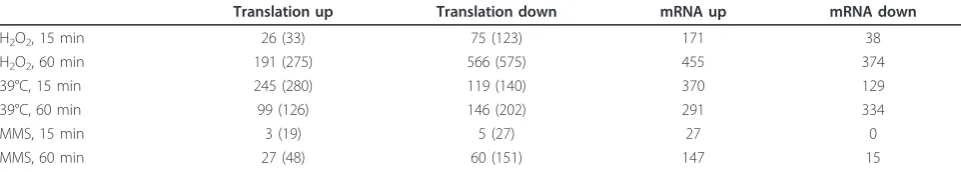
mRNA (encoding a ribosome-associated molecular cha-perone) is strongly shifted from the higher polysomal fractions towards fractions of free mRNA in response to oxidative stress, reflecting translational down-regulation. Table 1 shows the numbers of translationally regulated mRNAs in the different conditions, before and after fil-tering by visual inspection. Below, we will refer to the high-confidence data set as translationally regulated mRNAs.
Changes in mRNA levels and translation are globally coordinated
1 2 3 4 polysomes
60S 80S
40S free mRNA (a)
Four fractions hybridized to microarrays
20 40 60 80
10 20 40
30
R
el
ati
ve
R
N
A
a
m
ou
nt (
%
)
Fractions
Fractions 1 2 3 4 5 6 7 8 9 10 11 12
1 2 3 4
(b)
Re
la
tiv
e RNA
a
m
ou
nt
Fractions Profile stress
1 2 3 4
Profile control Profile stress
1 2 3 4
Profile control
Weight
3 4
1 2
Score control Score stress
Translation ratio (c)
Fractions Sum of differences
1 2 3 4
Fractions
10 30 50 70 90
sod1 sks2
R
el
at
iv
e R
N
A
am
ount
(%
)
1 2 3 4
Fractions
Control (0 min)
15 min stress
60 min stress Heat stress Oxidative stress
(d)
Medium resolution High resolution
High ribosome occupancy Low ribosome
[image:3.595.60.538.90.587.2]occupancy
showed translational regulation after the exposure to DNA damage (Table 1; Additional file 2). Notably, the translationally up-regulated mRNAs for all three stress conditions were significantly enriched in up-regulated CESR genes (P ~ 9 × 10-55 to 2 × 10-22), while transla-tionally down-regulated mRNAs were significantly
enriched in down-regulated CESR genes (P ~ 3 × 10-173
to 5 × 10-80) [3,7]. These substantial overlaps between CESR genes and translationally regulated genes suggest that mRNAs regulated at the level of transcription are often also regulated in the same direction at the level of translation.
To directly compare the regulation of mRNA abun-dance with the regulation of translation, we also mea-sured changes in relative mRNA levels by expression profiling of the same cell samples used for translational profiling. These mRNA expression data were highly similar to those previously described [3]. Table 1 shows the numbers of mRNAs whose levels substantially change in the various stress conditions, compared to the numbers of translationally regulated mRNAs. The response to heat was more rapid than the response to oxidative stress, which is reflected in both translational and mRNA up-regulation peaking at 15 minutes in the former and at 60 minutes in the latter stress. The response to DNA damage was relatively small compared to the other two stresses, both at the translation and mRNA levels. The down-regulation of translation was much more pronounced in oxidative stress than in the other stresses.
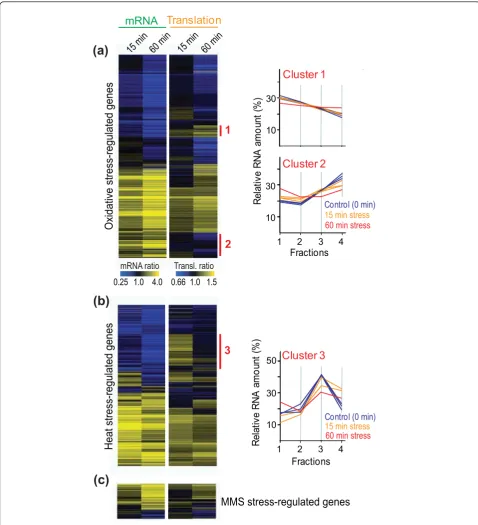
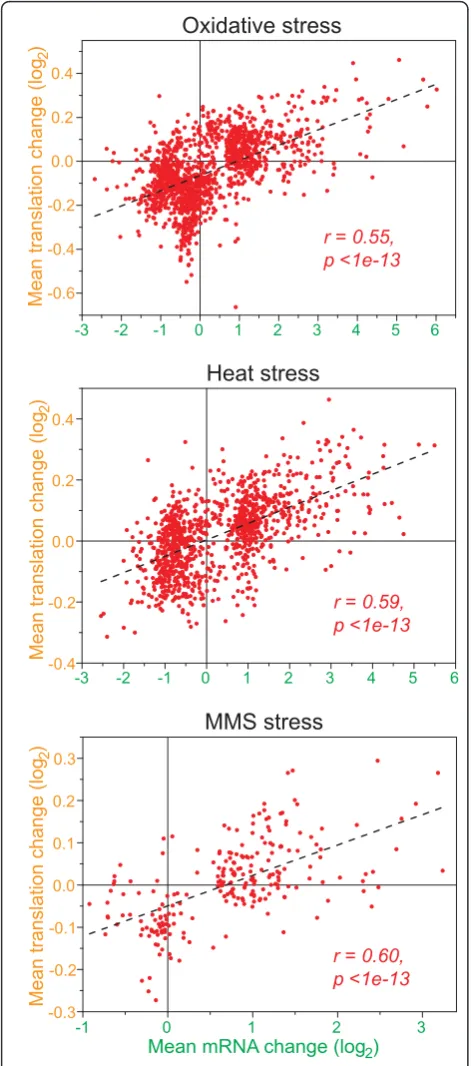
We then clustered the profiles of all the mRNAs that showed substantial changes in abundance and/or trans-lation in the different stress conditions (Figure 2; Table 1). This analysis highlights the overall coordination between mRNA and translation profiles, which were typically regulated in the same direction. Accordingly, the average translation and expression ratios for the regulated mRNAs were significantly positively correlated in all stress conditions tested (Figure 3). Taken together, along with results on transcriptional control for these
genes [3] (S Marguerat, K Lawler, A Brazma and JB, submitted), these data strongly support the idea that, during environmental stress in fission yeast, most mRNAs are regulated both at the level of transcription and at the level of translation in a concordant manner. Moreover, regulation at the level of mRNA turnover during oxidative stress is also globally coordinated with transcription (S Marguerat, K Lawler, A Brazma and JB, submitted). It is not known how such global coordina-tion at multiple levels of gene expression is achieved by the cells.
Genes differentially regulated at mRNA and translational levels
Although transcriptional and translational regulation were generally coordinated, we detected substantial gene groups that opposed this global trend (indicated as clus-ters 1 to 3 in Figure 2). The 74 genes of cluster 1 were translationally up-regulated in response to oxidative stress, most notably at 60 minutes, while their mRNA levels were down-regulated (Figure 2a; Additional file 3). No strong enrichment for functional categories was evi-dent, apart from an overlap with genes that are strongly periodically regulated during the cell cycle (P ~ 4 × 10 -7
) [37,38]. Most of the 16 overlapping genes function in mitosis or cell division and could be important for stress recovery to re-start the cell proliferation after H2O2-induced arrest.
The 123 genes of cluster 2 showed the reverse trend to cluster 1 genes: they were translationally down-regu-lated, while their mRNA levels were up-regulated (Fig-ure 2a; Additional file 3). Cluster 2 genes were enriched
for the Gene Ontology (GO) [39] terms ‘oxidoreductase
activity’(P < 1 × 10⁻⁸) and‘amino acid biosynthesis’ (P
~ 3 × 10⁻¹⁰). Cluster 2 was also enriched for genes
highly expressed at transcriptional and translational levels in unstressed cells [36,40]: they showed higher mRNA levels (P < 1 × 10⁻⁸), higher RNA polymerase II
occupancy (P ~ 8 × 10⁻³), longer mRNA half-life and
[image:4.595.57.538.101.187.2]polyA tails (P ~ 7 × 10⁻³ and 2 × 10⁻⁴, respectively) as
Table 1 Numbers of mRNAs regulated after stress exposure
Translation up Translation down mRNA up mRNA down
H2O2, 15 min 26 (33) 75 (123) 171 38
H2O2, 60 min 191 (275) 566 (575) 455 374
39°C, 15 min 245 (280) 119 (140) 370 129
39°C, 60 min 99 (126) 146 (202) 291 334
MMS, 15 min 3 (19) 5 (27) 27 0
MMS, 60 min 27 (48) 60 (151) 147 15
(a)
(b)
1 2 3 4
Fractions
(c)
mRNA
Translation
0.25 1.0 4.0 0.66 1.0 1.5
1
15 min 60 min 15 min 60 min
2
10 30 10 30
R
el
at
iv
e R
N
A
am
ount
(%
)
Cluster 1
Oxidative stress-regulated genes
Heat stress-regulated genes
3
Cluster 3
10 30
Re
la
tiv
e RNA
a
m
ou
nt
(%
)
50
1 2 3 4
Fractions
MMS stress-regulated genes
mRNA ratio Transl. ratio
Control (0 min) 15 min stress
60 min stress
Cluster 2
Control (0 min) 15 min stress
[image:5.595.57.536.88.614.2]60 min stress
well as higher ribosome occupancy and density (P < 1 × 10⁻⁸ and 4 × 10⁻³, respectively) compared to all mRNAs in unstressed cells. Shorter mRNAs are more efficiently translated in unstressed cells [13], but cluster 2 genes were not biased with respect to mRNA size. It is possi-ble that the antagonistic translational down-regulation, which is maximal at 60 minutes after stress induction, balances protein production of these highly expressed genes for eventual stress recovery.
The 208 genes of cluster 3 showed a transient boost in translation in response to heat, but their mRNA levels were all down-regulated (Figure 2b; Additional file 3). Cluster 3 was strongly enriched for genes encoding riboso-mal proteins (P ~ 3 × 10-147). In contrast, in response to oxidative stress, genes for ribosomal proteins showed simi-lar translation profiles to unstressed cells at 15 minutes before becoming strongly down-regulated at the transla-tional level at 60 minutes. Cell growth and proliferation are tightly linked to ribosome biogenesis [41]; the transla-tional up-regulation of ribosomal protein genes at 15 min-utes in heat stress could therefore reflect a transient boost in growth in response to the shift from 32°C to 39°C, as it takes some time to reach temperature equilibrium and
Schizosaccharomyces pombeshows the fastest growth at
approximately 35°C. At 60 minutes in heat stress, however, most of the cluster 3 genes became translationally down-regulated (Figure 2b), probably reflecting subsequent stal-ling of growth at 39°C. Intriguingly, a minority of seven ribosomal protein genes did not become transiently induced at the translational level in heat (rpl301,rpl302, rpl401,rpl402,rpl501,rps401,rps403), which might reflect functional specialization of different ribosomal proteins as suggested for budding yeast [42].
Concordant changes at mRNA and protein levels for induced but not for repressed genes
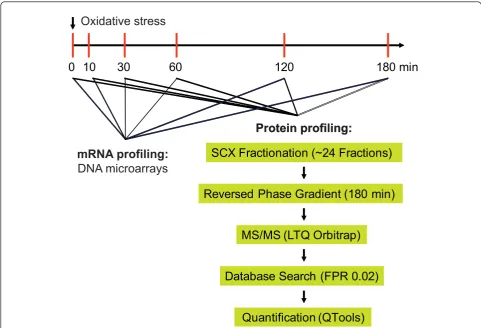
Given that changes in mRNA levels and in translation were largely coordinated, we expected that changes in protein levels mostly reflect changes in mRNA levels. We applied a proteomics approach to determine the relative changes in protein levels at multiple times after addition of oxidative stress compared to unstressed cells (Figure 4). The same samples were also interrogated with micro-arrays for mRNA expression profiling. Two independent biological repeats were performed for protein and mRNA profiling. We could obtain spectrum count data for 4,644
S. pombe proteins in at least one sample, and could
detect 2,147 proteins in all 12 samples of both repeats (minimum of two identified unique peptides per protein; Additional file 4). Of these 2,147 proteins, 234 (11%) showed significant changes in abundance during the stress time course (Materials and methods).
gol
(
eg
na
hc
noi
tal
sn
art
n
ae
M
2
)
-3 -2 -1 0 1 2 3 4 5 6
-0.6 -0.4 -0.2 0.0 0.2 0.4
r = 0.55, p <1e-13
gol
(
eg
na
hc
noi
tal
sn
art
n
ae
M
2
)
gol
(
eg
na
hc
noi
tal
sn
art
n
ae
M
2
)
Oxidative stress
-3 -2 -1 0 1 2 3 4 5 6
-0.4 -0.2 0.0 0.2 0.4
Heat stress
r = 0.59, p <1e-13
-1 0 1 2 3
-0.3 -0.2 -0.1 0.0 0.1 0.2 0.3
MMS stress
[image:6.595.56.292.89.623.2]Mean mRNA change (log2) r = 0.60, p <1e-13
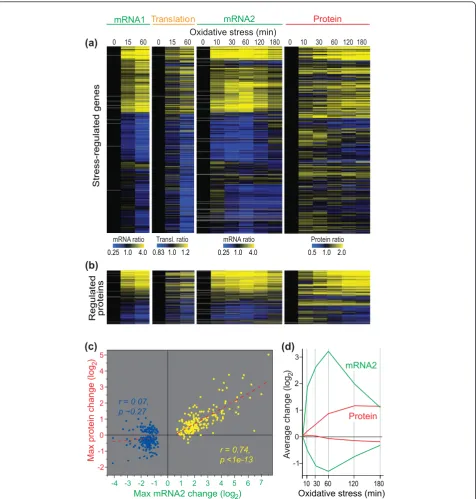
Figure 5a shows the expression profiles of all genes whose mRNA abundance was regulated during oxidative stress and whose proteins could be detected in all 12 samples. The data for transcriptome profiling in the two experiments (mRNA1 and mRNA2, performed with dif-ferent microarray platforms and in difdif-ferent laboratories) were highly similar overall. Moreover, changes in mRNA and translation profiles were largely mirrored by changes in protein profiles, especially for up-regulated transcripts (Figure 5a). The inverse analysis, starting from proteins whose profiles significantly changed dur-ing oxidative stress, showed a similar picture of highly concordant up-regulation at multiple regulatory levels (Figure 5b). While the genes up-regulated at the mRNA level produced up-regulation of the corresponding pro-teins, the down-regulated mRNAs showed much weaker relationships with protein profiles (Figure 5a,b). Accord-ingly, the linear correlation between maximal mRNA
and protein changes was highly significant for up-regu-lated mRNAs, while there was no correlation for down-regulated mRNAs (Figure 5c). This pattern was also evi-dent from the average mRNA and protein expression profiles (Figure 5d).
Although we limited our analysis to those proteins that were detectable in all conditions, the poor correla-tion between down-regulated mRNAs and correspond-ing proteins could reflect that low abundance proteins are less reliably quantified by mass spectrometry. On the other hand, it is plausible that this poor correlation reflects the biological reality of protein regulation, as proteins with long half lives are expected to maintain stable expression for some time after shutting down production. Notably, similar findings were recently reported by Leeet al. [33] during osmotic stress in bud-ding yeast. These authors applied mathematical model-ing to their transcriptome and proteome data sets,
0 10
30
60
120
180 min
SCX Fractionation (~24 Fractions)
Reversed Phase Gradient (180 min)
Database Search (FPR 0.02)
Quantification (QTools)
MS/MS (LTQ Orbitrap)
Oxidative stress
Protein profiling:
Protein profiling:
[image:7.595.56.538.88.416.2]mRNA profiling:
DNA microarrays
Figure 4Proteome profiling during oxidative stress. Scheme delineating the experimental procedures applied to measure protein levels at different time points immediately before and after exposure to H2O2. Cells were harvested at the indicated time points, followed by preparation of protein lysates and digestion of proteins into peptides. Peptides were separated by strong ion exchange SCX chromatography into 24 fractions. Each fraction was separated by reversed phase chromatography and directly eluted into a ThermoFisher LTQ Orbitrap mass
(a)
mRNA1 Translation
0.25 1.0 4.0 0.83 1.0 1.2
Stress-regulated genes
mRNA ratio Transl. ratio
Oxidative stress (min)
0 15 60 0 15 60 0 10 30 60 120 180 0 10 30 60 120 180
mRNA2 Protein
0.25 1.0 4.0
mRNA ratio Protein ratio
0.5 1.0 2.0 (b)
Regulated proteins
(c)
10 30 60 120 180
2
Oxidative stress (min) mRNA2
Protein 1
g
ol(
eg
na
hc
eg
ar
ev
A
2
)
3
0
-1
(d)
-4 -2 0 2 4 6
-2 -1 0 1 2 3 4 5
gol
(
eg
na
hc
ni
et
or
p
xa
M
Max mRNA2 change (log
-3 -1 1 3 5 7
2
)
2) r = 0.74, p <1e-13
[image:8.595.62.539.88.588.2]r = 0.07, p ~0.27
Figure 5mRNA, translation, and protein regulation during oxidative stress.(a)Hierarchical cluster analysis with columns representing experimental time points and rows representing 811 genes whose mRNAs showed significant expression changes after exposure to H2O2and whose proteins could be detected in all conditions. mRNA1: mRNA expression relative to the unstressed samples is color coded as indicated at the bottom, using same samples as for the translation experiment (Figure 2). Translation: translational efficiency relative to the unstressed samples is color coded as indicated at the bottom. mRNA2: mRNA expression relative to the unstressed samples is color coded as indicated at the bottom, using the same samples as for the proteome experiment. Protein: protein expression relative to the unstressed samples is color coded as indicated at the bottom. Average data of biological repeats are shown, with missing data in gray.(b)Cluster analysis as in (a) for the 232 genes that encode proteins showing significant changes in expression in the proteome experiment and with data in >50% of all conditions used for clustering.(c)Scatter plot showing linear regressions of the maximum average log2changes in mRNA and protein expression across the time-course experiment mRNA2/Protein shown in (a) for proteins that were detected in all conditions. Yellow dots, 193 genes showing >1.5-fold induction in mRNA expression after exposure to H2O2in at least 4 of 7 stress time points in experiments mRNA1 and mRNA2 shown in (a); blue dots, 226 genes showing >1.5-fold repression in mRNA expression after exposure to H2O2in at least 4 of 7 stress time points in
suggesting that reduction in transcript abundance may serve to redirect ribosomes to newly produced mRNAs.
The dynamic range for regulation of mRNA abun-dance was substantially larger than for regulation of pro-tein abundance (Figure 5a,b,d). Similar results were obtained in a recent study in budding yeast applying a different proteomics approach [33]. Moreover, while most up-regulated mRNAs transiently peaked in expres-sion at 60 minutes after stress induction and then decreased again, the corresponding proteins showed a delayed and gradual increase in expression up to 180 minutes (Figure 5a,b,d). The delayed up-regulation of proteins may reflect the time required for translation along with protein half-lives. Similar mRNA and protein expression patterns have recently been observed in bud-ding yeast [33,43]. Lee et al. [33] have shown that the
‘burst’in mRNA expression serves to accelerate protein expression before mRNA levels adjust to maintain a new steady-state.
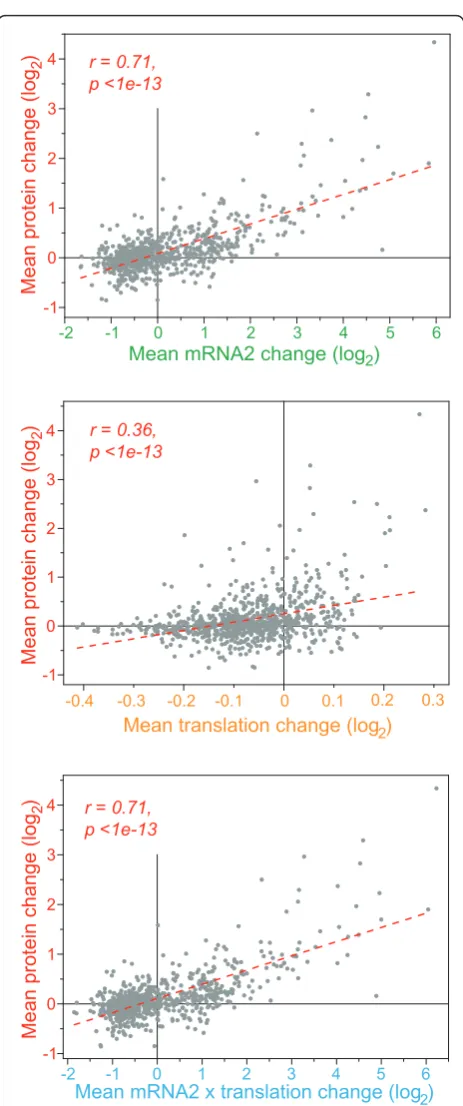
[image:9.595.306.538.82.636.2]Overall, the average changes in protein expression were substantially correlated with corresponding changes in mRNA expression and, to a lesser extent, with changes in translation (Figure 6). Factoring in both transcription and translation by simply multiplying rela-tive mRNA and translational changes, however, did not further improve the correlation with protein expression (Figure 6). The global correlation between mRNA and protein expression we observed here is stronger than the more modest correlations reported in previous papers [24-32], but is comparable to higher correlations reported in some smaller-scale studies [44,45] and recent global studies [33,34].
To explore any effects of post-transcriptional regula-tion during oxidative stress, we identified genes that went against the overall trend of concordant regulation at mRNA and protein levels. Only 22 and 19 proteins showed increased and decreased expression, respectively, in the absence of changes in mRNA expression (Addi-tional file 5). Translation of the corresponding mRNAs was not strongly regulated, however. These data raise the possibility of additional regulation at the protein level, by stress-induced protein stabilization or degrada-tion. A higher number of proteins did not show signifi-cant expression changes, although the corresponding mRNAs showed increased or decreased expression (63 and 156 mRNAs, respectively; Additional file 5). It is likely that the latter reflect the overall limited correla-tion between down-regulated mRNAs and protein expression discussed above (Figure 5). However, some of these discrepancies could also be explained by com-pensatory regulation at the level of translation, especially for the mRNAs with increased expression: 16 of the 63 up-regulated mRNAs were translationally down-regu-lated (cluster 2 genes in Figure 2a), but only 2 of the
Mean translation change (log2) Mean mRNA2 change (log2)
-2 -1 0 1 2 3 4 5 6
-1 0 1 2 3 4
gol
(
eg
na
hc
ni
et
or
p
na
e
M
2
) r = 0.71,
p <1e-13
-0.4 -0.3 -0.1 0 0.1-0.2 0.2 0.3 -1
0 1 2 3 4
r = 0.36, p <1e-13
gol
(
eg
na
hc
ni
et
or
p
na
e
M
2
)
-2 -1 0 1 2 3 4 5 6 -1
0 1 2 3 4
gol
(
eg
na
hc
ni
et
or
p
na
e
M
2
)
Mean mRNA2 x translation change (log2)
r = 0.71, p <1e-13
156 down-regulated mRNAs were translationally up-regulated (cluster 1 genes in Figure 2a). These patterns suggest that, in some cases, translation is regulated to counter the stress-induced changes in mRNA expression so that the resulting protein expression does not sub-stantially change. It is possible that the proteins encoded by these mRNAs are not immediately required under the given condition but are prepared at the mRNA level to become rapidly available on short notice (’translation on demand’) [46]. The majority of cluster 1 and 2 genes showed changes in protein expression consistent with the changes in mRNA expression, indicating that, in most cases, transcriptional regulation dominates transla-tional regulation. This conclusion is supported by the findings that mRNA expression correlated better than translational changes with protein expression, and fac-toring in translation did not improve the overall correla-tion (Figure 6). Finally, a few proteins showed abundance changes in the opposite direction to their mRNAs: 20 proteins increased and 12 proteins decreased in expression, while the corresponding mRNAs decreased and increased, respectively (Addi-tional file 5). While these few exceptions could reflect technical noise, it was striking that several ribosomal proteins and translation factors showed such opposite regulation. This finding raises the possibility of some remodeling of the translation machinery via regulation of protein stability and the involvement of specialized ribosome subunits during stress [42].
Conclusions
This study analyzed the global changes in mRNA, trans-lation, and protein profiles in response to environmental stress in fission yeast. We observed strong overall con-cordance between changes in mRNA and changes in translation, for both induced and repressed genes, in response to three different insults: oxidative stress, heat shock, and DNA damage caused by MMS. We have pre-viously reported that mRNAs that are efficiently tran-scribed are also more efficiently translated under an unstressed steady-state condition, leading to a ‘rich get-ting richer’ effect [36]. The data presented here indicate that transcriptional changes during stress are often accompanied by translational changes in the same direc-tion. Such homo-directional changes in transcription and translation (termed ‘potentiation’) have also been reported in budding yeast [18,47,48]. How might such coordination of transcription and translation be achieved? The RNA polymerase II subunits Rpb4 and Rpb7 shuttle from the nucleus to the cytoplasm where they promote efficient initiation of translation [49], which provides a potential mechanism to integrate tran-scriptional and translational regulation. Moreover, in fis-sion yeast, the translation factor Int6 and the MAPK
Sty1 are involved in both transcriptional and transla-tional responses to stress [50-54], although the detailed mechanisms are not clear. Finally, there is strong evi-dence that translational repression and mRNA decay are linked [55,56], which could also contribute to the coor-dinated regulation of mRNA expression and translation.
Besides the overall concordant regulation of transcrip-tion and translatranscrip-tion, we identified gene clusters that were antagonistically regulated at the levels of mRNA and translation. Around 200 genes each showed such antagonistic regulation in oxidative and heat stress, but the types of genes and the patterns of regulation were unique for each stress. These data highlight the sophisti-cation and fine-tuning of stress-regulated gene expres-sion, which may promote a balanced and coordinated protein production for stress survival and recovery.
We also determined relative changes in protein abun-dance during oxidative stress, with approximately 43% of all fission yeast proteins producing robust data. Changes in protein expression were delayed compared to changes in mRNA expression, but we observed a strong overall concordance between mRNA and protein profiles, but less so between translation and protein files. Moreover, the correlation between mRNA and pro-tein expression did not significantly improve after factoring in translation, and protein expression tended to reflect mRNA expression in cases where transcription and translation were regulated antagonistically. We therefore conclude that transcription dominates gene regulation during oxidative stress, and most variance in protein expression can be explained by changes in mRNA expression. Under the condition analyzed, post-transcriptional control may therefore be mainly applied to support transcriptional control, leading to a more robust and coordinated response, but also to regulate groups of specialized genes.
protein abundance, especially in stressed cells that show growth arrest. The findings that reduced mRNA sion does not necessarily lead to reduced protein expres-sion during stress in two evolutionarily distant yeasts has important implications for transcriptome analyses, as reduced mRNA expression is typically interpreted to reflect reduced expression, and dispensability, of the corresponding proteins.
Materials and methods
S. pombestrains and growth conditions
All stress experiments were performed with wild-type strains (972 h- for the translational profiling
experi-ments, DS448/2 h-leu1-32 ura4-d18 for the proteomics
experiments). Unless indicated otherwise, cells were exponentially grown at 32°C in rich medium (supple-mented yeast extract medium [57]). Oxidative stress was
induced by the addition of H2O2 (Sigma-Aldrich,
Gil-lingham, Dorset, UK) to a final concentration of 0.5 mM, DNA damage was induced by the addition of MMS (Sigma-Aldrich) to a final concentration of 0.02 % v/v, and heat stress was induced by moving the culture flask with growing cells from 32°C to a 39°C water bath.
Translational profiling
To study translational regulation in response to environ-mental stress, medium-resolution polysome profiling was performed. Preparation of cell lysates and polysome fractionation was done as described [36], with the modi-fication that cycloheximide was added directly to a final
concentration of 100μg/ml when cells were harvested.
Twelve fractions were collected during polysome fractio-nation. Fractions 1 to 3, 4 to 6, 7 to 9, and 10 to 12 were combined, respectively, into four pools. RNA from each pool was precipitated overnight at -20°C after the addition of an equal volume of 100% ethanol. After cen-trifugation at 4°C for 90 minutes, the pellets were air
dried and dissolved in 100μl DEPC-treated water. The
RNA was then purified using RNeasy columns (Qiagen,
Crawley, West Sussex, UK), eluted with 30μl
DEPC-treated water, and 10μl of RNA from each of the four
pools was labeled using a mix of oligo(dT)-primers and
random hexamers, the SuperScript™ Direct cDNA
Labeling System (Invitrogen, Grand Island, NY, USA), and Cy3/Cy5-dCTP (GE Healthcare, Chalfont St Giles, Bucks, UK). The labeled RNA from each pool was hybridized against labeled genomic DNA as a reference
ontoS. pombe spotted microarrays containing all known
and predicted genes and normalized using a customized script as described [58]. DNA labeling was performed
using the Bioprime® DNA labeling system (Invitrogen)
and Cy3/Cy5-dCTP (Amersham) according to the man-ufacturer’s instructions. Labeled DNA was purified using the QIAquick PCR purification kit (Qiagen) or the
Illustra CyScribe GFX purification kit (GE Healthcare) and was eluted in a volume of 100μl. One separate con-trol was used for each round of translational profiling. The numbers of independent biological repeats were as follows: untreated control, 4 repeats; 15 minutes H2O2, 3 repeats; 60 minutes H2O2, 1 repeat; 15 minutes MMS, 2 repeats; 60 minutes MMS, 1 repeat; 15 minutes 39°C, 2 repeats; 60 minutes 39°C, 1 repeat.
Analysis of translational profiling data
(translation ratio) were applied, and genes that passed the cutoffs from either criteria were pooled to generate a combined set of genes. Translational profiles from this combined gene set were then visually inspected to gen-erate a conservative, curated data set of translationally regulated mRNAs. The criteria used for visual inspec-tion were as follows. The polysome profiles had to be similar among different repeats of control and stress samples, but had to be consistently different between the control and the stress samples. Moreover, a down-regulation in translation had to be reflected by both an increase of a given mRNA in fractions 1 to 2 and by a concomitant decrease in fractions 3 to 4, whereas an up-regulation in translation had to exhibit the inverse trend.
mRNA expression profiling
To measure changes in mRNA expression for the sam-ples used for translational profiling, labeled total mRNA from stressed cells was competitively hybridized against labeled total mRNA from unstressed control cells on the same spotted microarrays [58]. RNA extraction, microarray hybridization, washing, and scanning was done as described [36,58]. RNA labeling was performed
using the SuperScript™ Direct cDNA Labeling System
(Invitrogen) with a mix of oligo(dT)-primers and ran-dom hexamers, and Cy3/Cy5-dCTP (Amersham) according to the manufacturer’s instructions, except that
2 μl instead of 3 μl of Cy-dyes per labeling reaction
were used. Processing and normalization of microarray data were done using our standard script [58]. In the case of one time course in response to H2O2, labeled total mRNA from each time point (0, 15, and 60 min-utes) was competitively hybridized to a pooled reference sample, consisting of a mixture of mRNA from all time points, and microarray data were then normalized to time point 0 (control).
To measure changes in mRNA expression for the samples used for proteomics, cells were harvested by centrifugation, cells were washed in a buffer containing 150 mM NaCl, 10 mM EDTA, 50 mM NaF and 1 mM NaN3, and subjected to RNA isolation as follows: 5 ml RNAzol (Tel-Test, Inc., Friendswood, Texas, USA) pre-heated to 65°C and 1 ml silica beads (BioSpec, Bartles-ville, Oklahoma, USA) were added to the cell pellets, and the tubes were subjected to three cycles of 2 min-utes vortexing, followed by 5 minmin-utes heating at 65°C.
Chloroform (500μl) was added, followed by 5 minutes
incubation on ice and centrifugation for 30 minutes at 5,000g. Then, 2.5 ml of the aqueous layer was removed, followed by addition of 2 ml isopropanol and incubation on ice for 20 minutes. The samples were spun at 5,000g for 30 minutes, and the liquid was removed by vacuum aspiration. The resulting pellets were washed with cold
80% ethanol, dried and resuspended in RNAse-free
water. Total RNA (100μg) of each sample was further
purified using an RNAeasy kit (Qiagen) following the
manufacturer’s protocol. RNA was reverse transcribed
with Superscript II RT (Invitrogen), in the presence of aminoallyl-dUTP (dUTP:dTTP = 3:2) in reactions primed with oligo-dT. Following cleanup via QIAquick column (Qiagen) in Tris-free buffers, cDNAs were coupled to NHS-CyDye (GE Healthcare) in bicarbonate buffer. Coupled cDNAs were purified to remove uncoupled dye via QIAquick column purification. Cy3-labeled total RNA samples were competitively hybri-dized on cDNA microarrays [59] with Cy5 labeled RNA pooled from all six time points. A biological replicate was performed and analyzed as a dye swap (pool = Cy3, time series = Cy5). Datasets were normalized and log2 ratios were determined relative to the 0 minute time point.
Statistical analyses
The clustering analyses in Figure 2 were performed using Gene Tree Clustering based on average linkage in GeneSpring GX (Agilent, Santa Clara, California, USA) with the Spearman correlation as similarity measure. Enrichments for functional lists or Gene Ontology terms [39] were determined using the hypergeometric distribu-tion. Spearman rank correlations (r) and corresponding P-values were calculated using the cor.test function in the statistics package R (version 2.2.1). Pearson’s correla-tions and probabilities (two-tailed test) were calculated in OriginPro 8.5 (OriginLab Corporation, Northampton, Massachusetts, USA).
Two-dimensional liquid chromatography-tandem mass spectrometry analysis and protein quantification
Duplicate cell cultures were exposed to 0.5 mM H2O2 for the times indicated in Figure 4. Preparation of cell lysate, trypsin digestion, two-dimensional liquid chroma-tography-tandem mass spectrometry analysis, and data-base searching were performed exactly as described
previously [60]. In total, 4,644 S. pombe proteins were
(determined by F-statistics and least squares estimates) [61]. A major advantage of this approach is that it not only preserves the order of the time points but also identifies differentially expressed proteins and classifies these proteins based on their temporal expression pro-files. The 234 significantly changed proteins (P < 0.05) were classified into four categories based on the expres-sion profiles using an Excel macro (linear up, linear down, quadratic convex, quadratic concave) [61]. Dupli-cate values for each time point were averaged to obtain a single value for each protein at each time point. All data are contained in Additional file 3.
Accession numbers
All microarray data have been submitted to ArrayEx-press under accession numbers [E-MTAB-851] (transla-tional profiling experiments) and [E-MTAB-891] (proteomics experiments).
Additional material
Additional file 1: Data of all mRNA and translation ratios (Figure2), and data from translational profiling analysis (percentage RNA in each fraction, sum of differences, and scores (Figure1c).
Additional file 2: Annotated list of genes in clusters 1 to 3 (Figure
2).
Additional file 3: Annotated list of translationally regulated genes in three stress conditions (Table1).
Additional file 4: Proteomics data including raw spectrum count measurements, normalized averaged data and list of significantly changed proteins; mRNA data obtained in parallel are also included.
Additional file 5: Annotated list of genes showing discordant regulation at mRNA and protein levels.
Abbreviations
CESR: core environmental stress response; MAPK: mitogen-activated protein kinase; MMS: methylmethane sulfonate.
Acknowledgements
We thank Samuel Marguerat, Juan Mata and Theodora Sideri for helpful comments on the manuscript, Samuel Marguerat for help with the ArrayExpress submission, and L Brill and K Motamedchaboki for mass spectrometry and data processing. Research in the Bähler lab was funded by Cancer Research UK, by PhenOxiGEn, an EU FP7 research project, and by a Wellcome Trust Investigator Award. Research in the Wolf lab was funded by NIH grant GM59780 and NSF grant 0920229.
Author details
1Department of Genetics, Evolution and Environment and UCL Cancer
Institute, University College London, Darwin Building, Gower Street, London WC1E 6BT, UK.2Signal Transduction Program, Sanford-Burnham Medical Research, 10901 North Torrey Pines Road, La Jolla, CA 92037, USA.3The Salk Institute for Biological Studies, 10010 North Torrey Pines Road, La Jolla, CA 92037-1099, USA.
Authors’contributions
DHL, MWS, and SW carried out the genomic and proteomic experiments, and participated in the study design and in data analysis. DAW and JB conceived the study, and participated in the study design and in data
the final manuscript.
Competing interests
The authors declare that they have no competing interests.
Received: 19 December 2011 Revised: 5 April 2012 Accepted: 18 April 2012 Published: 18 April 2012
References
1. Gasch AP:Comparative genomics of the environmental stress response in ascomycete fungi.Yeast2007,24:961-976.
2. Lopez-Maury L, Marguerat S, Bähler J:Tuning gene expression to changing environments: from rapid responses to evolutionary adaptation.Nat Rev Genet2008,9:583-593.
3. Chen D, Toone WM, Mata J, Lyne R, Burns G, Kivinen K, Brazma A, Jones N, Bähler J:Global transcriptional responses of fission yeast to
environmental stress.Mol Biol Cell2003,14:214-229.
4. Gatti L, Chen D, Beretta GL, Rustici G, Carenini N, Corna E, Colangelo D, Zunino F, Bähler J, Perego P:Global gene expression of fission yeast in response to cisplatin.Cell Mol Life Sci2004,61:2253-2263.
5. Rustici G, van Bakel H, Lackner DH, Holstege FC, Wijmenga C, Bähler J, Brazma A:Global transcriptional responses of fission and budding yeast to changes in copper and iron levels: a comparative study.Genome Biol 2007,8:R73.
6. Watson A, Mata J, Bähler J, Carr A, Humphrey T:Global gene expression responses of fission yeast to ionizing radiation.Mol Biol Cell2004, 15:851-860.
7. Chen D, Wilkinson CR, Watt S, Penkett CJ, Toone WM, Jones N, Bähler J: Multiple pathways differentially regulate global oxidative stress responses in fission yeast.Mol Biol Cell2008,19:308-317.
8. Pancaldi V, Schubert F, Bähler J:Meta-analysis of genome regulation and expression variability across hundreds of environmental and genetic perturbations in fission yeast.Mol BioSystems2010,6:543-552.
9. Toone WM, Jones N:Stress-activated signalling pathways in yeast.Genes Cells1998,3:485-498.
10. Ikner A, Shiozaki K:Yeast signaling pathways in the oxidative stress response.Mut Res2005,569:13-27.
11. Hinnebusch AG:Translational regulation of GCN4 and the general amino acid control of yeast.Annu Rev Microbiol2005,59:407-450.
12. Holcik M, Sonenberg N:Translational control in stress and apoptosis.Nat Rev Mol Cell Biol2005,6:318-327.
13. Lackner DH, Bähler J:Translational control of gene expression from transcripts to transcriptomes.Int Rev Cell Mol Biol2008,271:199-251. 14. Yamasaki S, Anderson P:Reprogramming mRNA translation during stress.
Curr Opin Cell Biol2008,20:222-226.
15. Spriggs KA, Bushell M, Willis AE:Translational regulation of gene expression during conditions of cell stress.Mol Cell2010,40:228-237. 16. Kuhn KM, DeRisi JL, Brown PO, Sarnow P:Global and specific translational
regulation in the genomic response of Saccharomyces cerevisiae to a rapid transfer from a fermentable to a nonfermentable carbon source.
Mol Cell Biol2001,21:916-927.
17. Smirnova JB, Selley JN, Sanchez-Cabo F, Carroll K, Eddy AA, McCarthy JE, Hubbard SJ, Pavitt GD, Grant CM, Ashe MP:Global gene expression profiling reveals widespread yet distinctive translational responses to different eukaryotic translation initiation factor 2B-targeting stress pathways.Mol Cell Biol2005,25:9340-9349.
18. Preiss T, Baron-Benhamou J, Ansorge W, Hentze MW:Homodirectional changes in transcriptome composition and mRNA translation induced by rapamycin and heat shock.Nat Struct Biol2003,10:1039-1047. 19. Shenton D, Smirnova JB, Selley JN, Carroll K, Hubbard SJ, Pavitt GD,
Ashe MP, Grant CM:Global translational responses to oxidative stress impact upon multiple levels of protein synthesis.J Biol Chem2006, 281:29011-29021.
20. Swaminathan S, Masek T, Molin C, Pospisek M, Sunnerhagen P:Rck2 is required for reprogramming of ribosomes during oxidative stress.Mol Biol Cell2006,17:1472-1482.
22. Melamed D, Pnueli L, Arava Y:Yeast translational response to high salinity: global analysis reveals regulation at multiple levels.RNA2008, 14:1337-1351.
23. Warringer J, Hult M, Regot S, Posas F, Sunnerhagen P:The HOG pathway dictates the short-term translational response after hyperosmotic shock.
Mol Biol Cell2010,21:3080-3092.
24. Gygi SP, Rochon Y, Franza BR, Aebersold R:Correlation between protein and mRNA abundance in yeast.Mol Cell Biol1999,19:1720-1730. 25. Ghaemmaghami S, Huh WK, Bower K, Howson RW, Belle A, Dephoure N,
O’Shea EK, Weissman JS:Global analysis of protein expression in yeast.
Nature2003,425:737-741.
26. Greenbaum D, Colangelo C, Williams K, Gerstein M:Comparing protein abundance and mRNA expression levels on a genomic scale.Genome Biol2003,4:117.
27. Washburn MP, Koller A, Oshiro G, Ulaszek RR, Plouffe D, Deciu C, Winzeler E, Yates JR:Protein pathway and complex clustering of correlated mRNA and protein expression analyses in Saccharomyces cerevisiae.Proc Natl AcadSci2003,100:3107-3112.
28. de Godoy LMF, Olsen JV, Cox J, Nielsen ML, Hubner NC, Frohlich F, Walther TC, Mann M:Comprehensive mass-spectrometry-based proteome quantification of haploid versus diploid yeast.Nature2008,
455:1251-1254.
29. Soufi B, Kelstrup CD, Stoehr G, Frohlich F, Walther TC, Olsen JV:Global analysis of the yeast osmotic stress response by quantitative proteomics.Mol BioSystems2009,5:1337-1346.
30. Flory MR, Lee H, Bonneau R, Mallick P, Serikawa K, Morris DR, Aebersold R: Quantitative proteomic analysis of the budding yeast cell cycle using acid-cleavable isotope-coded affinity tag reagents.Proteomics2006, 6:6146-6157.
31. Fournier ML, Paulson A, Pavelka N, Mosley AL, Gaudenz K, Bradford WD, Glynn E, Li H, Sardiu ME, Fleharty B, Seidel C, Florens L, Washburn MP: Delayed correlation of mRNA and protein expression in rapamycin-treated cells and a role for Ggc1 in cellular sensitivity to rapamycin.Mol Cell Proteomics2010,9:271-284.
32. Weeks ME, Sinclair J, Butt A, Chung Y-L, Worthington JL, Wilkinson CRM, Griffiths J, Jones N, Waterfield MD, Timms JF:A parallel proteomic and metabolomic analysis of the hydrogen peroxide- and Sty1p-dependent stress response in Schizosaccharomyces pombe.Proteomics2006, 6:2772-2796.
33. Lee MV, Topper SE, Hubler SL, Hose J, Wenger CD, Coon JJ, Gasch AP:A dynamic model of proteome changes reveals new roles for transcript alteration in yeast.Mol Syst Biol2011,7:514.
34. Lundberg E, Fagerberg L, Klevebring D, Matic I, Geiger T, Cox J, Algenas C, Lundeberg J, Mann M, Uhlen M:Defining the transcriptome and proteome in three functionally different human cell lines.Mol Syst Biol 2010,6:450.
35. Buchan JR, Parker R:Eukaryotic stress granules: the ins and outs of translation.Mol Cell2009,36:932-941.
36. Lackner DH, Beilharz TH, Marguerat S, Mata J, Watt S, Schubert F, Preiss T, Bähler J:A network of multiple regulatory layers shapes gene expression in fission yeast.Mol Cell2007,26:145-155.
37. Rustici G, Mata J, Kivinen K, Lio P, Penkett CJ, Burns G, Hayles J, Brazma A, Nurse P, Bähler J:Periodic gene expression program of the fission yeast cell cycle.Nat Genet2004,36:809-817.
38. Marguerat S, Jensen TS, de Lichtenberg U, Wilhelm BT, Jensen LJ, Bähler J: The more the merrier: comparative analysis of microarray studies on cell cycle-regulated genes in fission yeast.Yeast2006,23:261-277.
39. Aslett M, Wood V:Gene Ontology annotation status of the fission yeast genome: preliminary coverage approaches 100%.Yeast2006,23:913-919. 40. Wilhelm BT, Marguerat S, Watt S, Schubert F, Wood V, Goodhead I,
Penkett CJ, Rogers J, Bähler J:Dynamic repertoire of a eukaryotic transcriptome surveyed at single-nucleotide resolution.Nature2008, 453:1239-1243.
41. Jorgensen P, Tyers M:How cells coordinate growth and division.Curr Biol 2004,14:R1014-1027.
42. Komili S, Farny NG, Roth FP, Silver PA:Functional specificity among ribosomal proteins regulates gene expression.Cell2007,131:557-571. 43. Vogel C, Silva GM, Marcotte EM:Protein expression regulation under
oxidative stress.Mol Cell Proteomics2011,10, M111.009217.
44. Lu P, Vogel C, Wang R, Yao X, Marcotte EM:Absolute protein expression profiling estimates the relative contributions of transcriptional and translational regulation.Nat Biotechnol2007,25:117-124.
45. Futcher B, Latter GI, Monardo P, McLaughlin CS, Garrels JI:A sampling of the yeast proteome.Mol Cell Biol1999,19:7357-7368.
46. Beyer A, Hollunder J, Nasheuer HP, Wilhelm T:Post-transcriptional expression regulation in the yeast Saccharomyces cerevisiae on a genomic scale.Mol Cell Proteomics2004,3:1083-1092.
47. MacKay VL, Li X, Flory MR, Turcott E, Law GL, Serikawa KA, Xu XL, Lee H, Goodlett DR, Aebersold R, Zhao LP, Morris DR:Gene expression analyzed by high-resolution state array analysis and quantitative proteomics: response of yeast to mating pheromone.Mol Cell Proteomics2004, 3:478-489.
48. Serikawa KA, Xu XL, MacKay VL, Law GL, Zong Q, Zhao LP, Bumgarner R, Morris DR:The transcriptome and its translation during recovery from cell cycle arrest in Saccharomyces cerevisiae.Mol Cell Proteomics2003, 2:191-204.
49. Harel-Sharvit L, Eldad N, Haimovich G, Barkai O, Duek L, Choder M:RNA polymerase II subunits link transcription and mRNA decay to translation.
Cell2010,143:552-563.
50. Udagawa T, Nemoto N, Wilkinson CRM, Narashimhan J, Jiang L, Watt S, Zook A, Jones N, Wek RC, Bähler J, Asano K:Int6/eIF3e promotes general translation and Atf1 abundance to modulate Sty1 MAPK-dependent Stress Response in Fission Yeast.J Biol Chem2008,283:22063-22075. 51. Nemoto N, Udagawa T, Ohira T, Jiang L, Hirota K, Wilkinson CRM, Bähler J,
Jones N, Ohta K, Wek RC, Asano K:The roles of stress-activated Sty1 and Gcn2 kinases and of the protooncoprotein homologue Int6/eIF3e in responses to endogenous oxidative stress during histidine starvation.J Mol Biol2010,404:183-201.
52. Berlanga JJ, Rivero D, Martin R, Herrero S, Moreno S, de Haro C:Role of mitogen-activated protein kinase Sty1 in regulation of eukaryotic initiation factor 2{alpha} kinases in response to environmental stress in Schizosaccharomyces pombe.Eukaryot Cell2010,9:194-207.
53. Asp E, Nilsson D, Sunnerhagen P:Fission yeast mitogen-activated protein kinase Sty1 interacts with translation factors.Eukaryot Cell2008, 7:328-338.
54. Dunand-Sauthier I, Walker CA, Narasimhan J, Pearce AK, Wek RC, Humphrey TC:Stress-activated protein kinase pathway functions to support protein synthesis and translational adaptation in response to environmental stress in fission yeast.Eukaryot Cell2005,4:1785-1793. 55. Coller J, Parker R:General translational repression by activators of mRNA
decapping.Cell2005,122:875-886.
56. Hendrickson DG, Hogan DJ, McCullough HL, Myers JW, Herschlag D, Ferrell JE, Brown PO:Concordant regulation of translation and mrna abundance for hundreds of targets of a human microRNA.PLoS Biol 2009,7:e1000238.
57. Moreno S, Klar A, Nurse P:Molecular genetic analysis of fission yeast Schizosaccharomyces pombe.Methods Enzymol1991,194:795-823. 58. Lyne R, Burns G, Mata J, Penkett CJ, Rustici G, Chen D, Langford C, Vetrie D,
Bähler J:Whole-genome microarrays of fission yeast: characteristics, accuracy, reproducibility, and processing of array data.BMC Genomics 2003,4:27.
59. Zhou C, Arslan F, Wee S, Krishnan S, Ivanov AR, Oliva A, Leatherwood J, Wolf DA:PCI proteins eIF3e and eIF3m define distinct translation initiation factor 3 complexes.BMC Biology2005,3:14.
60. Brill LM, Motamedchaboki K, Wu S, Wolf DA:Comprehensive proteomic analysis of Schizosaccharomyces pombe by two-dimensional HPLC-tandem mass spectrometry.Methods2009,48:311-319.
61. Liu H, Tarima S, Borders AS, Getchell TV, Getchell ML, Stromberg AJ: Quadratic regression analysis for gene discovery and pattern recognition for non-cyclic short time-course microarray experiments.
BMC Bioinformatics2005,6:106. doi:10.1186/gb-2012-13-4-r25