THE AUDITORY FINGERPRINT:
MULTIDIMENSIONAL CHARACTERIZATION
OF INDIVIDUAL PITCH PERCEPTION
IN MUSICIANS
Jan Benner
THE AUDITORY FINGERPRINT:
MULTIDIMENSIONAL
CHARACTERIZATION
OF INDIVIDUAL PITCH PERCEPTION
IN MUSICIANS
Jan Benner
Master of Science by Research
University of Salford
School of Computing, Science and Engineering
Acoustics Research Centre
Contents
1 Introduction and Literature Review 1
1.1 Ambiguities in Sound Perception . . . 1
1.2 Individual Pitch Perception Mode . . . 4
1.3 Relative and Absolute Pitch Perception . . . 8
1.4 Frequency Discrimination in Musicians . . . 10
1.5 Auditory Imagery and Audiation . . . 11
1.6 Research Questions and Objectives . . . 12
2 Methods 14 2.1 Study Setting and Subjects . . . 14
2.2 Psychoacoustic Tests . . . 16
2.2.1 Pitch Perception Preference Test . . . 17
2.2.2 Musical Interval Recognition Test . . . 19
2.2.3 Quantitative Absolute Pitch Test . . . 20
2.2.4 Frequency Discrimination Threshold Test . . . 21
2.2.5 Advanced Measure of Music Audiation . . . 21
2.3 Statistics and Data Analyses . . . 22
3 Results 24 3.1 Statistical results . . . 24
3.1.1 Explorative Results . . . 24
3.1.2 Principal Component Analysis . . . 27
3.1.3 Hierarchical Cluster Analysis . . . 31
3.2 Auditory Fingerprints . . . 37
3.2.1 Characteristic Group Profiles . . . 37
3.2.2 Exemplary Individual Cases . . . 40
4 Discussion 43 5 Conclusions and Further Work 48 A Appendix 49 A.1 Data table . . . 50
A.3 Subject Questionnaire (German) . . . 52
A.4 Informed Consent (German) . . . 53
A.5 Ethical Approval (German) . . . 54
A.6 Technical Manual - Headphones . . . 55
A.7 Technical Manual - Interface . . . 56
A.8 Conference Poster (ASA 2017) . . . 57
List of Figures
1 Index of pitch perception, after Scheider et al. (2005). . . 6
2 AAT-test design, after Seither-Preisler et al. (2007). . . 7
3 Distribution of pitch perception index, after Ladd et al. (2013). . . 8
4 Distribution of subjects across University courses (school affinity). . . 15
5 Study population of the joint project, initially matched for musical aptitude (AMMA). . . 15
6 Study population of the joint project, initially screened for training intensity. 16 7 Examplary tone-pairs of Pitch Perception Preference Test, after Schneider et al. (2005a). . . 18
8 Tone-pair generation rules for Pitch Perception Preference Test, after Schnei-der et al. (2005a). . . 19
9 Musical Interval Recognition Test, after E. Hofmann (2012, unpublished). . 20
10 Quantitative Absolute Pitch Test, after Wengenroth et al. (2014). . . 20
11 Frequency Discrimination Threshold Test, after S. Ewert (AFC; Ewert, 2012). 21 12 Advanced Measure of Music Audiation, after E.E. Gordon (1989). . . 22
13 Statistical processing of psychoacoustic data based on PCA and Hierarchical cluster analysis. . . 23
14 Distribution of the overall played musical instruments (sorted clockwise) across subjects. . . 24
15 Frequency histograms, showing the overall distributions for age and the eight psychoacoustic parameters. . . 26
16 Scree-plot, showing the Eigenvalues of all extracted- and selected PCA com-ponents (color-coded). . . 29
17 Corresponding psychoacoustic parameters in component space after matrix rotation. . . 30
18 Individual distributions of component loads show high inter-individual vari-ability. . . 30
19 Boxplots, showing mean, range and outliers of individual data for the four selected components. . . 31
21 Denrogram, showing the cluster analysis results for the selected 3-cluster
solution (color-coded). . . 32 22 Cluster-specific distributions of school affinity and played musical
instru-ments (sorted clockwise) across subjects. . . 33
23 Barplots, showing the averaged values (normalized) for parameters and
com-ponents, with sifgnificant differences between clusters. . . 36
24 "Auditory fingerprints" averaged for each cluster, showing the combined
multi-parametric results offall aquired data, including additional
frequency-specific details of the Pitch Perception Preference Test. . . 38
25 Individual "auditory fingerprints", showing the combined multi-parametric
results off all aquired data for three exemplary cases, including additional frequency-specific details of the Pitch Perception Preference Test. . . 41
26 Three different modes of pitch perception preference, distinguished by the
List of Tables
1 Statistical tests for normal-distribution and homogeneity of variances. . . . 27
2 Communalities of psychoacoustic data based on the PCA results. . . 28 3 Eigenvalues and explained variances shown for each main component after
PCA extraction. . . 28
4 Rotated component matrix after rotation, showing the component loads for
each parameter. . . 29
5 Agglomeration schedule of cluster analysis, showing the resulting variance
reduction for the selected 3-cluster solution. . . 32
6 Cluster-specific descriptive results calculated for all parameters and
compo-nents. . . 34
Acknowledgements
I would like to thank my supervisor, Dr. William J. Davies, for his invaluable guidance, help and patience throughout my project. I would also like to thank my friends and colleagues
Dr. Peter Schneider and Dr. Maria Blatow, for always fruitful discussions and their continual
support, and Dr. Annemarie Seither-Preisler for her extensive statistical help and feedback
on my work. I would also like to thank my friends and colleagues Dr. Julia Reinhardt, Dr.
Thomas J. Re and Dr Manuela Utzinger, for their persistent help, correction reading and
Declaration
All contents of this thesis are the work of the author alone, except where acknowledgement
has been made. All verbatim extracts have been distinguished by quotation marks, and all
sources of information have been specifically acknowledged. All of the data collection and
analysis presented in this thesis are original works by the author, though select pieces of
work were jointly researched. Aspects of the joint research project have previously been
presented at the following conferences:
• Benner, J. et al. (2014). Auditory neuroplasticity in the adult musical brain.
Neuro-music V Conference, Dijon.
• Benner, J. et al. (2015). Neuroplasticity or predisposition: a longitudinal study of
auditory cortex morphology in musicians. OHBM Conference, Honolulu.
• Benner, J. et al. (2017). Longitudinal assessment of auditory cortex white matter
plasticity in musicians. Neuromusic VI Conference, Boston.
Aspects of the present thesis have previously been presented during a poster-session at the
following conference:
• Benner, J. et al. (2017). Differences in sound perception are reflected by individual
auditory fingerprints in musicians. ASA & EAA Conference, Boston. (Appendix 8)
Signed:
Abstract
Musicians have been repeatedly reported to show remarkable inter-individual differences in
elementary hearing functions, sound perception mode, musical instrument preference, per-formance style, as well as musical abilities such as absolute- and relative pitch perception or
auditory imagery (audiation). However, relevant literature in the field regarding perceptual
and psychophysical aspects of sound and particularly pitch perception is highly
contradic-tory, and subjective differences are mostly unconsidered. Moreover, it is largely unexplored
how individual differences in (musical) pitch perception are related to further musical
abili-ties and behavior. In the present work, “auditory fingerprints” were created basically based
on a composite of five psychoacoustic hearing tests assessing subjective pitch perception in
musicians. A total of 93 musicians, including 49 professionals and 44 amateurs, were
indi-vidually measured for: (a) pitch perception preference (holistic vs. spectral mode), (b) rel-ative pitch perception (musical interval recognition), (c) absolute pitch perception (“perfect
pitch”), (d) frequency discrimination threshold (just noticeable difference), and (e) auditory
imagery of tone-sequences. Overall, eight psychoacoustic parameters were extracted and
analyzed using statistical methods. In addition, preferences for musical instruments were
evaluated. At the individual level, the results show a high inter-individual variability across
the eight psychoacoustic parameters, reflecting clear individual differences in pitch
percep-tion and related musical abilities. In addipercep-tion, principal component analysis (PCA) revealed
four different main components to sufficiently represent coherent aspects of the
psychoa-coustic data, namely: tonal musicality, pitch timbre preference, low-band sensitivity and high-band sensitivity. At the group level, multi-parametric cluster analyses revealed three
sub-groups of subjects, showing significantly different results with respect to the underlying
perceptional patterns. Consequently, at least three different modes of pitch perception are
suggested, characterized by: 1. Pronounced analytic pattern recognition, focused on spectra
/timbre and sensitive to single tones; 2. Pronounced holistic pattern recognition, focused on (missing) fundamental pitch and rather insensitive to single tones; 3. Less pronounced
audiation and pitch detection abilities, linked to ambiguous multi-pitch sensations
(“bal-anced mode”). Taken together, the findings suggest that individual “auditory fingerprints”
extracted from psychoacoustic hearing tests, reflect remarkable inter-individual differences, but also typical patterns of perceiving (musical) pitch and sound. It can be concluded, that
specific auditory characteristics are related to the individual musical (instrument) preference,
Chapter 1
Introduction and Literature Review
1.1
Ambiguities in Sound Perception
During a curious historic debate between 1840 and 1850, the German physicists G. S. Ohm and A. Seebeck discussed the pitch sensation of complex tones in “Annalen der Physik und
Chemie”. Seebeck (1841) produced periodic sounds with the help of a mechanical siren,
whilst he controlled the suppression of odd harmonics. The pitch, which he associated with
the sound as a whole, always seemed to follow thefundamentalcomponent (F0), even if its
acoustic energy was weak. In contrast, Ohm (1843) reciprocated that Seebeck’s strongF0
pitch sensation, in absence of acoustic power, had to be based on an illusion. He argued,
that our ears perform a Fourier-like real-time frequency analysis. Thus each distinct pitch
sensation originates from a corresponding sinusoidal wave (harmonic) of a complex tone
-Ohm’s well-known “definition of tone”. Thereby the frequency of the lowest spectral com-ponent determines the pitch of the complex, while the other harmonics shape thetimbre of
a sound. After a further controversial debate (Seebeck, 1843; Ohm, 1844) Seebeck finally
closed the story by confessing, that higher harmonics produced by the siren are audible but
difficult to distinguish. He finally concluded, with a freely extended, however contradictory
interpretation of Ohm’s law, that the sound as a whole may produce a distinct pitch
corre-sponding to the periodicity of the sound pulses (Seebeck, 1844a; Seebeck, 1844b). Based
on the colliding statements about their subjective self-sensations, they unintentionally
re-ported highly individual perceptual differences in pitch sensation of complex tones for the
first time in research history. Two decades later Ohm’s statement was picked up by the Ger-man physicist and physiologist H. von Helmholtz, who has been known for his well trained
musical ears. In his work on “the sensation of tones as a physiological basis for the
the-ory of music” (von Helmholtz, 1863) he pointed out characteristic subjective differences in
sound perception. Basically he described two ways in which one may perceive a complex
tone: asyntheticmode, whereby harmonics “fuse in the whole mass of musical sound” and
ananalyticmode, based on the separate perception of single harmonics. Consequently, he
suggested that Seebeck (presumably being a synthetical listener) might not have been able to
lis-tener). Further, von Helmholtz discussed the difficulties of observing harmonics of complex
tones, sensation of tone-color, as well as the challenges of subjective sound analysis and the role of attention, in a remarkably detailed manner. Two decades later the Finnish phonetician
K. H. Pipping (1895) revived von Helmholtz’s hearing theory and introduced his idea of two
possible modes of pitch perception while perceiving a complex tone (here “clang” refers to
the German word “Klang” used by von Helmholtz):
“For a complex tone, we may direct our attention to the partials (tone pitch), but
it is also possible to pay attention to the total impression of the sound (clang
pitch); the latter pitch is not influenced by the absence of the fundamental, a
group of partials being sufficient to perceive this pitch.” (Pipping, 1895; as cited
in Plomp, 1967, p. 1528)
Here “tone pitch” may correspond to von Helmholtz’s descriptions of an analytic, and “clang
pitch” to a synthetic mode.
Beginning of the 20th century electronic devices could then be used for sound generation
and psychoacoustic measurements. The Hungarian physiologist and telephone engineer G.
von Békésy proved the frequency dependent localization of auditory stimuli in the cochlea,
as anticipated by von Helmholtz (Békésy, 1928). Afterwards the Dutch mathematician J. F. Schouten reanimated the historic debate of Seebeck and Ohm, by demonstrating that the
pitch sensation of periodic pulses generated by an optical siren (1/20th of the repetition time of 1/200s), devoid of the F0component (f0 = 200Hz), is associated with the
correspond-ing frequency of the missing fundamental (MF; Schouten, 1938). He concluded, that this
specific sensation could not be explained by a nonlinear difference tone emerging physically
at the auditory periphery. A conclusion which was in contrast to prior conclusions of von
Helmholtz and the American physicist (and telephone engineer) Fletcher (1924). Thereby,
Schouten claimed that Seebeck’s initial argument was basically correct. In further
experi-ments Schouten observed the periodicity of the envelope pattern of harmonic clusters to be
the same as the periodicity of theF0, even if theF0component was absent (Schouten, 1940a; Schouten, 1940b). He suggested, that such pitch sensations would be caused by insufficient
spectral resolution of the cochlea, based on neural detecting of periodic fluctuations in the
envelope pattern of harmonic clusters. As an essential statement of Schouten’s “residue
the-ory of pitch” the limited spectral resolving power of the inner ear may result in a sensation
corresponding to theMF:
“The lower harmonics can be perceived individually and have almost the same
pitch as when sounded separately. The higher harmonics, however, cannot be
perceived separately but are perceived collectively as one component (the residue)
with a pitch determined by the periodicity of the collective waveform, which is
equal to that of the fundamental tone.” (Schouten, 1940b, p. 991)
Later on R. J. Ritsma (1962) observed a clear upper limit in the harmonic order (h) for the
cochlear-resolved harmonics. Consequently, Schouten’s residue theory failed for an adequate
expla-nation of pitch. Ritsma found that the existence region could be roughly described by values of f < 5000Hzand harmonic order h ≤ 20. Further, in the 1970’s Ritsma and R. Plomp independently postulated adominance region for the strongest sensation of the MF, based
on the perception of resolved harmonics of lower orderh< 7 (Ritsma, 1967; Plomp, 1967). The following experiments of A. J. M. Houtsma and J. L. Goldstein (1972) indicated that
the pitch of complex tones is mediated by acentral processor that operates neural signals
from spectrally resolved harmonics in the cochlea. In a parallel important key experiment
by G. F. Smoorenburg (1970) two possible modes of hearingwere described, based on at
least 42 subjects (coworkers of his institute) in two repeated runs (one month follow-up). He
investigated in which way complex tones consisting of just two harmonic components (here defined as f0/h,hwith f0 =frequency of theMFandh =order of present harmonics) were perceived with respect to pitch. The first complex (complex-α: 200/9,10) consisted of har-monics with frequencies f1 = 1800Hzand f2 = 2000Hz, the second (complex-β: 250/7,8)
accordingly f1 = 1750Hz and f2 = 2000Hz. Each signal was produced by two sine-wave
generators without mutual synchronization at a sensation level of 40dBS PL presented
binau-rally with headphones. Presentation times of each signal were 160ms, separated by a pause
of equal duration. The two signals were repeated 25 times per run in a random order. In
addition, a distinct noise band, masking simple tones of 200Hzand 250Hz, was used in
or-der to avoid noticeable difference tones (f2− f1) according to Plomp (1965). Smoorenburg also was aware of possible combination tones of the type f1 −k(f2 − f1), f1 < f2 according to Plomp and Goldstein (Plomp, 1965; Goldstein, 1967). After presenting the two signals
successively (e.g. complex-α→ complex−β), subjects had to decide in a forced-choice task if the perceived tonal interval was either ascending or descending. The former should
corre-spond to aMFtracking cue, the latter to a tracking cue following the harmonic components
itself:
“Taking into account the presence of combination tones, there is still the
follow-ing unequivocal relation: if the pitch of the signal f1, f2 = 1750Hz,2000Hz is
judged to be higher than the pitch of the signal 1800Hz, 2000Hz, then the
judg-ment must have been based upon the complex tone as a whole; if the pitch is
judged to be lower, then the judgment must have been based upon one or more
pitches of individual part-tones.” (Smoorenburg, 1970, p. 927)
Interestingly the subjects could be subdivided in two groups of equal size (bimodal
distribu-tion), pursuing one of the possible strategies consistently. Consequently, he concluded that
analyticandholisticcues contributed to explain these two possible modes:
“We may infer that the perception of a pitch jump corresponding to the
fun-damental frequencies was based upon pitches of the complex tones perceived
as a whole and that the judgments in opposite direction were based upon the
should demonstrate that there are important individual differences.”
(Smooren-burg, 1970, p. 928)
Thus, Smoorenburg’s experiments were the first systematic explorations of individual
dif-ferences based onambiguous pitch sensations in response to MF complexes, according to
the historic assumptions of von Helmholtz. That the perception of a residue differs between
subjects was later confirmed in important experiments by E. Terhardt (1974), as well as E.
De Boer (1976). This let De Boer to state:
“Now, when one listens to a tone, two attitudes are possible. One is listening to the sound as a whole, appreciating its pitch and perceiving the timbre as a
characteristic quality of the entire sound. The other attitude is one of subjective
analysis: one tries to break up the sound into constituent sounds (which happen
to correspond to sinusoidal components), and the qualities of the sound as whole
are lost.” (De Boer, 1976, p. 490)
However, due to the diverse conditions under which the experiments were performed (and,
to large extent, personal preference) pitch terminology was inconsistently used and varied broadly, for example: residue pitch (Schouten, 1940b), low pitch (Thurlow, 1958),
period-icity pitch (Licklider, 1951), time-separation pitch (Small, 1955), repetition pitch (Bilsen,
1966) and virtual pitch (Terhardt, 1974; Terhardt, 1979). Moreover, all these concepts could
neither explain the manifold ambiguities in pitch perception, nor explain sufficiently which
conditions decide whether analytic or holistic pitch cues were used. However, the
underly-ing concept of pitch perception might be of a more multi-dimensional nature as it appears.
Recent research in the field suggests the existence of different “axes” of sound perception.
Consequently, musical pitch might not exist independently from, but could instead be
un-derstood as a distinct dimension of timbre (Warren, 2003; Halpern, 2004; Marozeau, 2007; Bizley, 2009; Ladd, 2013; Vurma, 2014; Allen, 2014; Schellenberg, 2015). In this context
the Austrian composer A. Sch% "onberg (1911) argued:
“I cannot readily admit that there is such a difference, as is usually expressed,
between timbre and pitch. It is my opinion that the sound becomes noticeable
through its timbre and one of its dimensions is pitch. In other words: the larger
realm is the timbre, whereas the pitch is one of the smaller provinces. The pitch
is nothing but timbre measured in one direction.” (Schönberg, 1911; as cited in
Schneider 2009a, p. 319)
1.2
Individual Pitch Perception Mode
Today there is conjoint evidence for Smoorenburg’s basic conclusion of at least two different
modes of pitch perception, suggesting a robust underlying phenomenon, even when
exper-iments methodologically diverge substantially (Renken, 2004; Schneider, 2005a;
of soundscape research are apparent, as the basic observations from Smoorenburg and De
Boer are reminiscent of twomodes of listeningproposed by W. W. Gaver (1993), who noted different ways of experience natural or technical sounds:
“ [...] it is possible to hear any sound in terms of its source (everyday listen-ing) or in terms of its sensory qualities (musical listenlisten-ing). [...] both ways of
experiencing the sound are valid.” (Gaver, 1993, p. 286)
In this context, recently W. J. Davies (2015) remarked the similarities between the research fields of soundscapes, music cognition and audio quality, as they deal with the same
under-lying perceptual and cognitive phenomenons. He also concluded that there exist different
ways of perceiving a certain soundscape: either as a whole, or by “zooming” into a certain
sound within it, or even into a specific component or feature of that sound. Moreover, many
researchers frequently observed possible octave-shifts while listening to harmonic complex
tones, corresponding to frequencies up to more than an octave above the (missing)F0, as
reported by Ritsma and Engel (1964), Terhardt (1972), Moore (1977) and Patterson (1990).
Consistently, von Helmholtz (1863) had already noticed, that even professional musicians
and acousticians experience octave-ambiguities frequently, whereas later Davis (1951) re-ported, that octave-ambiguities are the most common “errors” of musicians. This is in
ac-cordance with Schönberg (1911) who also noted the similarity ofoctave-shiftedtones. In a
later key experiment, Schneider et al. (2005a) performed a psychometricPitch Perception
Preference Test consisting of 162 different pairs of harmonic complex tones based on the
concept of Smoorenburg’s experimental paradigm (1970) comparing the pitch sensation of
two successively played complex tones (see chapter 2.2.1 for details). The highest harmonic component was always maintained constant in-between a pair of tones, in order to avoid
changes in timbre. CombiningMFcomplexes with additional complete complexes
(includ-ing a physically present F0), allowed the detection of octave-shifted pitch perception, for example, one or two octaves aboveF0. This case mainly occurred for harmonic complexes
consisting of three components within a higher spectral range>1000Hzand was suggested to show an additional third perceptional mode that is not part of theF0tracking. In this study
Schneider et al. showed in particular that the perceived musical pitch of harmonic complex
tones varied largely by up to three or four octaves, when the same sound was presented to
dif-ferent individuals (N = 420), including 181 music students, 125 professional-, 66 amateur-,
and 48 nonmusicians. After correcting for octave-shifted percepts, the results showed that
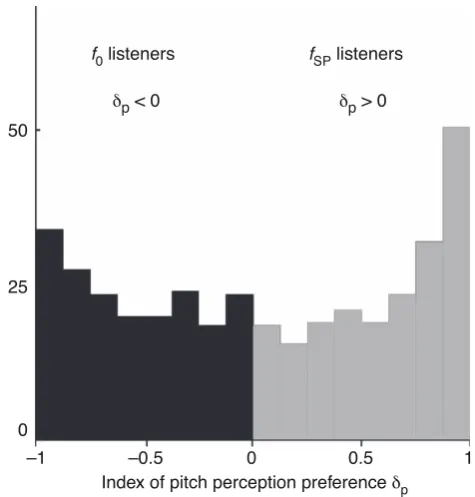
some subjects recognized dominantly the fundamental pitch (F0,holistic listeners), whereas
others perceived dominantly spectral aspects of the complex (SP, spectral listeners), irre-spective of the musical state. The resulting broad bimodal distribution of subjects following
eitherF0orSPpitch allowed for a classification of these two modes of pitch perception, in
accordance with Smoorenburg’s concept (Figure 1).
Thereby holistic listeners perceive pitch,chroma, and timbre as qualities of the entire sound,
whereas spectral listeners tend to decompose the sound into groups of harmonics or certain
prefer-f0 listeners fSP listeners
0
δp < 0 δp > 0
–1 –0.5 0 0.5 1
Index of pitch perception preference δp
[image:16.595.184.422.51.300.2]25 50
Figure 1. Index of pitch perception, after Scheider et al. (2005).
ence either towards extremeF0orSPperception. Using additional neuroimaging techniques,
in a subgroup of 87 subjects, they observed the preferred mode of pitch perception to be
re-flected by structural and functional asymmetries of lateral Heschl’s gyrus - a anatomical
structure known for containing areas of primary and secondary auditory cortex. Therefore,
they concluded the existence of two specialized pitch centers, whereby (missing)F0pitch is
extracted by the left- and spectral pitch by the right auditory cortex, which is in line with
evi-dence regarding hemisphere-specific neural processing of temporal and spectral auditory
in-formation (Zatorre, 2001; Schneider, 2009a). In a second evaluation based on the same study,
they further found evidence that individual preferences in pitch perception correspond to spe-cific preferences for music instruments and musical performance style (Schneider, 2005b).
In a basically similarMF-task experiment Seither-Preisler et al. (2007) found complex tones
with conflictingF0pitch, and parallel changes in timbre, to be heard differently by musicians
and nonmusicians. In accordance with Schneider et al. they also reported a dichotomic
distri-bution separatingF0pitch listeners fromSPpitch listeners. Furthermore, they also observed
many subjects with inconsistent and inhomogeneous pitch perception leading to the
assump-tion of “guessing” in such subjects, which might be also due to the conflicting interacassump-tion of
parallel pitch- and timbre changes (Figure 2). They also suggested the results of Schneider et
al. to be not bimodal, but with a bias towardsF0responses, if octave-shifted percepts would be counted asF0percepts. In contrast to Schneider et al. they reported an effect of musical
training leading to a moreF0 focused perception. They therefore concluded, that this
per-ceptual bias may be related to intensity and starting age of musical training (Seither-Preisler,
2009).
In a recent study Ladd et al. (2013) confirmed previous observed individual differences in
the perception duringMF-tasks by comparing the overlapping results from Schneider et al.
Figure 2. AAT-test design, after Seither-Preisler et al. (2007).
seven testings withN = 412 subjects, including 23 musicians, using an experimental MF
-task similar to the concept of Schneider et al. By using many repetitions per testing and
stimuli, they focused on re-test reliability, perceptual stability over time, and possible
incon-sistencies in the answering behavior. They found a distribution ofF0andSPpitch perception
with a bias towardsF0percepts, due to the fact that about a quarter of subjects showed no
consistent preference (Figure 3). This is in line with the observations of Seither-Preisler et al. Therefore, the results seem to diverge from the bimodal distribution of Schneider et
al., but on closer inspection are explainable with respect to the effect of octave-ambiguities.
However, Ladd et al. showed that despite divergent experimental details used in different
MF-task based studies, the test reliability is high and the perceptual responses of subjects
are remarkably consistent over time. Also, musicality and gender showed no influence,
con-sistent with Schneider et al., but age showed a slight effect with older subjects more likely
to give spectral responses. The latter effect might be rather caused by age related physical
changes in the inner ear or even cortical alterations. Furthermore, they recognized that
ob-served consistent intermediate responses (meaning neither extreme F0 nor SP perception) can not be explained simply by the existence of just two types of listening. Therefore, they
also suggested a possible additional mode of perception following the octave-ambiguity
phe-nomenon of Schneider et al. They concluded that more than just two generalmodes of sound
perceptionmust exist and therefore the assignment of just one of two basic types of pitch
perception to individuals would oversimplify the nature of underlying robust individual
dif-ferences. Thus, it could be more reasonable to speak of twomodesof pitch perception, that
might be available in different combinations to different listeners, instead of speaking oftwo
types of listenersthemselves.
As the early psychoacoustic experiments investigated the basic perception of sinusoidal and
complex tones - mostly based on self-sensation or including only few participants with un-known musical background - recent investigations focus on more realistic methodological
conditions representative also of the average population. Researchers started to develop
Figure 3. Distribution of pitch perception index, after Ladd et al. (2013).
specific psychoacoustic questions. Besides many studies mainly based on nonmusicians,
re-cently musicians have become more and more an ideal model for exploring different
dimen-sions of sound perception and auditory processing in detail, as musicians are known to reach
extreme auditory thresholds and show pronounced perceptual effects. Consequently, several
listening-tests were developed to focus on more specific musical skills, such as
absolute-or relative pitch perception, as well as cognitive higher-level competences, such as auditabsolute-ory
imagery (audiation) and musical aptitude.
1.3
Relative and Absolute Pitch Perception
Relative pitch (RP) perception is the ability to recognize more or less instantaneously the
relative distance between two given tones, independent of their absolute localization in the
tone space. While the concept of RP plays a crucial role in traditional professional music
education systems, such as solmization methods (Choksy, 1999), novel musical education
concepts based on evidence from neuroscience (Parncutt, 2002; Hodges, 2012) support the notion, that competences in RP perception are at the basis of professional musical
exper-tise. While musically experienced listeners perform often better in interval recognition tasks
compared to nonmusicians, musical education alone cannot explain excellent RP abilities
and high performance in interval recognition alone (Denham, 2016). In fact, Thompson et
al. (2012) revealed effects of intensity and non-spectral properties of sound on RP and
in-terval size judgement. Their findings extend previous evidence, showing the influence of
spectral attributes such as tonal context, timbre, and overall pitch height on RP (Krumhansl,
1979; Russo, 2005a; Russo, 2005b), as well as influences by acoustic attributes other thanF0
(Russo, 2005a; Russo, 2005b; Thompson, 2010). These findings are in line with a study by McDermott et al. (2010), which studied 122 musicians and 143 nonmusicians. They found
evidence for individual differences in preferences for specific properties of RP and specific
spec-tra. Further, based on correlations with musical training data, they concluded that exposure to
music intensifies preferences for harmonic frequencies because of their musical importance. They also noted the role of individual preferences for acoustical properties. Overall, these
unique findings on RP perception suggest, that identical intervals might be perceived
individ-ually different. However, both the perceptual and the neural basis of RP processing is largely
unexplored with respect to its multidimensional character, individual variability and the
in-fluence of musical training. In addition to RP perception, absolute pitch (AP) perception
is the rare ability to recognize or produce the pitch of any given tone spontaneously
with-out an external reference. The prevalence for AP abilities is estimated to be abwith-out 0,01% in the general population, but up to 7− 32% in professional musicians (Baharloo, 1998;
Gregersen, 1999). High AP performance also correlates with increased performance in mu-sical dictation (Dooley, 2010) and is associated with a large auditory digit span (Deutsch,
2013). However, individuals may possess AP abilities in varying degrees. These range from
absolute perception of specific notes, tonalities or instruments (partial AP) up to outstanding
abilities including perception and production of any tone irrespective of the kind of sound
(perfect AP). AP perception recently became a more popular research focus in relation to
brain functions and development (Zatorre, 2003; Ross, 2005), perceptual and cognitive
as-pects (Vanzella, 2010; Elmer, 2015), distinct genetical traits (Zatorre, 2003; Athos, 2007;
Theusch, 2009), as well as neuroanatomical correlates (Dohn, 2015). In particular, there is
recent evidence for a multisensorial AP network in the brain’s right hemisphere, which ap-pears to integrate primary auditory, sensory-motor and language related areas (Wengenroth,
2014). Further, there is evidence that AP performance is mostly independent of age, musical
training, gender, or familiarity with specific stimuli (Ross, 2003; Ross, 2009; Jakubowski,
2016), overall suggesting an innate and stable ability that persists into adulthood. However,
absolute pitch may not be as absolute as it seems with respect to quite plastic tone-labeling
mechanisms. These may not necessarily be based on early musical experience but rather on
the adopted cultural norms for different tunings in music (Hedger, 2013). However, across
the scientific community RP perception is often assumed to be the prevailing perceptual
“de-fault mode” of musicians in the absence of AP perception (Schlaug, 1995; Pantev, 1998) irrespective of the fact, that excellent RP abilities may be as well rare among musicians.
In fact, there is growing evidence for overlaps between AP and RP networks in regard to
brain function and anatomy (Zatorre, 1998), electrophysiological correlates (Itoh, 2005),
pitch memory (Schulze, 2009), music recognition (Creel, 2012), pitch matching of chords
(McLachlan, 2013), global vs. local processing (Ziv, 2014), and correlated enhanced
per-formance (Dooley, 2011). AP abilities also seem to accompany rare phenomenons such as
synesthesia (Gregersen, 2013) or specific pathologies such as autism (Heaton, 1998;
Mot-tron, 1999). There is further evidence for overlapping ethnicity effects: while AP abilities
occur at a higher rate among East Asian musicians, similar ethnicity effects were found for RP abilities amongst Chinese and Korean populations. Despite Asian populations
consis-tently outperform people from other origins in AP and RP tasks, this effect is not necessarily
neuronal mechanisms behind RP and AP perception are still not clarified, both abilities play
an important role for professional musicians and may have great influence to their individual auditory sensation, behavior, and performance.
So far no standardized listening test for the gradual assessment of RP ability exists. However,
a first version of a quantifiable computer-based “Interval Recognition Test” was recently
developed by E. Hofmann (Music-Academy Basel), providing different task difficulties by
considering the influences of interval size and interval direction (unpublished; see chapter
2.2.2 for details). A gradual AP perception test based on passive and active AP performance was developed by Wengenroth et al. (2014) (see chapter 2.2.3 for details).
1.4
Frequency Discrimination in Musicians
The ability to discriminate two nearby oscillating simple or complex tones is part of the
elementary auditory discrimination functions, and can be assessed by measuring thejust
no-ticeable difference (jnd) in audiometric experiments. An excellent detection of small pitch
differences up to < 2cent (1/50 semitone) might be essential for most professional musi-cians, as a key ability for tonal intonation. However, there is evidence for a high individual
variability in musicians and nonmusicians. In particular, differences in frequency
discrimi-nation (FD) thresholds can generally differ about more than a factor of 10, as observed by H. Fastl A. Hesse (1984), in a experiment using six different test frequencies (125−4000Hz)
and eight different tone durations (2−500ms). In a recent study, differences of FD values
by a factor of 100 to 1000 have been observed, ranging from 1cent in some professional
musicians up to 300cent(= 3 semitones) in some nonmusicians (Serrallach, 2016). Further,
the ability to discriminate frequencies, tone-durations and tone-ramps was found to differ
ac-cordingly to the presence of auditory related disabilities, e.g. ADHD or Dyslexia. However,
these differences might be partially based on changes over time, as a function of age,
(mu-sical) training and experience, or in response to environmental factors, as shown previously
by C. K. Madsen et al. (1969) and M. F. Spiegel C. S. Watson (1984). Thus, it might not be surprising that musicians show in general smaller differences in auditory discrimination than
nonmusicians (Fastl, 1984), whereas initial FD thresholds in musicians were observed to be
about one-third the size of those in nonmusicians (Spiegel, 1984). In a more recent combined
audiometric and electrophysiological study, Tervaniemi et al. (2005) used repeated complex
tone stimuli (528/1−4; frequency changes: 0.8%, 2%, or 4%) during auditory ERP (event-related potentials) recording with EEG (electroencephalography), to focus on attended versus
unattended pitch processing accuracy, in 13 musicians and 13 nonmusicians. They observed
that, in general, musicians detected pitch changes generally faster and more accurately than
nonmusicians. Further, musicians showed increased pitch discrimination accuracy not only
for 0.8%, but also of 2% changes, when compared to the nonmusicians. Additional results of the EEG analyses suggested, that musical expertise affects merely attentive levels of FD
processing but not necessarily pre-attentive levels. However, cognitive FD training can exert
(Demany, 1985; Irvine, 2000; Delhommeau, 2002), but also for the treatment of tinnitus e.g.
(Flor, 2004; Schneider, 2009b).
A reliable FD test was developed and provided by Stephan Ewert (University of Oldenburg)
within a customizable audiometric “Alternative Forced Choice” (AFC) test package (see
chapter 2.2.4 for details).
1.5
Auditory Imagery and Audiation
Auditory imagery is the ability to memorize sequences of sound while hearing them by the
“inner ear”, a process also known as musical imagery if specifying the memorization of
musical phrases. In one of the earliest experimental studies in this field, J.R. Bergan (1967)
found relationships between music imagery, memory and pitch identification:
“One may define an auditory image as an auditory experience of realistic
dimen-sions for which there is no apparent physical stimulus. By realistic dimendimen-sions is
meant that the auditory image tends to be a replication of an auditory experience
initiated in the environment. Thus, in its purest form there would be no
expe-riential difference between an auditory image and an actual sound.” (Bergan,
1967, p. 99)
Accordingly, based on comprehensive research related to musical education, E. Gordon
(1997) specifically described musical imagery as a process of “inner hearing” corresponding
with his definition ofaudiation, meaning:
“Audiaton is the ability to hear and comprehend music for which the sound is
not physically present.” (Gordon, 1997, p. 46)
However, empirical findings suggest that auditory imagery is related to basic and higher
au-ditory processing, by which the brain gives context to musical sounds in a mental scanning
process, which can be understood as the musical equivalent of thinking in language or
pic-tures (Halpern, 1988). Further, auditory imagery feapic-tures aspects of pitch, timbre, loudness,
as well as complex nonverbal auditory stimuli such as musical contour, melody, harmony,
tempo, notational audiation, and environmental sounds. Not surprisingly, individual diff er-ences were observed with respect to perception and memory (detection, encoding, recall,
mnemonic properties) considering relations with musical ability and experience (Hubbard,
2010). Concerning the relations between qualities in audiation and pitch perception, Bergan
(1967) noted:
“The significance of the relationship between accuracy in pitch identification
and musical imagery with respect to musicianship is that it suggests that the
critical function of being able to make judgments concerning the pitch of sounds
does depend on adequate internal representation of the sounds being judged.”
Recent neuroimaging studies in this field confirm, that mental auditory imagery for
famil-iar melodies significantly induces activation in the frequency-responsive areas of primary auditory cortex (Oh, 2013). These findings point towards top-down pitch processing
mecha-nisms in the auditory cortex similar to that used during the perception of external acoustical
stimuli, demonstrating that auditory imagery functions are comparable to auditory
percep-tion (Vuvan, 2011). Furthermore, music-pedagogical evaluapercep-tions confirm a strong relapercep-tion-
relation-ship between performance in audiation and musical aptitude (Gordon, 1988; Gordon, 1998),
while musical aptitude represents the potential to learn music, and is suggested to stabilize at
the age of about nine years, prior to intensive musical education (Schneider, 2005a). On the
other hand, there is also evidence for influence from musical training and musical experience
on musical imagery abilities (Aleman, 2000), though auditory vividness and mental control have been shown to be more influent on pitch imagery performance than musical
experi-ence (Gelding, 2015). However, recent studies indicate considerable benefits for musicians
compared to nonmusicians, with respect to increased musical notation performance
(Brod-sky, 2003), increased musical synchronization abilities (Pecenka, 2009), increased short term
memory- (Williamson, 2010) and enhanced encoding of musical sequences (Brown, 2013),
as well as increased musical skills linked to vividness of motoric imagery (Di Nuovo, 2016).
Consequently, there is broad evidence that distinct audiation abilities can be interpreted as a
core element ofmusicalityreflected by Gordon’s “music learning theory” (Gordon, 2012) as
a widely accepted model for music aptitude (Shuter-Dyson, 1999). Moreover, there is evi-dence for correlates with cortical structures in the brain, e.g. shown for (involuntary) musical
imagery (Farrugia, 2015). In particular, anatomical size and electrophysiological source
ac-tivity of distinct areas in auditory cortex show high correlations with thetonal raw score of
Gordon’s standardized “Advanced Measures of Music Audiation” (AMMA) test (Gordon,
1989; see chapter 2.2.5 for details), revealing also large differences between musicians and nonmusicians (Schneider, 2002; Schneider, 2005a).
1.6
Research Questions and Objectives
Taken together, the research findings outlined above suggest the existence of large
individ-ual differences in musical pitch- and general sound perception on different perceptual and
cognitive levels. The psychoacoustic assessment of basic and complex auditory parameters
might reveal individual different patterns of sound perception, reflecting characteristic “
audi-tory fingerprints” that may have suspected relevance for acoustical preferences and musical
performance style. However, with regard to the particular relevance for (professional)
mu-sicians, there is so far no specific knowledge about the importance of individual auditory
profiles in a musical context. Moreover, how distinct parameters of sound perception
inter-act and how the individual interplay on the perceptional level can be reflected by different auditory profiles is unclear. Consequently, the aim of this work is to access the basis of
audi-tory behavior on a perceptual level with a focus on music related pitch perception. Therefore
by distinct auditory measurements. Exploring the parameters from corresponding
psychoa-coustic listening tests can reflect individual differences on multiple levels of musical hearing with a specific focus on pitch perception. Moreover, exploring differences and similarities
between individual auditory fingerprints may help to classify characteristic patterns of sound
perception with potential implications for musicians.
Consequently, the research objectives of the present work are:
(i) Monitoring essential parameters of sound perception with a specific focus on the
indi-vidual sensation of pitch
(ii) Identification of characteristic patterns of pitch perception on the individual and group
level
(iii) Characterization of individual auditory profiles (“fingerprinting”) and identification of
common clusters of sound perception
(iv) Illustration of the inter-individual auditory variability and description of the character-istic sound perception modes with respect to musical abilities
Performing a selected composite of five psychoacoustic listening tests with 93 musicians (see
chapter 2 for details) should provide a sufficient data base in order to investigate individual
patterns of sound perception, with respect to:
(a) Pitch perception preference (holistic vs. spectral mode)
(b) Relative pitch perception (musical interval recognition)
(c) Absolute pitch perception (“perfect pitch”)
(d) Frequency discrimination threshold (just noticeable difference)
(e) Auditory imagery of tone sequences (audiation)
Furthermore, besides the individual perceptual pattern analyses, group specific differences and similarities should be explored based on clustering- and principal component analyses
Chapter 2
Methods
2.1
Study Setting and Subjects
All experimental measurements and analyses were performed within the scope of a com-bined cross-sectional and longitudinal imaging study titled “Auditory neuroplasticity in the
adult musical brain”, a SNF (Switzerland) and DFG (Germany) funded collaboration
con-ducted by Dr. Maria Blatow (Swiss part) and Dr. Peter Schneider (German part). The main
research aspects of this internationally funded research project included elementary auditory
perception, musical abilities and corresponding neural correlates of hearing in the brains of
musicians, with a focus on audio- and neuroplasticity. All subjects gave their informed
con-sent to participate in the experiments approved by the local Ethics committee (see Appendix
4,5). The present work represents a subset of this larger project. Specifically, it is limited
to the consideration of auditory perception and musical abilities, and does not utilize neu-roimaging. All subjects were recruited, screened and measured by the author of the present
work exclusively.
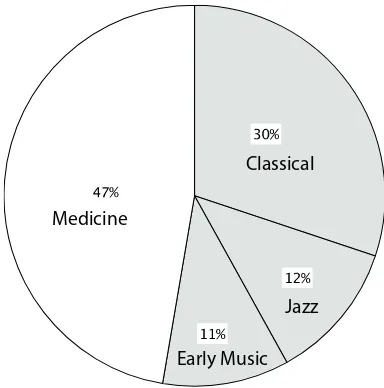
A population of 93 musicians (47 male / 46 female; mean age: 21.8± 2.6) including 49 musical students (28 Classical, 11 Jazz, 10 Early Music) was monitored at the beginning of
their three year intensive University Bachelor program at the Music-Academy Basel
(here-afterprofessionals). In addition, a control group of 44 hobby-musicians (medical students
from the Medical Universities Basel and Heidelberg) were measured in parallel at the
be-ginning of their respective University course (hereafteramateurs). For the present work, the
distinction between professionals and amateurs will be named “state” and the deeper distinc-tion between the specific University courses (professionals: Classical, Jazz, Early Music;
amateurs: Medicine) will be named “school” (Figure 4).
All subjects were asked to complete an accompanying questionnaire (Appendix 3) by
self-report, including the following queries:
• Name (anonymized by consecutive numbers), age, handedness.
• University program (Music, Medicine) and the respective major course for music
• Primary musical instrument played actively during life and to at least University start.
In addition, the corresponding musical practice times [averageh/week] were acquired for three periods across the whole lifespan (childhood, adolescence, study/University
start).
Classical
Jazz
Early Music Medicine
Figure 4. Distribution of subjects across University courses (school affinity).
Both groups were initially matched forraw tonal scoreofAMMA test (Figure 5) as a level
of elemental music aptitude, described in detail in chapter 2.2.5 (professionals: 32.8±3.6, amateurs: 30.6±3.4, inclusion border: 25). The AMMA score matching was suggested to guarantee a minimum requirement with respect to elemental musical abilities and aptitude
reflecting an equal intrinsic musical potential for both, professional- and amateur musicians.
subjects
AMMA
ra
w
t
o
n
a
l
sco
re
20 25 30 35 40
prof
ama prof mean
[image:25.595.200.392.135.329.2]ama mean
Figure 5. Study population of the joint project, initially matched for musical aptitude (AMMA).
Further, both groups exhibited a similar musical training intensity during childhood and early
youth, but significantly diverged in this respect during later adolescence and early
adult-hood (figure 6), when they started their respective professional education (mean intensity
0 10 20 30 40 50
In
te
n
si
ty
o
f
mu
si
ca
l
tra
in
in
g
(h
/w
e
e
k)
Childhood Adolescence Study start
prof
ama prof mean
[image:26.595.188.416.54.350.2]ama mean
Figure 6. Study population of the joint project, initially screened for training intensity.
The above described AMMA score matching as well as the data on training intensity is
based on a reduced subset of 30 professionals and 30 amateurs that were hand-picked from
the total population of 93 subjects. That subset of 60 subjects was specifically determined
and matched for the purpose of follow-up experiments within the scope of the longitudinal part of the comprehensive imaging study. Thus, data on training intensity and AMMA score
matching is just mentioned descriptively at this point in order to reflect the initial study
conditions. Consequently, the subset data was not used for further analyses in the present
work, as it is not representative for the total population of investigated subjects.
2.2
Psychoacoustic Tests
Five psychoacoustic tests were performed computer-based in order to gradually quantify
individual sound perception abilities based on: frequency discrimination thresholds, pitch perception preference, absolute- and relative pitch perception skills and audiation abilities.
All subjects were tested individually in a isolated and silent test room at the research
fa-cilities of University Hospital Basel. The separate test sounds were exclusively presented
through closed dynamicSennheiser HDA-200audiometric headphones (frequency response:
20−20000Hz; passive attenuation: 14dBat 125Hzto 44dBat 8kHz), connected to a mobile
RME Fireface-400(D/A conversion: 24bit, sampling rate: 48kHz) sound interface, in order
to guarantee a solid sound production with a high signal-to-noise ratio and a nearly linear
level was initially calibrated to 65dBS PL measured at the headphone inside using a
BrüelK-jaer 2203 Sound Level Meter. Based on recommendations by Schneider et al. (personal
communication) this presentation level is considered sufficient to avoid noticeable harmonic
distortions or interfering combination tones. The background level in the test room was not
specifically measured, as the used technical periphery provided appropriate test conditions
and no specific loudness-sensitive tests were applied. Two psychoacoustic test sessions with
equal total test times of approx. 45minrespectively, were synchronized with two separate
neuroimaging sessions on different days, in the course of the measurement schedule of the
comprehensive study. The following test-sequences were applied for every subject in a
con-sistent order:
Session 1 (approx. 45min):
(a) Pitch Perception Preference Test (Schneider, 2005a), approx. 20min
(b) Musical Interval Recognition Test (E. Hofmann, 2012, Music Academy Basel,
unpub-lished), approx. 15min
(c) Quantitative Absolute Pitch Test (adapted version) (Wengenroth, 2014), approx. 10min
Session 2 (approx. 45min):
(d) Frequency Discrimination Threshold Test (part of AFC-Test package, S. Ewert,
Univer-sity Oldenburg), approx. 30min
(e) Advanced Measures of Music Audiation Test (AMMA) (Gordon, 1989), approx. 15min
2.2.1
Pitch Perception Preference Test
The dominant mode of pitch perception was determined using the Pitch Perception
Prefer-ence Test, developed during 1995 to 1997 by P. Schneider and S. Bleeck (Schneider, 2005a) based on a ambiguous tone-interval paradigm with 162 tone pairs. Each tone-pair consists
of two consecutive harmonic complex tones (tone duration: 500ms, ramp on-/offset: 10ms,
inter-stimulus interval: 250ms). The test tones vary in number (n = 2 to 4), order (h = 2
to 16) and average spectral frequency (fS Pav(1−6) =0.25 to 5.0kHz) of the corresponding
harmonics. The sequence of the stimuli was determined randomly. Certain harmonics which
characterize timbre (e.g. upper partials) are deliberately kept constant within a tone-pair
in order to minimize noticeable timbre changes. In a two-way forced choice task subjects
were instructed to decide whether they perceive the second tone of a tone pair as higher or
lower compared to the first tone. The perceived direction of the tone shift is upward
(as-cending interval) or downward (des(as-cending interval), depending on the subject’s dominant sound perception mode (spectral or holistic). Subjects were instructed, that in some cases
could be heard, both ascending and descending. In those cases they were asked to judge the
direction of the pitch of the dominant percept. Accordingly pure “holistic listeners” (F0) ex-clusively perceive theMF, whereas extreme “spectral listeners” (SP) exclusively perceive the
physically present harmonics and are incapable hearing a dominantMF. Depending on the
frequency range “intermediate listeners” might perceive holistic as well as spectral aspects
in a clearly balanced distribution, but in some cases ambiguously resulting in aconflicting
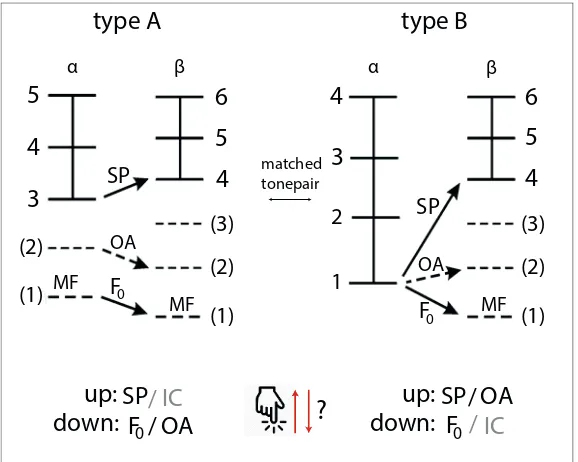
pitchsensation that may lead to inconsistencies. Two types of tone pairs were used (as shown
exemplarily in Figure 7): tone-pairs of type “A” consist of a physically presentF0, while in
tone-pairs of type “B” theF0is missing (= MF). Generally, in both types the 1stcomplex
tone (α) consists of different, but the 2nd(β) of equal harmonics. Further, in all tone-pairs of type “B” the octave-shifted residue of the second tone is higher then theF0of the first one. In Figure 7 harmonics that are physical present are shown as continuous lines whereas
har-monics that are not part of the stimulus are shown as dotted lines. Components of harmonic
orderh=1 correspond to the related f0orMF.
?
β
SP OA / F0 (2)
SP
SP
(1)
(2)
(1)
OA / SP
F0 (2)
(1) (3)
down: up: down:
up: /
/ IC
IC OA
F0
F0
OA (3)
3 4 5
4 5 6
4 5 6
2
1 3 4
type A type B
MF
α β α
matched tonepair
[image:28.595.161.450.311.542.2]MF MF
Figure 7. Examplary tone-pairs of Pitch Perception Preference Test, after Schneider et al. (2005a).
All 162 tone-pairs were generated based on generation rules shown in Figure 8. A subgroup
of 54 tone-pairs refers to each condition of 2, 3 or 4 harmonic components (n) respectively.
All components of each of the 54 tone-pairs were defined by 9 different conditions,
repre-senting harmonic ranks between 2 and 16 with 6 different highest component frequencies
(fS Pmax(1−6) : 294, 523, 932, 1661, 2960, 5274Hz). Please see Appendix 2 for a complete
overview of all test components and their corresponding frequencies.
By logically matching tone-pairs of type A and B it is possible to analyze the proportion
of partially perceived octave-ambiguity (OA) and/or inconsistency (IC). The degree of OA
reflects the amount of perceiving a missing octave-shifted 1stor 2ndharmonic instead of the
relatedMF, whereas the degree of IC is considered to reflect the amount of inconsistent- or
random choices. Figure 7 shows the principle of this distinction: In both cases the answer
type rule tone harmonics in tone harmonics in
“A” 2 2 n+1 n 3 n+2 n
4 3 n+2 n 4 n+3 n
6 4 n+3 n 6 n+5 n
8 7 n+6 n 9 n+8 n
“B” 1 1 n n 2 n+1 n
3 1 n n 3 n+2 n
5 1 n+1 n+1 4 n+3 n
[image:29.595.112.518.63.200.2]7 1 n+2 n+2 5 n+4 n
Figure 8. Tone-pair generation rules for Pitch Perception Preference Test, after Schneider et al. (2005a).
the answer “down” can be interpreted as a dominant MFtracking. However, tracking the
octave-shiftedMF however leads to the answers “down” for the type “A” and “up” for the
type “B” complex. Whereas an opposite behavior would lead to an interpretation of IC. In
order to quantify the resulting perceptual behavior, an index of sound perception preference
(δP) was computed individually according to the number of given spectral (SP) and holistic
(F0) answers, using the formula:
δP =(SP−F0)/(SP+F0)
Based on these classifications separate sub-analyses forδP, OA [%] and IC [%] were
gener-ated separately as a function of the six average spectral frequencies (fS Pav(1−6) : 0.25, 0.45,
0.80, 1.5, 2.6, 5.0kHz). Thereby the distance between two average frequencies corresponds to a musical interval of a major seventh (7+). In addition, the three parameters were averaged
across fS Pav(1−6) reflecting a representative cross-section of each parameter (δPav, OAav)
for reasons of data simplification during most statistical analyses (see chapter 2.3). Detailed values of fS Pav(1−6) and also IC values were only shown in chapter 3.2 in addition to δP
and OA results, but were not used as raw input parameters for further statistical methods.
For the present work, on theδP scale holistic listeners range between−1 to−0.34, spectral
listeners between+0.34 to+1, and intermediate listeners between−0.33 to+0.33, following previous definitions by Schneider et al. (2005a). Proportionate amounts of OA perception
as well as of potential IC were alike divided into “low” (0 to 25%), “medium” (26 to 50%),
“high” (51 to 75%) and “extreme” (75 to 100%).
2.2.2
Musical Interval Recognition Test
Relative pitch (RP) perception abilities were determined and quantified using the “Musical
Interval Recognition Test” (E. Hofmann, 2012, Music Academy Basel, unpublished). 72
tone-pairs were presented binaurally in a forced-choice task, based on the musically
stan-dard scale of chromatic halftone steps (tone duration: 500ms, ramp on-/offset: 20ms,
on a chromatic octave scale (Figure 9), while intervals greater than the octave “8” should be
projected back by starting from “1” (min. interval: prime “1”=0 semitones; max. interval: duo-decime “12”=19 semi-tones). The pause time between the tone-pairs is kept constant
and short in order to force the subjects to decide spontaneously. For correct detected tones 1
point was accredited. The random choice score is 12 and the highest achievable score is 72
points. For the present work the scoring was divided into “poor” (0 to 24), “partial” (25 to
48) and “excellent” (49 to 72) RP perception abilities.
tone 1 1 2- 2+ 3- 3+ 4 T 5 6 - 6+ 7- 7+
440 Hz
622.25 Hz
tone 2
[image:30.595.157.457.190.272.2]?
Figure 9. Musical Interval Recognition Test, after E. Hofmann (2012, unpublished).
2.2.3
Quantitative Absolute Pitch Test
Absolute pitch (AP) perception abilities were determined and quantified using “Quantitative
Absolute Pitch Test” (Wengenroth, 2014) allowing the quantification of partial- and perfect
AP perception. The test consists of 34 items with intermittent interference stimuli in a passive tone recognition task (adapted version of the original test, including also 7 active-singing
items). The equally tempered test tones comprise 22 instrumental tones in high (N = 6),
middle (N = 9) and low (N = 8) frequency range, as well as 5 vocal and 7 sine tones. In
order to rule out any memory based interval recognition (related to RP) interference stimuli
were inserted, consisting of 5 non-equal tempered sequential instrumental tones followed by
20sof glissando-like continuously distorted music pieces (Figure 10). Only the detection of
the respectivechromawas tested, independently of the musical octave-position. For correct
determined tones 1 point, and for semi-tone errors 0.5 points were accredited. The random choice score is 7 and the highest achievable score is 34 points. For the present work the scoring was divided into “poor” (0 to 12), “partial” (12.5 to 23) and “excellent” (23.5 to 34) AP perception abilities.
Interference tones
Glissando-like
distorted music Test tone
?
[image:30.595.159.455.623.703.2]2.2.4
Frequency Discrimination Threshold Test
Elementary frequency discrimination (FD) was quantified using a customizable audiometric
“Alternative Forced Choice” (AFC) test, which is part of the psychophysical-measurement software package for MATLAB provided by Stephan Ewert, University of Oldenburg (Ewert,
2012). During the adaptive, three-interval, 3AFC task subjects were instructed to determine
the higher pitch in relation to the baseline-tones (Figure 11). In each phase of the
experi-ment, individual FD thresholds (just noticeable difference) were estimated, while each trial
consisted of three intervals indicated by lights. In two of the intervals the frequency of the
stimulus was the same. In the third, selected at random, the aim frequency was higher. The
subject’s task was to detect the interval containing the higher aim frequency. The baseline
frequencies varied in three consecutive steps across the test (f = 100, 500, 2500Hz; tone
duration: 500ms; tone on-/offset: 20ms, inter-stimulus interval: 500ms). For each run the higher tone always started with a tone difference of 80cent above the baseline-tones. With
every right answer the higher tone stepwise moved lower in frequency (steps: 6, 3 and 2cent
progressively) until the individual FD threshold was reached (minimum measurable diff
er-ence: 1.17cent). Test tones were presented monaurally for both ears separately. In addition, resulting monaural recorded data were post-hoc averaged between ears (FDav) for reasons of
data simplification during most statistical analyses. Due to occasional technical issues with
the test computer, FD results could not be recorded for two subjects with the numbers 36 and
52 (amateurs) because of data loss after the test performance. Consequently, these subjects
were excluded from all data analyses requiring full datasets including FD threshold results, which affects also PCA and cluster analyses (see chapter 2.3).
tone 1 tone 2 tone 3
2500 Hz 2514 Hz 2500 Hz
[image:31.595.157.456.464.548.2]highest tone?
Figure 11. Frequency Discrimination Threshold Test, after S. Ewert (AFC; Ewert, 2012).
2.2.5
Advanced Measure of Music Audiation
The “Advanced Measure of Music Audiation” (AMMA) test developed by E. Gordon (1989)
consists of 30 pairs of fictitious short melodies played by piano. Every presented melody is
repeated immediately, while the first melody is the reference but the second melody may have one of the following features: tonal change (10/30), rhythm change (10/30) or no change
= identical melody (10/30). Subjects were instructed to compare every melody-pair and detect the respective feature in a three-way forced choice task (Figure 12). The “raw tonal
test score” was calculated separately by evaluating the number of correct answers minus the
number of false answers, plus a standardized baseline value of 20. The random choice score
performed, non-musicians scored between 15 and 27, professional musicians between 25
and 40, and amateur musicians in an intermediate range between 17 and 35 (Schneider, 2002; Schneider, 2005a). As no non-musicians were included for the present work, the scoring was
slightly adapted based on the inclusion border of 25, according to: “basic” (25 to 30), “high”
(31 to 35) and “excellent” (36 to 40) audiation abilities. The additionally assessable “raw
rhythm test score” was not evaluated for the present work, as it is not relevant in the context
of pitch perception.
first
second
A Same
B Melody changed
C Rhythm changed
h h
Figure 12. Advanced Measure of Music Audiation, after E.E. Gordon (1989).
2.3
Statistics and Data Analyses
All statistical analyses were calculated using SPSS Statistics software (IBM, 2017),
perform-ing the followperform-ing methodical steps for data processperform-ing: Descriptive and explorative statistics, including frequency distributions, with classifications, tests for checking normal-distribution
of data (Saphiro-Wilk test) and homogeneity of variances (Levene test) were used in order
to initially mirror the data. In parallel, all psychoacoustic parameters were normalized using
z-transformation for better comparison of the respective values that originate from different
test scales and as a required input condition for following factor analyses. The
standard-ized psychoacoustic parameters were then assessed individually as well as group-wise, in
order to reflect individual auditory patterns. Due to significant deviation of the
parame-ters from normal distribution, non-parametric tests were used for all further statistical
anal-yses. Non-parametric correlations between parameters were calculated using Spearman’s Rho. Correlations for nominal categorial data (state, school, gender, musical instruments)
were not available, as they were not providing ordinal ranks. Non-parametric comparisons
between groups (e.g. between subject clusters) were performed using Kruskal-Wallis test
and chi-square test. Pairwise comparisons were performed post-hoc using Mann-Whitney
test, and corrected for multiple comparison using Bonferroni correction. Principal
compo-nent analysis (PCA) was calculated based on an integrated correlation matrix in parameter
space for data reduction, but most importantly in order to detect potential main components
explaining the variance in the data. A rotated variable solution was applied using