Genetic variants of miRNA sequences and non–
small cell lung cancer survival
Zhibin Hu, … , Yijiang Chen, Hongbing Shen
J Clin Invest.
2008;
118(7)
:2600-2608.
https://doi.org/10.1172/JCI34934
.
Recent evidence indicates that small noncoding RNA molecules known as microRNAs
(miRNAs) can function as tumor suppressors and oncogenes. Mutation, misexpression, and
altered mature miRNA processing are implicated in carcinogenesis and tumor progression.
Because SNPs in pre-miRNAs could alter miRNA processing, expression, and/or binding to
target mRNA, we conducted a systematic survey of common pre-miRNA SNPs and their
surrounding regions and evaluated in detail the association of 4 of these SNPs with the
survival of individuals with non–small cell lung cancer (NSCLC). When we assumed that
disease susceptibility was inherited as a recessive phenotype, we found that the
rs11614913 SNP in
hsa-mir-196a2
was associated with survival in individuals with NSCLC.
Specifically, survival was significantly decreased in individuals who were homozygous
CC
at SNP rs11614913. In the genotype-phenotype correlation analysis of 23 human lung
cancer tissue samples, rs11614913
CC
was associated with a statistically significant
increase in mature
hsa-mir-196a
expression but not with changes in levels of the precursor,
suggesting enhanced processing of the pre-miRNA to its mature form. Furthermore, binding
assays revealed that the rs11614913 SNP can affect binding of mature
hsa-mir-196a2-3p
to
its target mRNA. Therefore, the rs11614913 SNP in
hsa-mir-196a2
may be a prognostic
biomarker for NSCLC. Further characterization of miRNA SNPs may open new avenues for
the study of cancer and therapeutic interventions.
Research Article
Oncology
Find the latest version:
http://jci.me/34934/pdf
Genetic variants of miRNA sequences and
non–small cell lung cancer survival
Zhibin Hu,1 Jiaping Chen,1 Tian Tian,1 Xiaoyi Zhou,1 Haiyong Gu,2 Lin Xu,3 Yi Zeng,4 Ruifen Miao,1
Guangfu Jin,1 Hongxia Ma,1 Yijiang Chen,2 and Hongbing Shen1
1Department of Epidemiology and Biostatistics, Cancer Center of Nanjing Medical University, Nanjing, People’s Republic of China. 2Department of Thoracic and Cardiac Surgery, The First Affiliated Hospital of Nanjing Medical University, Nanjing, People’s Republic of China.
3Department of Thoracic Surgery, Jiangsu Cancer Hospital, Nanjing, People’s Republic of China. 4Department of Respiratory Diseases, Nanjing Thoracic Hospital, Nanjing, People’s Republic of China.
Recent evidence indicates that small noncoding RNA molecules known as microRNAs (miRNAs) can
func-tion as tumor suppressors and oncogenes. Mutafunc-tion, misexpression, and altered mature miRNA processing
are implicated in carcinogenesis and tumor progression. Because SNPs in pre-miRNAs could alter miRNA
processing, expression, and/or binding to target mRNA, we conducted a systematic survey of common
pre-miRNA SNPs and their surrounding regions and evaluated in detail the association of 4 of these SNPs with
the survival of individuals with non–small cell lung cancer (NSCLC). When we assumed that disease
suscep-tibility was inherited as a recessive phenotype, we found that the rs11614913 SNP in
hsa-mir-196a2
was
associ-ated with survival in individuals with NSCLC. Specifically, survival was significantly decreased in individuals
who were homozygous
CC
at SNP rs11614913. In the genotype-phenotype correlation analysis of 23 human
lung cancer tissue samples, rs11614913
CC
was associated with a statistically significant increase in mature
hsa-mir-196a
expression but not with changes in levels of the precursor, suggesting enhanced processing of
the pre-miRNA to its mature form. Furthermore, binding assays revealed that the rs11614913 SNP can affect
binding of mature
hsa-mir-196a2-3p
to its target mRNA. Therefore, the rs11614913 SNP in
hsa-mir-196a2
may
be a prognostic biomarker for NSCLC. Further characterization of miRNA SNPs may open new avenues for
the study of cancer and therapeutic interventions.
Introduction
Lung cancer is the leading cause of cancer-related deaths world-wide, and about 80% of patients have non–small cell lung cancer (NSCLC). If the cancer is diagnosed at the localized stage, the 5-year survival rate is about 50%, whereas it decreases precipitously in cases with lymph node involvement or metastasis. Discovery of biomarkers and their application in conjunction with traditional cancer diagnosis, staging, and prognosis could to a large extent help improve early diagnosis and patient care (1). However, despite the efforts that have been made, reliable markers are still lacking, and the prognosis remains poor.
MicroRNAs (miRNAs) are an abundant class of small non-protein-coding RNAs that function as negative gene regulators (2, 3). Bioinformatic data indicated that a single miRNA could bind to hundreds of mRNA targets, and these targets could be implicated in the regulation of almost every biological processes (4, 5). Although we are just beginning to understand how this novel class of gene regulators is involved in cancer-related pro-cesses, it was shown that miRNA expression profiles could be used to classify human cancers (6), and a global repression of miRNA maturation promoted cellular transformation and tumorigenesis (7). The loss and gain of function of specific miRNAs were also thought to be key events in the genesis of diverse cancers (8, 9). In lung cancer, miRNA expression profiles
and specific miRNAs have been shown to be correlated with survival of lung adenocarcinomas (10).
The precise mechanisms regulating miRNA expression and mat-uration are largely unknown, but studies have suggested several mechanisms, including genetic and epigenetic alterations (11, 12). Because small variation in the quantity of miRNAs may have an effect on thousands of target mRNAs and result in diverse func-tional consequences, the most common genetic variation, SNPs, in miRNA sequences may also be functional and therefore may represent ideal candidate biomarkers for cancer prognosis. In the present study, we hypothesized that SNPs in pre-miRNAs could alter miRNA processing and expression and therefore contribute to cancer prognosis and survival. Because rare SNPs in the SNP databases (the NCBI dbSNP database, build 127; http://www.ncbi. nlm.nih.gov/projects/SNP/) may be incorrect and not applicable for the population-based studies in Chinese populations, we sur-veyed common (i.e., minor allele frequency >0.05) SNPs located in pre-miRNAs and their surrounding regions using in silico approaches with 400 known human miRNA sequences listed in the public database miRBase (13). We then selected 4 pre-miRNA SNPs (hsa-mir-146a rs2910164 C→G, hsa-mir-196a2 rs11614913 C→T, hsa-mir-499 rs3746444 G→A, and hsa-mir-149 rs2292832 G→T) and evaluated their associations with the overall survival of NSCLC and functional relevance.
Results
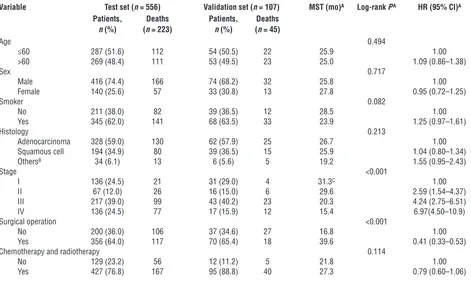
The distribution of demographic characteristics and clinical fac-tors of the 663 NSCLC cases (556 cases in the original test set and 107 cases in the independent validation set recruited from dif-ferent hospitals) are shown in Table 1. There were no significant
Nonstandard abbreviations used: HR, hazard ratio; MAF, minor allele frequency; miRNA, microRNA; MST, median survival time; NSCLC, non–small cell lung cancer; pri-mRNA, primary miRNA.
research article
The Journal of Clinical Investigation http://www.jci.org Volume 118 Number 7 July 2008 2601
differences in the distribution of the age, sex, smoking status, histology types, stage, and surgical operation status between the patients in the test set and those in the validation set. Therefore, we combined the 2 sets for the following analyses to increase the study power. Of the 663 NSCLC cases with complete clinical/fol-low-up information and successful genotyping for all the 4 loci, the mean age was 60.17 ± 9.65 years (range, 23–83 years), and 73.9% were male. Three hundred and ninety (58.8%) had adeno-carcinoma, 233 (35.2%) squamous cell adeno-carcinoma, and 40 (6.0%) large-cell, mixed-cell, or undifferentiated carcinomas; 167 (25.2%) had stage I carcinoma, 83 (12.5%) stage II, 260 (39.2%) stage III, and 153 (23.1%) stage IV. Four hundred twenty-six (64.2%) patients had undergone surgical operations, and 522 (78.7%) had under-gone chemotherapy or radiotherapy. As expected, patients with-out surgical operation and with advanced-stage lung carcinoma had a significantly shorter median survival time (MST) (Table 1). Univariate Cox regression analysis revealed that the risk of death for NSCLC was significantly increased as the stage increased, and patients with surgical operation had a significant, 59% decreased death risk and a longer survival time (MST, 39.6 versus16.8 for patients without surgical operation).
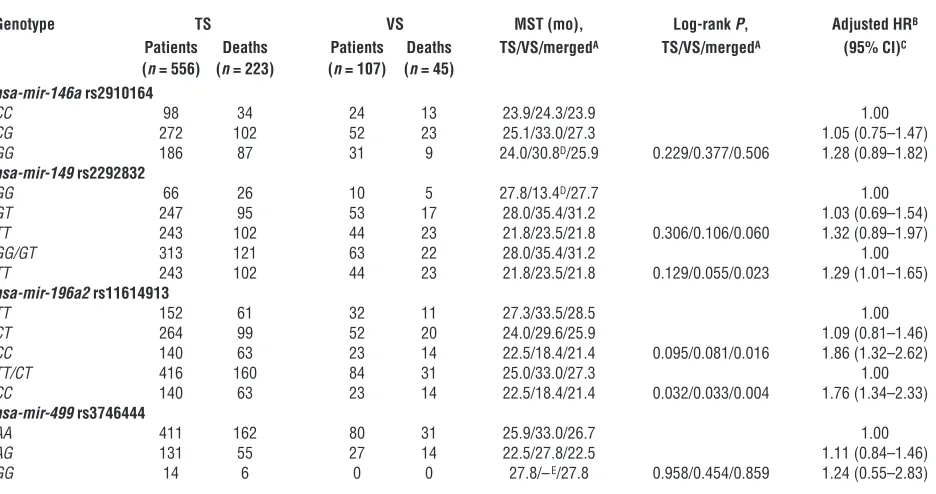
The associations between genotypes of 4 SNPs in pre-miRNAs and survival of patients with NSCLC in both the test set and the validation set are presented in Table 2. Survival analyses for all patients from the 2 patient sets showed that the differences in the MST of lung cancer between carriers of hsa-mir-196a2 rs11614913
CC (21.4 months) and TT/CT (27.3 months), and between
hsa-mir-149 rs2292832 TT (21.8 months) and GG/GT (31.2 months) were statistically significant (log-rank test, P = 0.004 and P = 0.023, respectively) but were not for the other SNPs. However, only hsa-mir-196a2 rs11614913 achieved the significance both in the test set (P = 0.032) and the validation set (P = 0.033) in a recessive genetic model (Table 2). As shown in Figure 1, Kaplan-Meier survival esti-mates showed that lung cancer patients carrying the hsa-mir-196a2
rs11614913 CC genotype had a lower survival than the patients carrying TT/CT genotypes, especially among stage I/II patients. Multivariate Cox proportional hazard regression analysis also showed that rs11614913 CC and rs2292832 TT were significantly unfavorable prognostic factors (hazard ratio [HR], 1.76 [95% CI, 1.34–2.33] for rs11614913 CC and HR, 1.29 [95% CI, 1.01–1.65] for rs2292832 TT). When we took the 2 loci into consideration together, we found that patients carrying 1–2 unfavorable loci had a significantly higher risk of death than those without unfavorable loci (adjusted HR, 1.62 [95% CI, 1.26–2.09]; P = 0.0006) (Table 3).
[image:3.585.55.526.115.396.2]To control potential confounders and analyze phenotype-specific survival, the patients were stratified by stage (early stage, I–II; late stage, III–IV), smoking status, histology, and surgical operation and chemotherapy or radiotherapy status (Table 3). We found that increased risk of lung cancer death associated with the 1–2 unfavor-able loci was greater among patients with early-stage carcinoma (HR, 2.58 [95% CI, 1.43–4.67]), having smoking history (HR, 1.73 [95% CI, 1.25–2.37), and without chemotherapy or radiotherapy (HR, 2.27 [95% CI, 1.25–4.12]). Stepwise Cox proportional hazard analysis was used to evaluate the correlation between variables including selected Table 1
Patient characteristics and clinical features
Variable Test set (n = 556) Validation set (n = 107) MST (mo)A Log-rank PA HR (95% CI)A
Patients, Deaths Patients, Deaths
n (%) (n = 223) n (%) (n = 45)
Age 0.494
≤60 287 (51.6) 112 54 (50.5) 22 25.9 1.00
>60 269 (48.4) 111 53 (49.5) 23 25.0 1.09 (0.86–1.38)
Sex 0.717
Male 416 (74.4) 166 74 (68.2) 32 25.8 1.00
Female 140 (25.6) 57 33 (30.8) 13 27.8 0.95 (0.72–1.25)
Smoker 0.082
No 211 (38.0) 82 39 (36.5) 12 28.5 1.00
Yes 345 (62.0) 141 68 (63.5) 33 23.9 1.25 (0.97–1.61)
Histology 0.213
Adenocarcinoma 328 (59.0) 130 62 (57.9) 25 26.7 1.00
Squamous cell 194 (34.9) 80 39 (36.5) 15 25.9 1.04 (0.80–1.34)
OthersB 34 (6.1) 13 6 (5.6) 5 19.2 1.55 (0.95–2.43)
Stage <0.001
I 136 (24.5) 21 31 (29.0) 4 31.3C 1.00
II 67 (12.0) 26 16 (15.0) 6 29.6 2.59 (1.54–4.37)
III 217 (39.0) 99 43 (40.2) 23 20.3 4.24 (2.75–6.51)
IV 136 (24.5) 77 17 (15.9) 12 15.4 6.97(4.50–10.9)
Surgical operation <0.001
No 200 (36.0) 106 37 (34.6) 27 16.8 1.00
Yes 356 (64.0) 117 70 (65.4) 18 39.6 0.41 (0.33–0.53)
Chemotherapy and radiotherapy 0.114
No 129 (23.2) 56 12 (11.2) 5 21.8 1.00
Yes 427 (76.8) 167 95 (88.8) 40 27.3 0.79 (0.60–1.06)
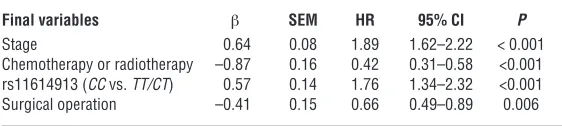
demographic characteristics, clinical features, and the 4 miRNA SNPs and NSCLC survival. Four variables (stage, chemotherapy or radiotherapy, rs11614913, and surgical operation) were included in the regression model, with a significance level of P < 0.05 for enter-ing and P = 0.10 for removal from the model (Table 4).
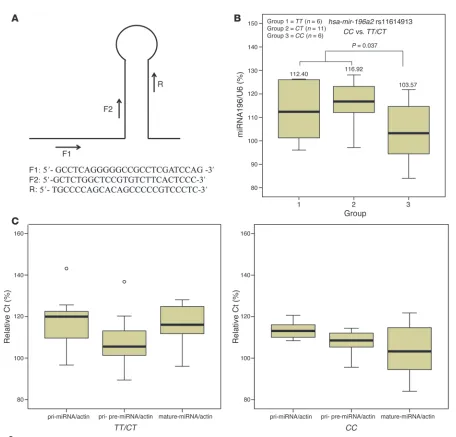
To further characterize the functional relevance of the hsa-mir-196a2 rs11614913 SNP, we conducted correlation analysis between rs11614913 genotypes and the expression of hsa-mir-196a. We found that, in the 23 NSCLC tissue specimens, 6 were of the rs11614913 TT genotype, 11 of the CT genotype, and 6 of
the CC genotype. The Ct value for U6 of the rs11614913 TT geno-type was 26.48 ± 0.18; CT genotype, 26.20 ± 0.16; and CC geno-type, 26.85 ± 0.56, whereas the Ct values for mature hsa-mir-196a
according to different genotypes of rs11614913 were 29.76 ± 1.35, 30.62 ± 0.69, and 27.83 ± 1.66, respectively. As shown in Figure 2B, the relative expression of hsa-mir-196a to U6 was significantly different when we compared the CC genotype with the TT/CT
genotypes (103.57% ± 13.60% versus 115.32% ± 10.20%; P = 0.037). However, relative Ct ratios of primary miRNA (pri-miRNA) to
[image:4.585.57.525.110.357.2]β-actin were 116.12% ± 11.23% for rs11614913 TT/CT genotypes Table 2
Genotypes of miRNA polymorphisms and NSCLC patients’ survival
Genotype TS VS MST (mo), Log-rank P, Adjusted HRB
Patients Deaths Patients Deaths TS/VS/mergedA TS/VS/mergedA (95% CI)C
(n = 556) (n = 223) (n = 107) (n = 45)
hsa-mir-146a rs2910164
CC 98 34 24 13 23.9/24.3/23.9 1.00
CG 272 102 52 23 25.1/33.0/27.3 1.05 (0.75–1.47)
GG 186 87 31 9 24.0/30.8D/25.9 0.229/0.377/0.506 1.28 (0.89–1.82)
hsa-mir-149 rs2292832
GG 66 26 10 5 27.8/13.4D/27.7 1.00
GT 247 95 53 17 28.0/35.4/31.2 1.03 (0.69–1.54)
TT 243 102 44 23 21.8/23.5/21.8 0.306/0.106/0.060 1.32 (0.89–1.97)
GG/GT 313 121 63 22 28.0/35.4/31.2 1.00
TT 243 102 44 23 21.8/23.5/21.8 0.129/0.055/0.023 1.29 (1.01–1.65)
hsa-mir-196a2 rs11614913
TT 152 61 32 11 27.3/33.5/28.5 1.00
CT 264 99 52 20 24.0/29.6/25.9 1.09 (0.81–1.46)
CC 140 63 23 14 22.5/18.4/21.4 0.095/0.081/0.016 1.86 (1.32–2.62)
TT/CT 416 160 84 31 25.0/33.0/27.3 1.00
CC 140 63 23 14 22.5/18.4/21.4 0.032/0.033/0.004 1.76 (1.34–2.33)
hsa-mir-499 rs3746444
AA 411 162 80 31 25.9/33.0/26.7 1.00
AG 131 55 27 14 22.5/27.8/22.5 1.11 (0.84–1.46)
GG 14 6 0 0 27.8/–E/27.8 0.958/0.454/0.859 1.24 (0.55–2.83)
ATS, test set; VS, validation set; merged, 2 sets combined. BData are for the combined test and validation sets. CAdjusted for age, sex, smoking status, histology, stage, surgical operation, and chemotherapy or radiotherapy status. DMean survival time was provided when MST could not be calculated. EMST (VS) for this GG genotype could not be calculated.
Figure 1
[image:4.585.47.540.545.717.2]research article
The Journal of Clinical Investigation http://www.jci.org Volume 118 Number 7 July 2008 2603
and 113.54% ± 4.39% for the rs11614913 CC genotype (P = 0.437). Similarly, relative Ct ratios of pri- and pre-miRNAs to β-actin were 107.76% ± 11.45% for rs11614913 TT/CT genotypes and 107.40% ± 6.65% for rs11614913 CC genotype (P = 0.944). There-fore, the increased relative expression of mature hsa-mir-196a
(lower Ct ratio corresponds to a higher expression) in rs11614913
CC carriers was associated with potentially enhanced processing from pre-hsa-mir-196a2 to its mature form (Figure 2C).
To evaluate the influence of the rs11614913 variant on the binding of hsa-mir-196a2-3p to LSP1 mRNA, we generated LSP1 3′UTR lucif-erase reporter plasmids that were cotransfected with hsa-mir-196a2
expression plasmids (rs11614913 C or T allele) or chemically synthe-sized mature hsa-mir-196a2-3p miRNAs (C or U allele) in CHO, 293T, and A549 cell lines. pRL-SV40 plasmids were used to normalize the transfections. As shown in Figure 3, significantly lower levels of lucif-erase expression were observed when we cotransfected LSP1 3′UTR luciferase reporter plasmids with hsa-mir-196a2 expression plasmids or chemically synthesized mature hsa-mir-196a2-3p miRNA carrying the rs11614913 C allele (Figure 3A, CHO cells: 0.685 ± 0.067 for C allele versus 0.917 ± 0.043 for the T allele, P = 0.027;
293T cells: 0.613 ± 0.033 for C versus 0.769 ± 0.032 for T, P = 0.028; A549 cells: 0.684 ± 0.045 for C ver-sus 0.86 1 ± 0.027 for T, P = 0.028; Figure 3B, CHO cells: 0.672 ± 0.049 for C versus 0.917 ± 0.075 for U,
P = 0.035; 293T cells: 0.745 ± 0.057 for C versus 0.976 ± 0.044 for U, P = 0.033; A549 cells: 0.483 ± 0.036 for C versus 0.699 ± 0.055 for U, P = 0.005). Discussion
To our knowledge, this is the first study to provide evidence that common SNPs in miRNAs might
play an important role in prediction of NSCLC survival. The hsa-mir-196a2 rs11614913 variant homozygote was associated with a 1.76-fold-elevated HR for unfavorable overall survival of NSCLC and significantly increased mature hsa-mir-196a expression and can directly influ-ence the target binding of hsa-mir-196a2-3p.
Recently, a strong link between mirRNAs that are altered, either structurally or in the number of mature miRNAs, and cancer biology has been demonstrated (14). Mutations/polymorphisms, misexpression, or altered mature miRNA processing are likely to be pleiotropic and may contribute to cancer susceptibility and progression. Inherited mutations or rare SNPs in the primary transcripts of has-mir-15a and has-mir-16-1
have been linked to familial chronic lymphocytic leuke-mia and familial breast cancer (15), which was further supported in a spontaneous mouse model of chronic lymphocytic leukemia (16). It has also been shown that miRNA expression patterns have relevance to the bio-logical and clinical behavior of human solid tumors (10, 17, 18). For example, hsa-mir-196a was highly expressed in pancreatic (17) and breast cancers (18) compared with normal tissues, and the elevated expression was associated with significantly reduced survival for pancreatic cancer (17). In the present study, we found that patients with NSCLC carrying a variant homozy-gote of rs11614913 located in the 3p mature miRNA region of hsa-mir-196a2 had poor survival, possibly through a mechanism of elevated expression of mature
hsa-mir-196a and weakened target binding of hsa-mir-196a2-3p. These results were consistent with the findings in a pancreatic adenocarcinoma study (17), suggesting that there is a genetic basis for population variation in hsa-mir-196a2 expression. However, the only other study of miRNA expression and lung cancer survival to our knowledge (10) did not support the role of hsa-mir-196a in lung cancer prognosis. A possible explanation is that the array probes in the other study detected only precursors of, rather than mature, hsa-mir-196a2 miRNA (10), and our study showed that expression levels of precursors of hsa-mir-196a2 were not increased in rs11614913 CC
carriers compared with TT carriers.
Lung cancer is a deadly illness, with a low, 5-year survival rate of less than 15% after initial diagnosis. The assessment of the prog-nosis of patients is essential for the choice of the best therapeutic strategies. One of the major clinical prognostic determinants in NSCLC is tumor extension, roughly characterized by stage. Sur-gery is the recommended treatment in the early stages; and chemo-therapy and radiochemo-therapy have a role either as a part of a treatment strategy to cure locally advanced disease or as a palliative for meta-Table 3
Stratified analysis of combined effects of rs2292832 and rs11614913 geno-types associated with NSCLC patients’ survival by selected variables
Variable 0 unfavorable lociA 1–2 unfavorable lociA HR (95% CI)B
Deaths/patients Deaths/patients
Total 98/281 170/382 1.62 (1.26–2.09)
Stage
I–II 17/107 40/143 2.58 (1.43–4.67)
III–IV 81/174 130/239 1.54 (1.16–2.05)
Smoker
No 33/106 61/144 1.41 (0.92–2.18)
Yes 65/175 109/238 1.73 (1.25–2.37)
Histology
Adenocarcinoma 54/160 101/230 1.61 (1.14–2.26)
Squamous cell 37/106 58/127 1.61 (1.04–2.48)
OthersC 7/15 11/25 2.96 (0.82–10.7)
Surgical operation
No 55/107 78/130 1.55 (1.07–2.23)
Yes 43/174 92/252 1.76 (1.22–2.54)
Chemotherapy or radiotherapy
No 23/59 38/81 2.27 (1.25–4.12)
Yes 75/222 132/301 1.54 (1.16–2.05)
[image:5.585.53.316.127.326.2]Shown are combined data for the 2 patient sets. AThe combined genotypes were dichotomized according to unfavorable loci carried (rs2292832 TT and rs11614913 CC). BAdjusted for age, sex, smoking status, histology, stage, surgical operation, and chemotherapy or radiotherapy status. COther carcinomas include large cell, mixed cell, or undifferentiated carcinomas.
Table 4
Results of stepwise Cox regression analysis on NSCLC-related survival
Final variables β SEM HR 95% CI P
Stage 0.64 0.08 1.89 1.62–2.22 < 0.001
Chemotherapy or radiotherapy –0.87 0.16 0.42 0.31–0.58 <0.001 rs11614913 (CC vs. TT/CT) 0.57 0.14 1.76 1.34–2.32 <0.001 Surgical operation –0.41 0.15 0.66 0.49–0.89 0.006
[image:5.585.249.530.668.731.2]static tumors. However, a large variability in disease outcome was observed for subsets of patients with the same clinical features (19). Beginning at the pretreatment stage, molecular events or interme-diate biomarkers are continually evaluated in order to assess the likelihood of response to treatments and support therapeutic deci-sions (20–22). One can expect a growing trend toward linking the launch of therapeutic methods with diagnostic markers, often genetic, to improve treatment outcome. Molecular epidemiology is integral to pharmacogenetic research, to allow the construction of genetic profiles that could be used to individualized therapy, although the functional genetic variants remain to be determined. An astounding complexity of gene regulation and translation has been revealed in recent studies on small regulatory RNAs (23),
espe-cially the emerging world of miRNAs. The estimates for the total number of human miRNAs range from more than one thousand (24) to tens of thousands (25), and we are just beginning to learn about miRNA performance in normal or malignant human cells. Therefore, further characterization of SNPs of miRNAs would improve our understanding of miRNA biogenesis and the potential contribution of these SNPs to disease development and prognosis, which may also favor therapeutic interventions.
[image:6.585.64.520.71.508.2]Although this is the first study to our knowledge to describe miRNA SNPs and NSCLC outcome with a relatively large study population size and a high statistical power (if we set α = 0.05, based on our data set for hsa-mir-196a2 rs11614913, we have an 80% power to detect an HR of 1.41), some limitations should be Figure 2
research article
The Journal of Clinical Investigation http://www.jci.org Volume 118 Number 7 July 2008 2605
taken into consideration. First, the follow-up period was relatively short for some patients, especially for stage I patients. Second, the mechanisms by which the hsa-mir-196a2 miRNA and its tar-get mRNAs regulate of NSCLC progression are unknown, and the subject warrants further in vitro and in vivostudies.
Methods
Study population.Our study was approved by the Institutional Review Board of Nanjing Medical University, and written informed consent was obtained from all participants or from patients’ representatives if direct consent could not be obtained. All patients were histopathologically diagnosed
as having NSCLC and were prospectively recruited into an ongoing study of lung cancer molecular epidemiology starting in July 2003. At first, we recruited as the test set 755 NSCLC patients from the Cancer Hospital of Jiangsu Province (Nanjing, People’s Republic of China) and the First Affili-ated Hospital of Nanjing Medical University. To validate the findings from the test set, we recruited an additional 138 NSCLC patients from Nanjing Thoracic Hospital as the validation set. All subjects were genetically unre-lated ethnic Han Chinese. Each patient donated 5 ml venous blood upon admission to the hospital and was interviewed to collect demographic data and clinical information. Follow-up was conducted every 3 months by telephone after the first visit to the hospital. Overall, we recruited 893 NSCLC patients (755 from the test set and 138 from the validation set). A total of 687 patients (575 from the test set and 112 from the valida-tion set) had complete follow-ups and clinical informavalida-tion. Among the remaining 206 patients (180 from the test set and 26 from the validation set) with incomplete follow-up/clinical information or without, 65 cases (7.28%) lacked stage and/or histology information; 70 (7.84%) had
incor-Table 5
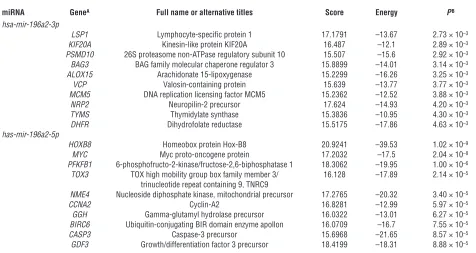
Predicted most probable targets of hsa-mir-196a2
miRNA GeneA Full name or alternative titles Score Energy PB
hsa-mir-196a2-3p
LSP1 Lymphocyte-specific protein 1 17.1791 –13.67 2.73 × 10⁻³
KIF20A Kinesin-like protein KIF20A 16.487 –12.1 2.89 × 10⁻³
PSMD10 26S proteasome non-ATPase regulatory subunit 10 15.507 –15.6 2.92 × 10⁻³
BAG3 BAG family molecular chaperone regulator 3 15.8899 –14.01 3.14 × 10–3
ALOX15 Arachidonate 15-lipoxygenase 15.2299 –16.26 3.25 × 10⁻³
VCP Valosin-containing protein 15.639 –13.77 3.77 × 10⁻³
MCM5 DNA replication licensing factor MCM5 15.2362 –12.52 3.88 × 10⁻³
NRP2 Neuropilin-2 precursor 17.624 –14.93 4.20 × 10⁻³
TYMS Thymidylate synthase 15.3836 –10.95 4.30 × 10⁻³
DHFR Dihydrofolate reductase 15.5175 –17.86 4.63 × 10⁻³
has-mir-196a2-5p
HOXB8 Homeobox protein Hox-B8 20.9241 –39.53 1.02 × 10⁻⁹
MYC Myc proto-oncogene protein 17.2032 –17.5 2.04 × 10⁻⁸
PFKFB1 6-phosphofructo-2-kinase/fructose-2,6-biphosphatase 1 18.3062 –19.95 1.00 × 10–6
TOX3 TOX high mobility group box family member 3/ 16.128 –17.89 2.14 × 10⁻⁵ trinucleotide repeat containing 9, TNRC9
NME4 Nucleoside diphosphate kinase, mitochondrial precursor 17.2765 –20.32 3.40 × 10⁻⁵
CCNA2 Cyclin-A2 16.8281 –12.99 5.97 × 10⁻⁵
GGH Gamma-glutamyl hydrolase precursor 16.0322 –13.01 6.27 × 10⁻⁵
BIRC6 Ubiquitin-conjugating BIR domain enzyme apollon 16.0709 –16.7 7.55 × 10⁻⁵
CASP3 Caspase-3 precursor 15.6968 –21.65 8.57 × 10⁻⁵
GDF3 Growth/differentiation factor 3 precursor 18.4199 –18.31 8.88 × 10⁻⁵
[image:7.585.49.278.82.280.2]AFor each selected miRNA, we list 10 transcripts with potential roles in cancers and the lowest P value. BThe best P value of the selected miRNA for the transcript.
Figure 3
[image:7.585.52.528.476.729.2]Figure 4
research article
The Journal of Clinical Investigation http://www.jci.org Volume 118 Number 7 July 2008 2607 rect telephone numbers; 32 (3.58%) refused to participate; 34 (3.81%) had
ambiguous death date and/or indirect death cause of lung cancer; and 15 (1.68%) moved or were unavailable for unknown reasons. However, there was no significant difference in the distributions of demographic charac-ters (e.g., age and sex), smoking status, stage, and histology between the NSCLC cases with and without follow-up/clinical information (P = 0.667 for age, P = 0.378 for sex, P = 0.495 for smoking status, P = 0.103 for stage, and P = 0.242 for histology). Those who had smoked less than 1 cigarette per day and less than 1 year in their lifetime were considered nonsmokers; all others were considered smokers.
Tissue samples.In order to determine the expression levels of miRNA, we collected 23 lung cancer tissues from patients who had undergone resection for adenocarcinoma or squamous cell carcinoma between June and October 2007 from the First Affiliated Hospital of Nanjing Medical University. All cases were histopathologically diagnosed as having stage I, II, or IIIa NSCLC without radiotherapy or chemotherapy before surgical operation.
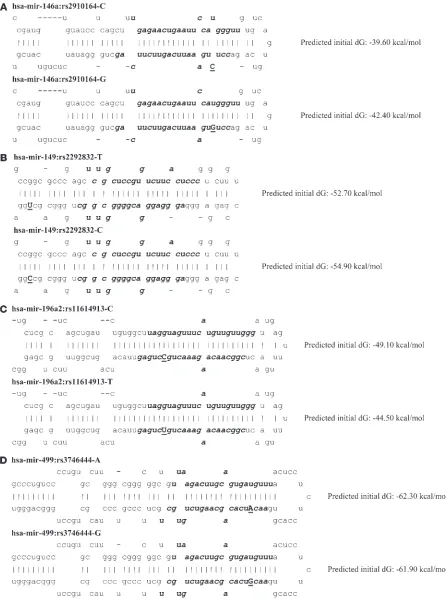
SNP identification of pre-miRNAs and their surrounding regions.We identified 273 common genetic variants located in pre-miRNAs and their surrounding regions for all the ethnic groups (Asian, European, and African) of 400 known human miRNAs. Among them, 6 SNPs were located at the pre-miRNA regions designated as class A/B (class A: located in 5p or 3p mature miRNA regions; class B: located in other regions of pre-miRNAs), 61 at 100-bp flanking regions of the pre-miRNAs (designated as class C), 58 at approxi-mately 100- to 200-bp flanking regions (class D), and 148 at approxiapproxi-mately 200- to 450-bp flanking regions (class E), which corresponded to 0.15, 0.76, 0.73, and 0.74 SNPs per kbp (100 bp per pre-miRNA on average). The class A/B SNPs were significantly fewer in number than those of other classes (P < 0.01 for all comparisons), suggesting that the pre-miRNA regions were highly conserved. For Chinese individuals, we identified 5 SNPs located at the pre-miRNA regions (3 in 5p or 3p mature miRNA regions: hsa-mir-146a rs2910164 C→G, hsa-mir-196a2 rs11614913 C→T, and hsa-mir-499 rs3746444 G→A; and 2 in other regions of pre-miRNAs: hsa-mir-149 rs2292832 and hsa-mir-423 rs6505162). The SNPs located in mature miRNA regions may directly affect the binding of target mRNA and also the pre-miRNA matura-tion process, whereas the SNPs located in other regions of pre-miRNAs may affect pre-miRNA maturation (12). We performed miRNA secondary struc-ture prediction using mfold 3.2 online software (http://frontend.bioinfo.rpi. edu/applications/mfold/) for each allele of the 5 SNPs (26).
Identification of the most probable mRNA targets of hsa-mir-196a2. To identify cancer-related mRNA targets for hsa-mir-196a2 (3p and 5p were separated), we searched the miRBase database (http://microrna.sanger.ac.uk/targets/v5/) (13) and selected 10 transcripts with potential roles in cancers and the low-est P value for each of the miRNAs. As shown in Table 5, the transcripts of the genes participating in diverse cancer-related pathways could be targeted
by hsa-mir-196a, and a few of them have been experimentally verified (27). Studies showed that the cleavage of mRNAs of HOX gene clusters was partly hsa-mir-196a directed (27), and HOXD10 was identified recently as gene tar-get for initiation of breast cancer invasion and metastasis (28). Moreover, LSP1 and TOX3 (TNRC9) mRNAs were targeted by hsa-mir-196a2-3p and hsa-mir-196a2-5p, respectively, and these 2 gene loci were also identified as novel breast cancer susceptibility markers in large-scale whole-genome association studies (29). Therefore, LSP1 3′ UTR was selected to perform the report gene assays in the present study.
Genotyping.We genotyped 3 class A SNPs (rs2910164, rs11614913, and rs3746444) and 1 class B SNP (rs2292832) (Figure 4). The other class B SNP (rs6505162), which did not affect the hydrogen bond and predicted secondary structure free energy, was not included in this study. These SNPs were detected using the PCR-RFLP assay, and the primers and restriction enzymes (New England BioLabs Inc.) are presented in Table 6. Genotyp-ing was performed without knowledge of the subjects’ case and control status, and the same numbers of cases and controls were assayed in each 96-well PCR plate, with a positive control of a DNA sample with known heterozygous genotype. Two researchers independently read the gel pic-tures and performed repeated assays if they did not reach a consensus on the tested genotype. In addition, 10% of the samples were randomly selected for the repeated assays, and the results were 100% concordant. PCR prod-ucts of the SNPs with different genotypes were randomly selected and con-firmed by direct sequencing using an automated sequencer. DNA quality or quantity was insufficient for genotyping in 24 of the 687 samples (19 for the test set, 5 for the validation set); thus, the final analyses included 663 cases (556 from the test set, 107 from the validation set).
Quantitative RT-PCR.Quantitative RT-PCR was used to determine the expression of miRNA hsa-mir-196a2. RNAs from lung cancer tissues were isolated with the mirVana miRNA Isolation Kit (Applied Biosystems Inc.). Real-time PCR was performed with Power SYBR Green PCR Master Mix (Applied Biosystems Inc.), and the primers are shown in Figure 2A (F1/R for pri-miRNA, F2/R for pri- and pre-miRNA). Primers 5′ -AGAAAATCTG-GCACCACACC-3′ and 5′-GGGGTGTTGAAGGTCTCAAA-3′ were used to amplify the β-actin gene to normalize the expression of pri- and pre-miRNAs. Mature miRNAs were determined using TaqManmicroRNA Assays (Applied Biosystems Inc.). Normalization was performed with the small nuclear RNA U6 (RNU6B; Applied Biosystems Inc.). All real-time reac-tions, including no-template controls and real-time minus controls, were run using the ABI7000 Real-Time PCR System (Applied Biosystems Inc.) and performed in triplicate. Relative expression was calculated using the Ct values provided by the manufacturer.
Construction of hsa-mir-196a2 expression plasmid and LSP1 3′UTR luciferase reporter plasmid.To express precursors for hsa-mir-196a2, the pri-miRNA
Table 6
Primary information from genotyping assay of miRNA SNPs
Gene Position and Genotyping assay Primer PCR Enzyme Enzyme
base change product products
rs2910164 G→C PCR-RFLP: mismatch, CATGGGTTGTGTCAGTGTCAGAGCT (sense); 147 bp SacI G allele: 147b; sense primer –3C→GA TGCCTTCTGTCTCCAGTCTTCCAA (antisense) C allele: 122 bp, 25 bp rs2292832 C→T PCR-RFLP TGTCTTCACTCCCGTGCTTGTCC (sense); 254 bp PvuII C allele: 254 bp;
TGAGGCCCGAAACACCCGTA (antisense) T allele: 194 bp, 60 bp rs11614913 C→T PCR-RFLP: mismatch, CCCCTTCCCTTCTCCTCCAGATA (sense); 149 bp MspI C allele: 125bp, 24 bp;
antisense primer +2T→GB CGAAAACCGACTGATGTAACTCCG (antisense) T allele: 149 bp rs3746444 C→T PCR-RFLP: mismatch, CAAAGTCTTCACTTCCCTGCCA (sense); 146 bp BclI T allele: 120 bp, 26 bp;
antisense primer +2T→A GATGTTTAACTCCTCTCCACGTGATC (antisense) C allele: 146 bp
sequence was amplified by PCR using primers 5′ -TCCAAAGCTTC-TAATGAAGGCAGTCAGAC-3′ and 5′ -CTAGTCTAGAGGATAGGTT-GAGAGGACGG-3′ from a genomic DNA sample with rs11614913 TT genotype and cloned into pcDNA3.1 plasmids with HindIII and XbaI digestion (Invitrogen). Plasmids containing the rs11614913 C allele were generated using site-specific mutagenesis. LSP1 3′UTR was amplified using primers 5′-GTAGACGCGTGCACCCCATGCCTATGTTC-3′ and 5′-TCCAAAGCTTGGACGCAGCATCAAGCATC-3′ from a genomic DNA sample and cloned into pMIR-REPORT plasmids with MluI and HindIII digestion (Applied Biosystems Inc.). All constructs used in this study were restriction mapped and sequenced to confirm their authenticity.
Transient transfections and luciferase assays.Two sets of transfections were per-formed with CHO, 293T, and A549 cells using Lipofectamine 2000 accord-ing to the manufacturer’s recommendations (Invitrogen). One set was the LSP1 3′UTR luciferase reporter plasmids and chemically synthesized mature hsa-mir-196a2-3p miRNAs (C or U allele), and the other was the LSP1 3′UTR luciferase reporter plasmidsand hsa-mir-196a2 expression plasmids (C or T allele). Each set was cotransfected with pRL-SV40 plasmids (Promega) as a normalizing control. All transfections were carried out in triplicate. After 24 hours of incubation, cells were collected and analyzed for luciferase activity with the Dual-Luciferase Reporter Assay System (Promega).
Statistics.Survival time was calculated from the date of lung cancer diag-nose to the date of death or last follow-up. The associations between over-all survival and demographic characteristics, clinical features, and miRNA SNPs were estimated using the Kaplan-Meier method and log-rank test. Mean survival time was presented when the MST could not be calculated.
Univariate or multivariate Cox proportional hazards regression models were preformed to estimate the crude HRs or adjusted HRs and their 95% CIs. The Cox stepwise regression model was also used to determine fac-tors predictive of NSCLC outcome, with a significance level of P < 0.05 for entering and P > 0.10 for removal of the respective explanatory variables. All the statistical analyses were performed with Statistical Analysis System software (v.9.1.3; SAS Institute).
Acknowledgments
We would like to thank Qingyi Wei of the University of Texas MD Anderson Cancer Center for scientific editing and Xiao Han of Nanjing Medical University for technical support of the functional assays. This work was supported in part by a Key Grant from the National Natural Science Foundation of China (no. 30730080); the National Outstanding Youth Science Foundation of China (no. 30425001); and a China National Key Basic Research Program grant (no. 2002CB512902).
Received for publication January 4, 2008, and accepted in revised form April 16, 2008.
Address correspondence to: Hongbing Shen, Department of Epi-demiology and Biostatistics, Cancer Center of Nanjing Medical University, 140 Hanzhong Rd., Nanjing 210029, People’s Republic of China. Phone: 86-25-868-62756; Fax: 86-25-868-62756; E-mail: hbshen@njmu.edu.cn.
1. Ludwig, J.A., and Weinstein, J.N. 2005. Biomarkers in cancer staging, prognosis and treatment selec-tion. Nat. Rev. Cancer. 5:845–856.
2. Ambros, V. 2004. The functions of animal micro-RNAs. Nature. 431:350–355.
3. Bartel, D.P. 2004. MicroRNAs: genomics, biogen-esis, mechanism, and function. Cell. 116:281–297. 4. Zamore, P.D., and Haley, B. 2005. Ribo-gnome: the
big world of small RNAs. Science. 309:1519–1524. 5. Ambros, V. 2003. MicroRNA pathways in flies and
worms: growth, death, fat, stress, and timing. Cell. 113:673–676.
6. Lu, J., et al. 2005. MicroRNA expression profiles classify human cancers. Nature. 435:834–838. 7. Kumar, M.S., et al. 2007. Impaired microRNA
processing enhances cellular transformation and tumorigenesis. Nat. Genet. 39:673–677.
8. Kent, O.A., and Mendell, J.T. 2006. A small piece in the cancer puzzle: microRNAs as tumor suppres-sors and oncogenes. Oncogene. 25:6188–6196. 9. Esquela-Kerscher, A., and Slack, F.J. 2006. Oncomirs
— microRNAs with a role in cancer. Nat. Rev. Cancer. 6:259–269.
10. Yanaihara, N., et al. 2006. Unique microRNA molecular profiles in lung cancer diagnosis and prognosis. Cancer Cell. 9:189–198.
11. Lujambio, A., et al. 2007. Genetic unmasking of an epigenetically silenced microRNA in human cancer
cells. Cancer Res. 67:1424–1429.
12. Duan, R., Pak, C., and Jin, P. 2007. Single nucleo-tide polymorphism associated with mature miR-125a alters the processing of pri-miRNA. Hum. Mol. Genet. 16:1124–1131.
13. Griffiths-Jones, S. 2004. The microRNA registry.
Nucleic Acids Res. 32:D109–D111.
14. Croce, C.M., and Calin, G.A. 2005. miRNAs, cancer, and stem cell division. Cell. 122:6–7.
15. Calin, G.A., et al. 2005. A MicroRNA signature associ-ated with prognosis and progression in chronic lym-phocytic leukemia. N. Engl. J. Med. 353:1793–1801. 16. Raveche, E.S., et al. 2007. Abnormal microRNA-16
locus with synteny to human 13q14 linked to CLL in NZB mice. Blood. 109:5079–5086.
17. Bloomston, M., et al. 2007. MicroRNA expression patterns to differentiate pancreatic adenocarcino-ma from noradenocarcino-mal pancreas and chronic pancreatitis.
JAMA. 297:1901–1908.
18. Iorio, M.V., et al. 2005. MicroRNA gene expression deregulation in human breast cancer. Cancer Res. 65:7065–7070.
19. Danesi, R., et al. 2003. Pharmacogenetics of anti-cancer drug sensitivity in non–small cell lung can-cer. Pharmacol. Rev. 55:57–103.
20. Spitz, M.R., Wu, X., and Mills, G. 2005. Integrative epidemiology: from risk assessment to outcome prediction. J. Clin. Oncol. 23:267–275.
21. Sadée, W., and Dai, Z. 2005. Pharmacogenetics/ genomics and personalized medicine. Hum. Mol. Genet. 14:R207–R214.
22. Marsh, S., and McLeod, H.L. 2006. Pharmacoge-nomics: from bedside to clinical practice. Hum. Mol. Genet. 15:R89–R93.
23. Mattick, J.S., and Makunin, I.V. 2005. Small regulatory RNAs in mammals. Hum. Mol. Genet. 14:R121–R132.
24. Berezikov, E., et al. 2005. Phylogenetic shadow-ing and computational identification of human microRNA genes. Cell. 120:21–24.
25. Miranda, K.C., et al. 2006. A pattern-based method for the identification of MicroRNA binding sites and their corresponding heteroduplexes. Cell. 126:1203–1217.
26. Zuker, M. 2003. Mfold web server for nucleic acid folding and hybridization prediction. Nucleic Acids Res. 31:3406–3415.
27. Yekta, S., Shih, I.H., and Bartel, D.P. 2004. Micro-RNA-directed cleavage of HOXB8 mRNA. Science.
304:594–596.
28. Ma, L., Teruya-Feldstein, J., and Weinberg, R.A. 2007. Tumour invasion and metastasis initiated by micro-RNA-10b in breast cancer. Nature. 449:682–688. 29. Easton, D.F., et al. 2007. Genome-wide association